 Download:
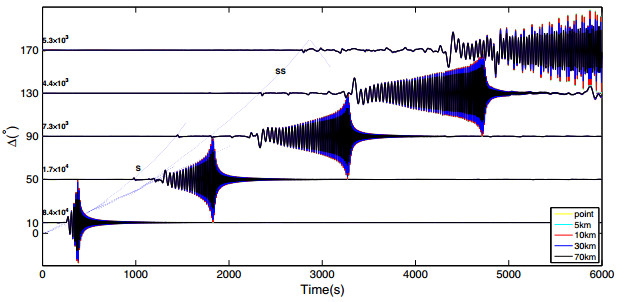
Transverse component of the synthetic seismograms in front of the rupture for sources with the same rupture velocity, the same seismic moment but different rupture length. The dotted line is travel time curves of S and SS phase generated by TauP Toolkit. The rupture velocity is 0.024 deg/s, and the rupture length is 5 km (light blue), 10 km (red), 30 km (dark blue) and 70 km (black). The yellow line is the synthetic seismogram for point source. The waveforms are normalized according to the maximum amplitude in the point source seismogram with the same epicentral distance. The number on the left is the maximum amplitude in the point source seismogram. Note that we plot the seismograms throughout this paper if not stated otherwise. We can observe from this figure that the synthetic seismograms in front of the rupture for every rupture length are all very similar to those of the point sources
Figures of the Article
-
![]() Geometry of the receiver and the finite source. The global spherical coordinate is selected such that the line connecting the origin and the "Northpole" is perpendicular to the fault plane. The local coordinate at the receiver (x) is the "ZRT" coordinate. The basis of local coordinate at the receiver is
Geometry of the receiver and the finite source. The global spherical coordinate is selected such that the line connecting the origin and the "Northpole" is perpendicular to the fault plane. The local coordinate at the receiver (x) is the "ZRT" coordinate. The basis of local coordinate at the receiver is 
-
![]() Transverse component of the synthetic seismograms in front of the rupture for sources with the same rupture velocity, the same seismic moment but different rupture length. The dotted line is travel time curves of S and SS phase generated by TauP Toolkit. The rupture velocity is 0.024 deg/s, and the rupture length is 5 km (light blue), 10 km (red), 30 km (dark blue) and 70 km (black). The yellow line is the synthetic seismogram for point source. The waveforms are normalized according to the maximum amplitude in the point source seismogram with the same epicentral distance. The number on the left is the maximum amplitude in the point source seismogram. Note that we plot the seismograms throughout this paper if not stated otherwise. We can observe from this figure that the synthetic seismograms in front of the rupture for every rupture length are all very similar to those of the point sources
Transverse component of the synthetic seismograms in front of the rupture for sources with the same rupture velocity, the same seismic moment but different rupture length. The dotted line is travel time curves of S and SS phase generated by TauP Toolkit. The rupture velocity is 0.024 deg/s, and the rupture length is 5 km (light blue), 10 km (red), 30 km (dark blue) and 70 km (black). The yellow line is the synthetic seismogram for point source. The waveforms are normalized according to the maximum amplitude in the point source seismogram with the same epicentral distance. The number on the left is the maximum amplitude in the point source seismogram. Note that we plot the seismograms throughout this paper if not stated otherwise. We can observe from this figure that the synthetic seismograms in front of the rupture for every rupture length are all very similar to those of the point sources
-
![]() Transverse component of the synthetic seismograms on the back of the rupture for sources with the same rupture velocity, the same seismic moment but different rupture length. The dotted line is travel time curves of S and SS phase generated by TauP Toolkit. The rupture velocity is 0.024 deg/s, and the rupture length is 5 km (light blue), 10 km (red), 30 km (dark blue) and 70 km (black). The yellow line is the synthetic seismogram for point source. Note that the synthetic seismograms on the back of the rupture have smaller amplitudes than those of point sources. Moreover, for large rupture length, zero-amplitude "knots" can be observed
Transverse component of the synthetic seismograms on the back of the rupture for sources with the same rupture velocity, the same seismic moment but different rupture length. The dotted line is travel time curves of S and SS phase generated by TauP Toolkit. The rupture velocity is 0.024 deg/s, and the rupture length is 5 km (light blue), 10 km (red), 30 km (dark blue) and 70 km (black). The yellow line is the synthetic seismogram for point source. Note that the synthetic seismograms on the back of the rupture have smaller amplitudes than those of point sources. Moreover, for large rupture length, zero-amplitude "knots" can be observed
-
![]() Transverse component of the synthetic seismograms in front of the rupture for sources with the same rupture length, the same seismic moment but different rupture velocity. The dotted line is travel time curves of S and SS phase generated by TauP Toolkit. The rupture length is 70 km, and the rupture velocity is 0.028 deg/s (light blue), 0.024 deg/s (red), 0.022 deg/s (dark blue) and 0.020 deg/s (black). The yellow line is the synthetic seismogram for point source. Note that the seismograms of sources that propagate slowly have small amplitudes, especially for the high-frequency component
Transverse component of the synthetic seismograms in front of the rupture for sources with the same rupture length, the same seismic moment but different rupture velocity. The dotted line is travel time curves of S and SS phase generated by TauP Toolkit. The rupture length is 70 km, and the rupture velocity is 0.028 deg/s (light blue), 0.024 deg/s (red), 0.022 deg/s (dark blue) and 0.020 deg/s (black). The yellow line is the synthetic seismogram for point source. Note that the seismograms of sources that propagate slowly have small amplitudes, especially for the high-frequency component
-
![]() Transverse component of the synthetic seismograms in front of the rupture for sources with the same rupture length, the same seismic moment but different rupture velocity. The dotted line is travel time curves of S and SS phase generated by TauP Toolkit. The rupture length is 70 km, and the rupture velocity is 0.028 deg/s (light blue), 0.024 deg/s (red), 0.022 deg/s (dark blue) and 0.020 deg/s (black). The yellow line is the synthetic seismogram for point source. Note that the synthetic seismograms on the back of the rupture have smaller amplitudes than those of point sources. Moreover, for large rupture length, zero-amplitude "knots" can be observed
Transverse component of the synthetic seismograms in front of the rupture for sources with the same rupture length, the same seismic moment but different rupture velocity. The dotted line is travel time curves of S and SS phase generated by TauP Toolkit. The rupture length is 70 km, and the rupture velocity is 0.028 deg/s (light blue), 0.024 deg/s (red), 0.022 deg/s (dark blue) and 0.020 deg/s (black). The yellow line is the synthetic seismogram for point source. Note that the synthetic seismograms on the back of the rupture have smaller amplitudes than those of point sources. Moreover, for large rupture length, zero-amplitude "knots" can be observed
-
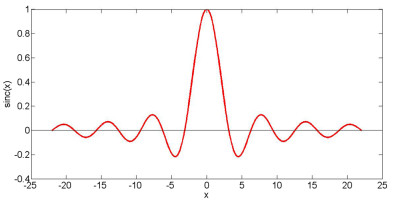
![]() Graph of the "sinc" function. sinc(0) is the maximum of the function, and the value rapidly decays away from 0. Moreover, sinc(nπ)=0 for n is nonzero integer
Graph of the "sinc" function. sinc(0) is the maximum of the function, and the value rapidly decays away from 0. Moreover, sinc(nπ)=0 for n is nonzero integer
-
![]() Zero-amplitude "knots" in synthetic seismograms. Note that they exist near the position that correspond to the group velocity of 50 mHz Love wave
Zero-amplitude "knots" in synthetic seismograms. Note that they exist near the position that correspond to the group velocity of 50 mHz Love wave


Related articles
-
2025, 38(3): 253-262. DOI: 10.1016/j.eqs.2025.01.003
-
2024, 37(2): 93-106. DOI: 10.1016/j.eqs.2024.01.014
-
2018, 31(4): 208-214. DOI: 10.29382/eqs-2018-0208-4
-
2018, 31(4): 175-186. DOI: 10.29382/eqs-2018-0175-1
-
2018, 31(4): 75-75. DOI: 10.29382/eqs-2018-0224-6
-
2017, 30(1): 17-32. DOI: 10.1007/s11589-017-0175-6
-
2014, 27(1): 101-106. DOI: 10.1007/s11589-014-0065-0
-
2013, 26(5): 321-329. DOI: 10.1007/s11589-013-0038-8
-
2011, 24(5): 419-426. DOI: 10.1007/s11589-011-0804-4
-
2011, 24(2): 207-220. DOI: 10.1007/s11589-010-0785-8