 Download:
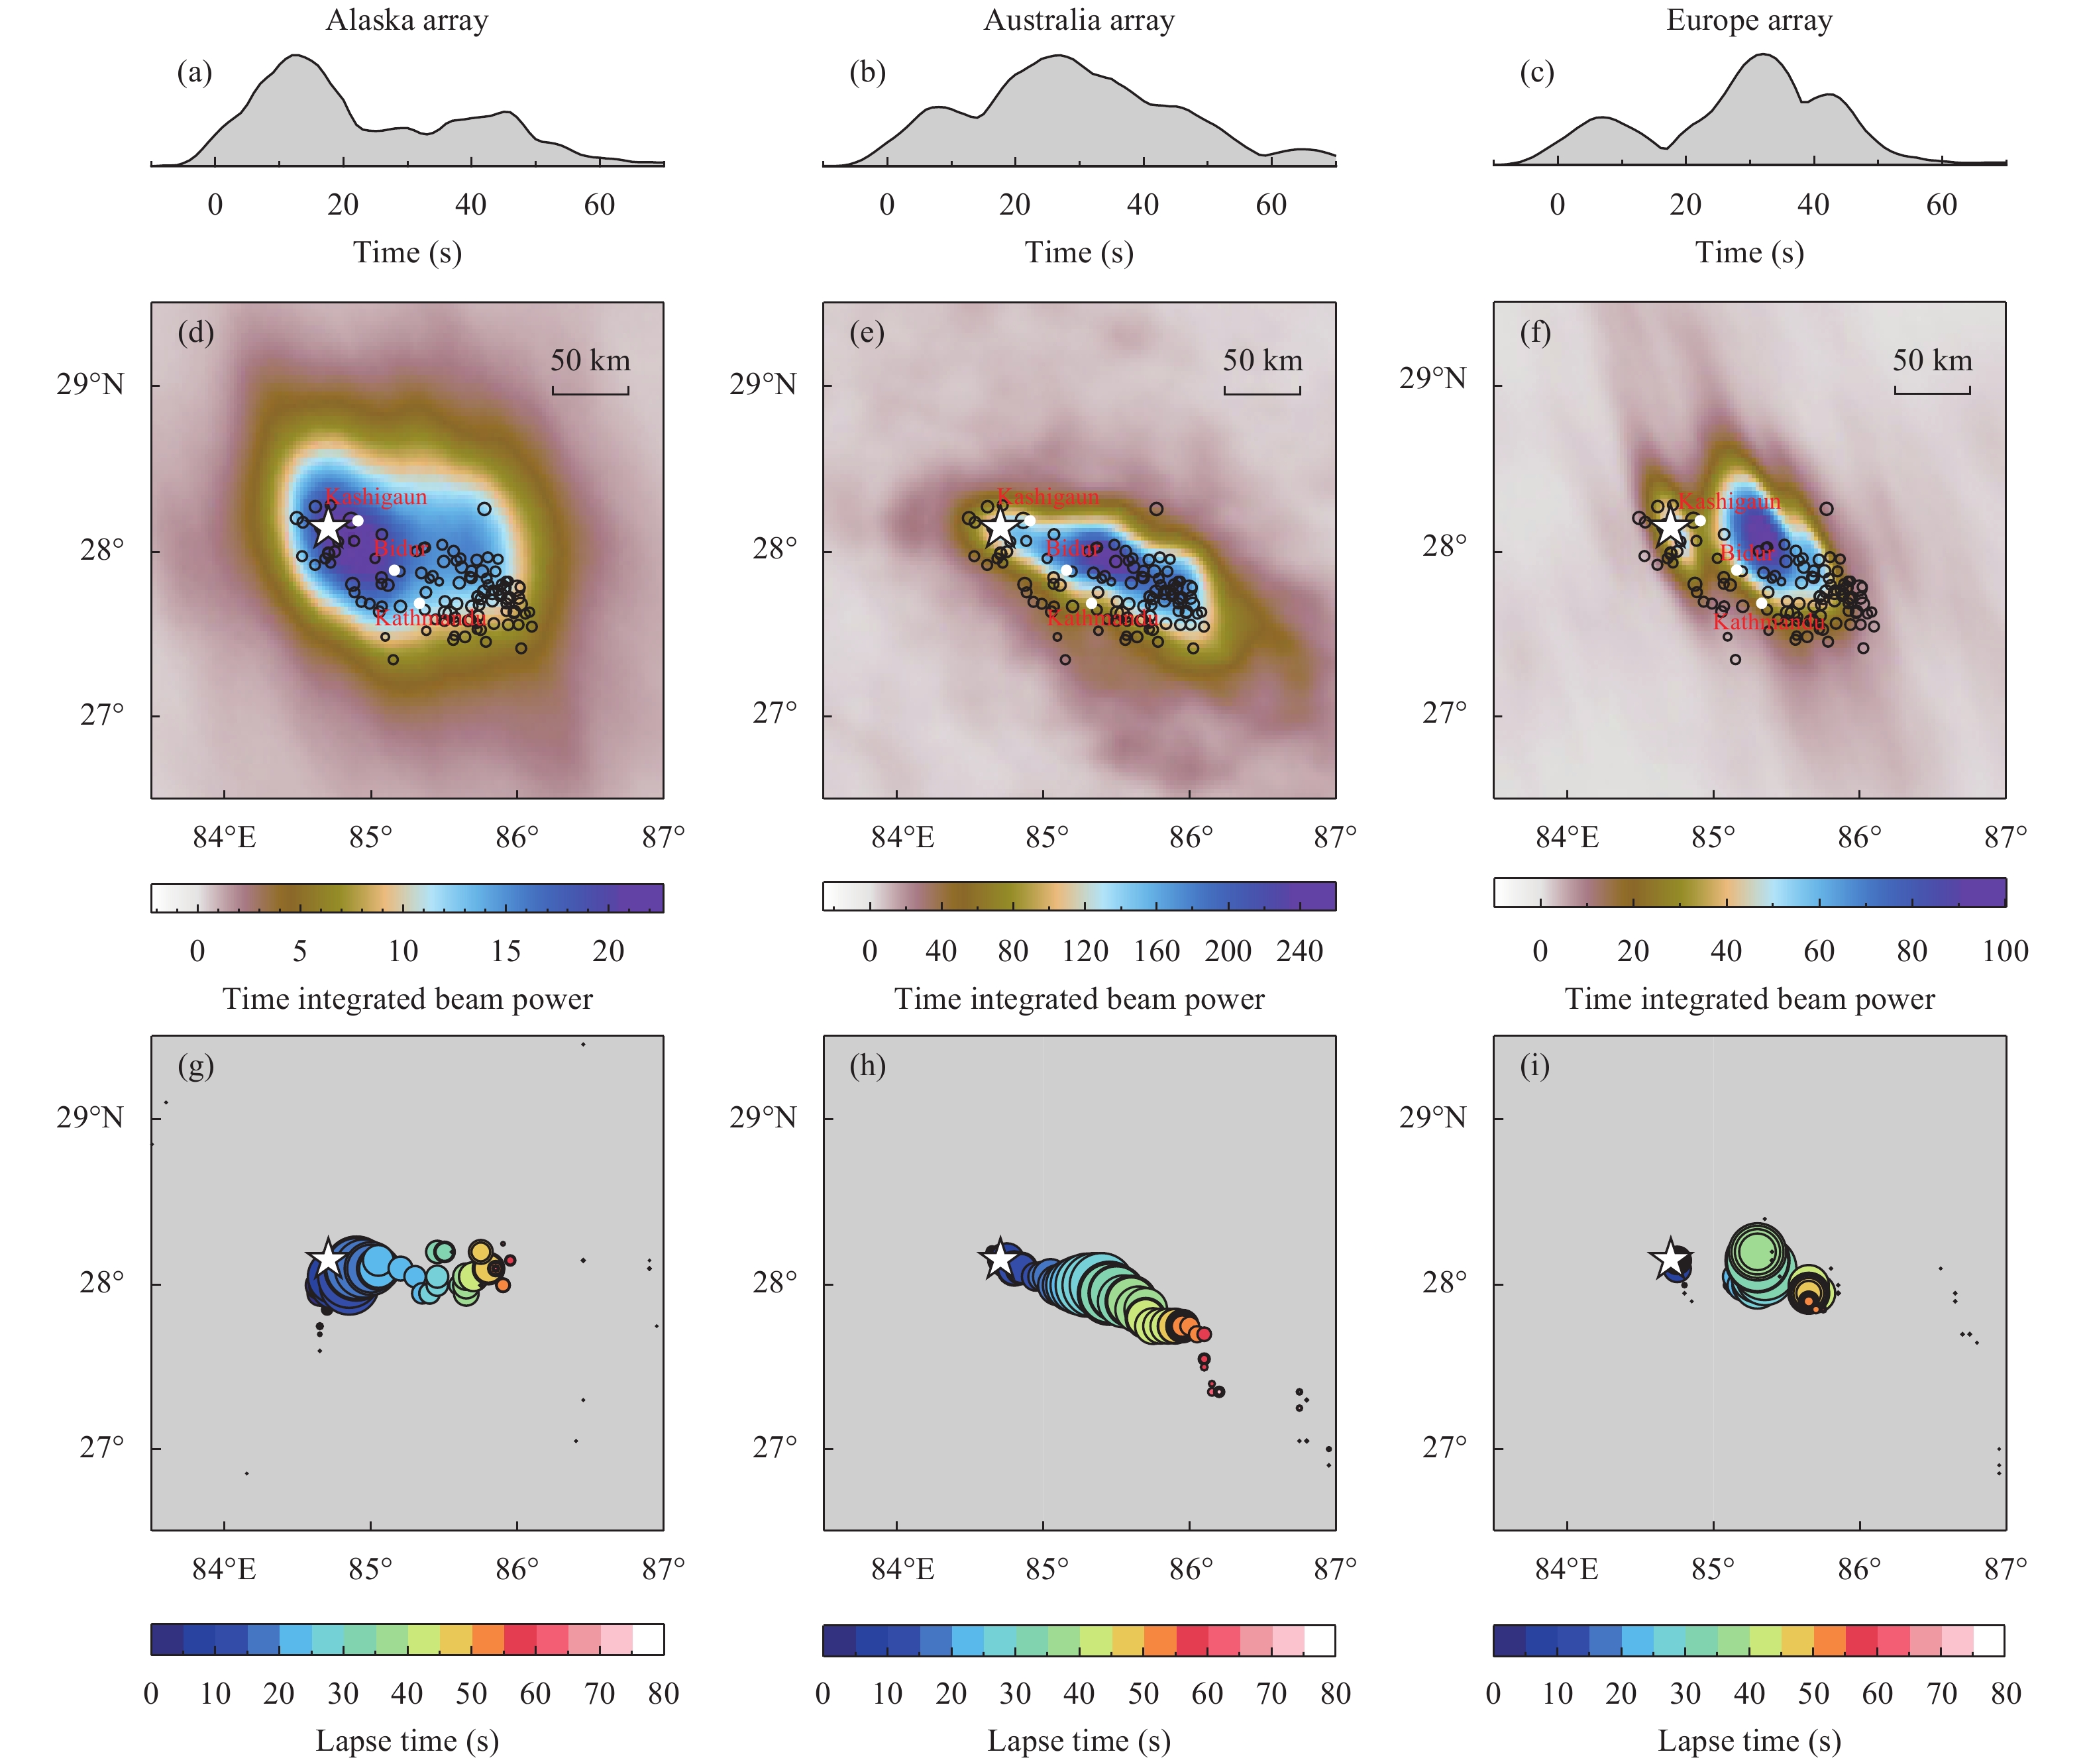
Rupture propagation images for back-projection of teleseismic short-period P waves for the three subarrays (Figure 2a). The top (a-c), middle (d-f) and bottom (g-i) panels, respectively, show the time evolution of maximum beam power, the time-integrated beam power and the space-time sequences coherent energy for networks in Alaska, Australia and Europe. The circles are color-coded for elapsed time and scaled relative to peak beam power. The white stars indicate the mainshock epicenter and the black circles in subplots d—f represent early aftershocks
Figures of the Article
-
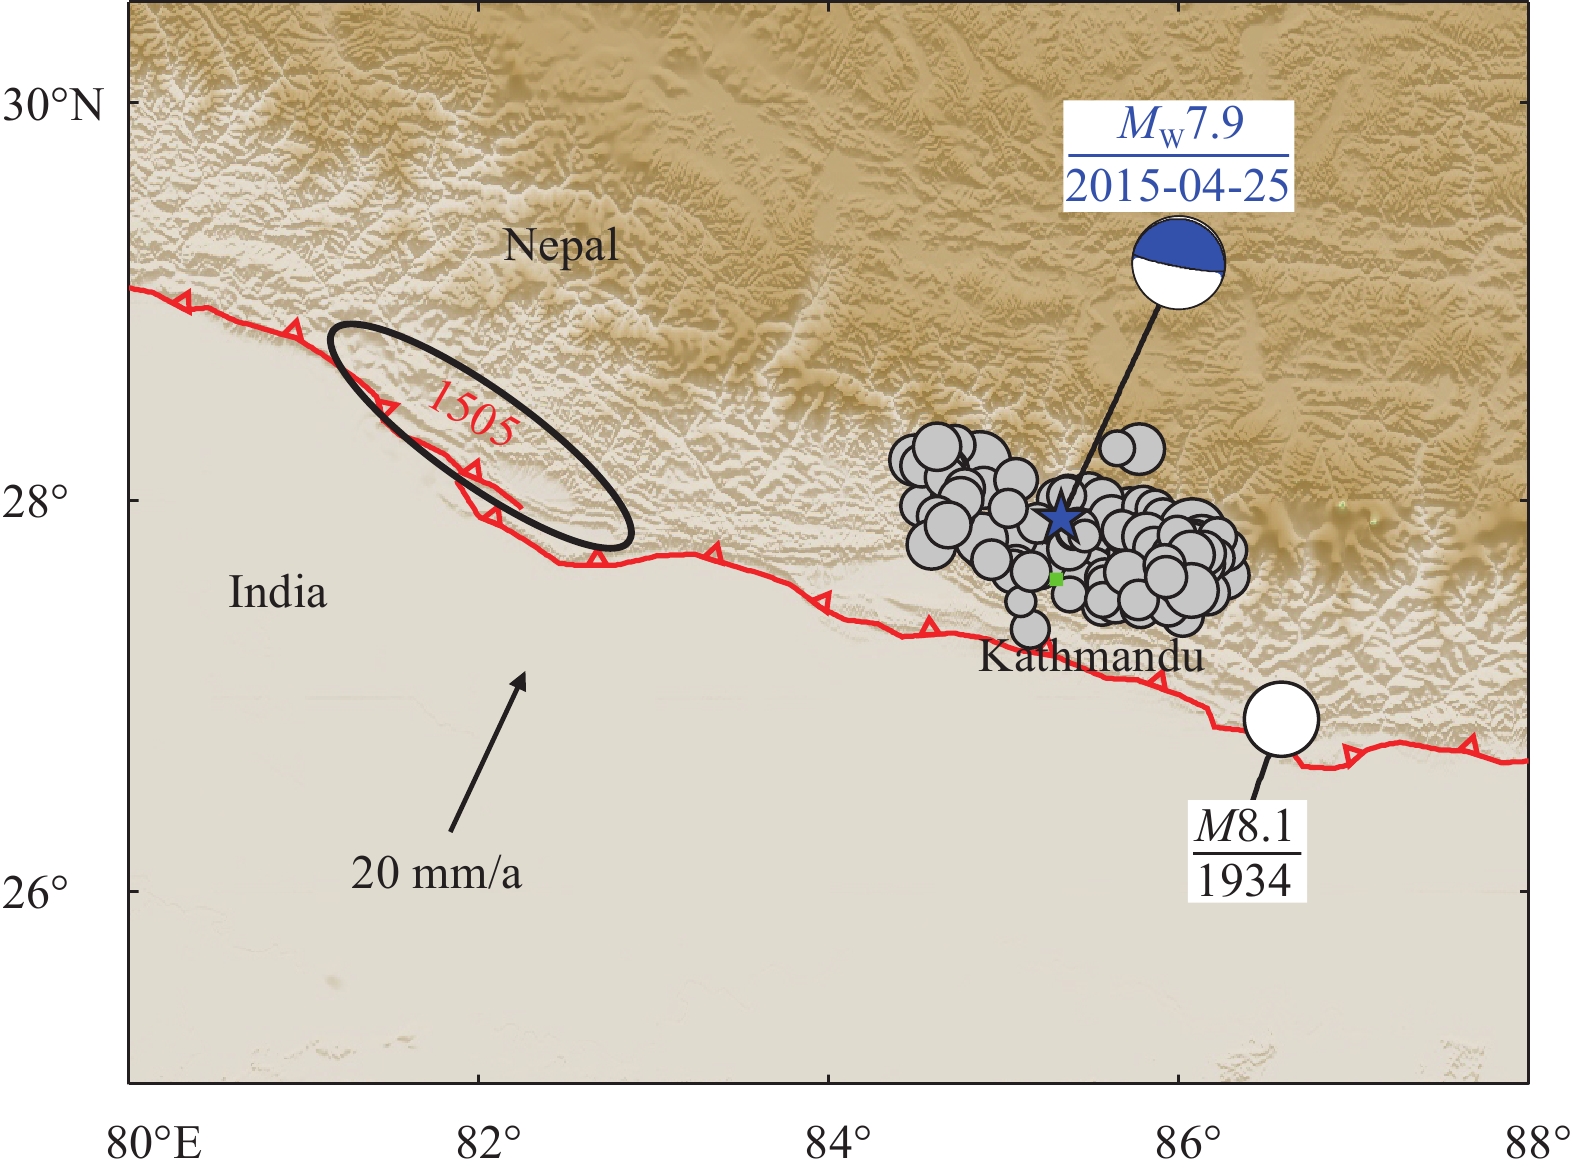
![]() Tectonic setting of the 2015 MW7.9 Nepal earthquake and its aftershocks distribution. The red line indicates the Main Himalayan Thrust fault (MHT). The black arrow shows the Indian plate subducting northward beneath the Eurasian Plate with a convergence rate of ~ 20 mm/a (from Ader, 2012). The black ellipse shows the possible rupture region of the 1505 MW 8.2 Lo Mustang earthquake (from Ader et al., 2012)
Tectonic setting of the 2015 MW7.9 Nepal earthquake and its aftershocks distribution. The red line indicates the Main Himalayan Thrust fault (MHT). The black arrow shows the Indian plate subducting northward beneath the Eurasian Plate with a convergence rate of ~ 20 mm/a (from Ader, 2012). The black ellipse shows the possible rupture region of the 1505 MW 8.2 Lo Mustang earthquake (from Ader et al., 2012)
-
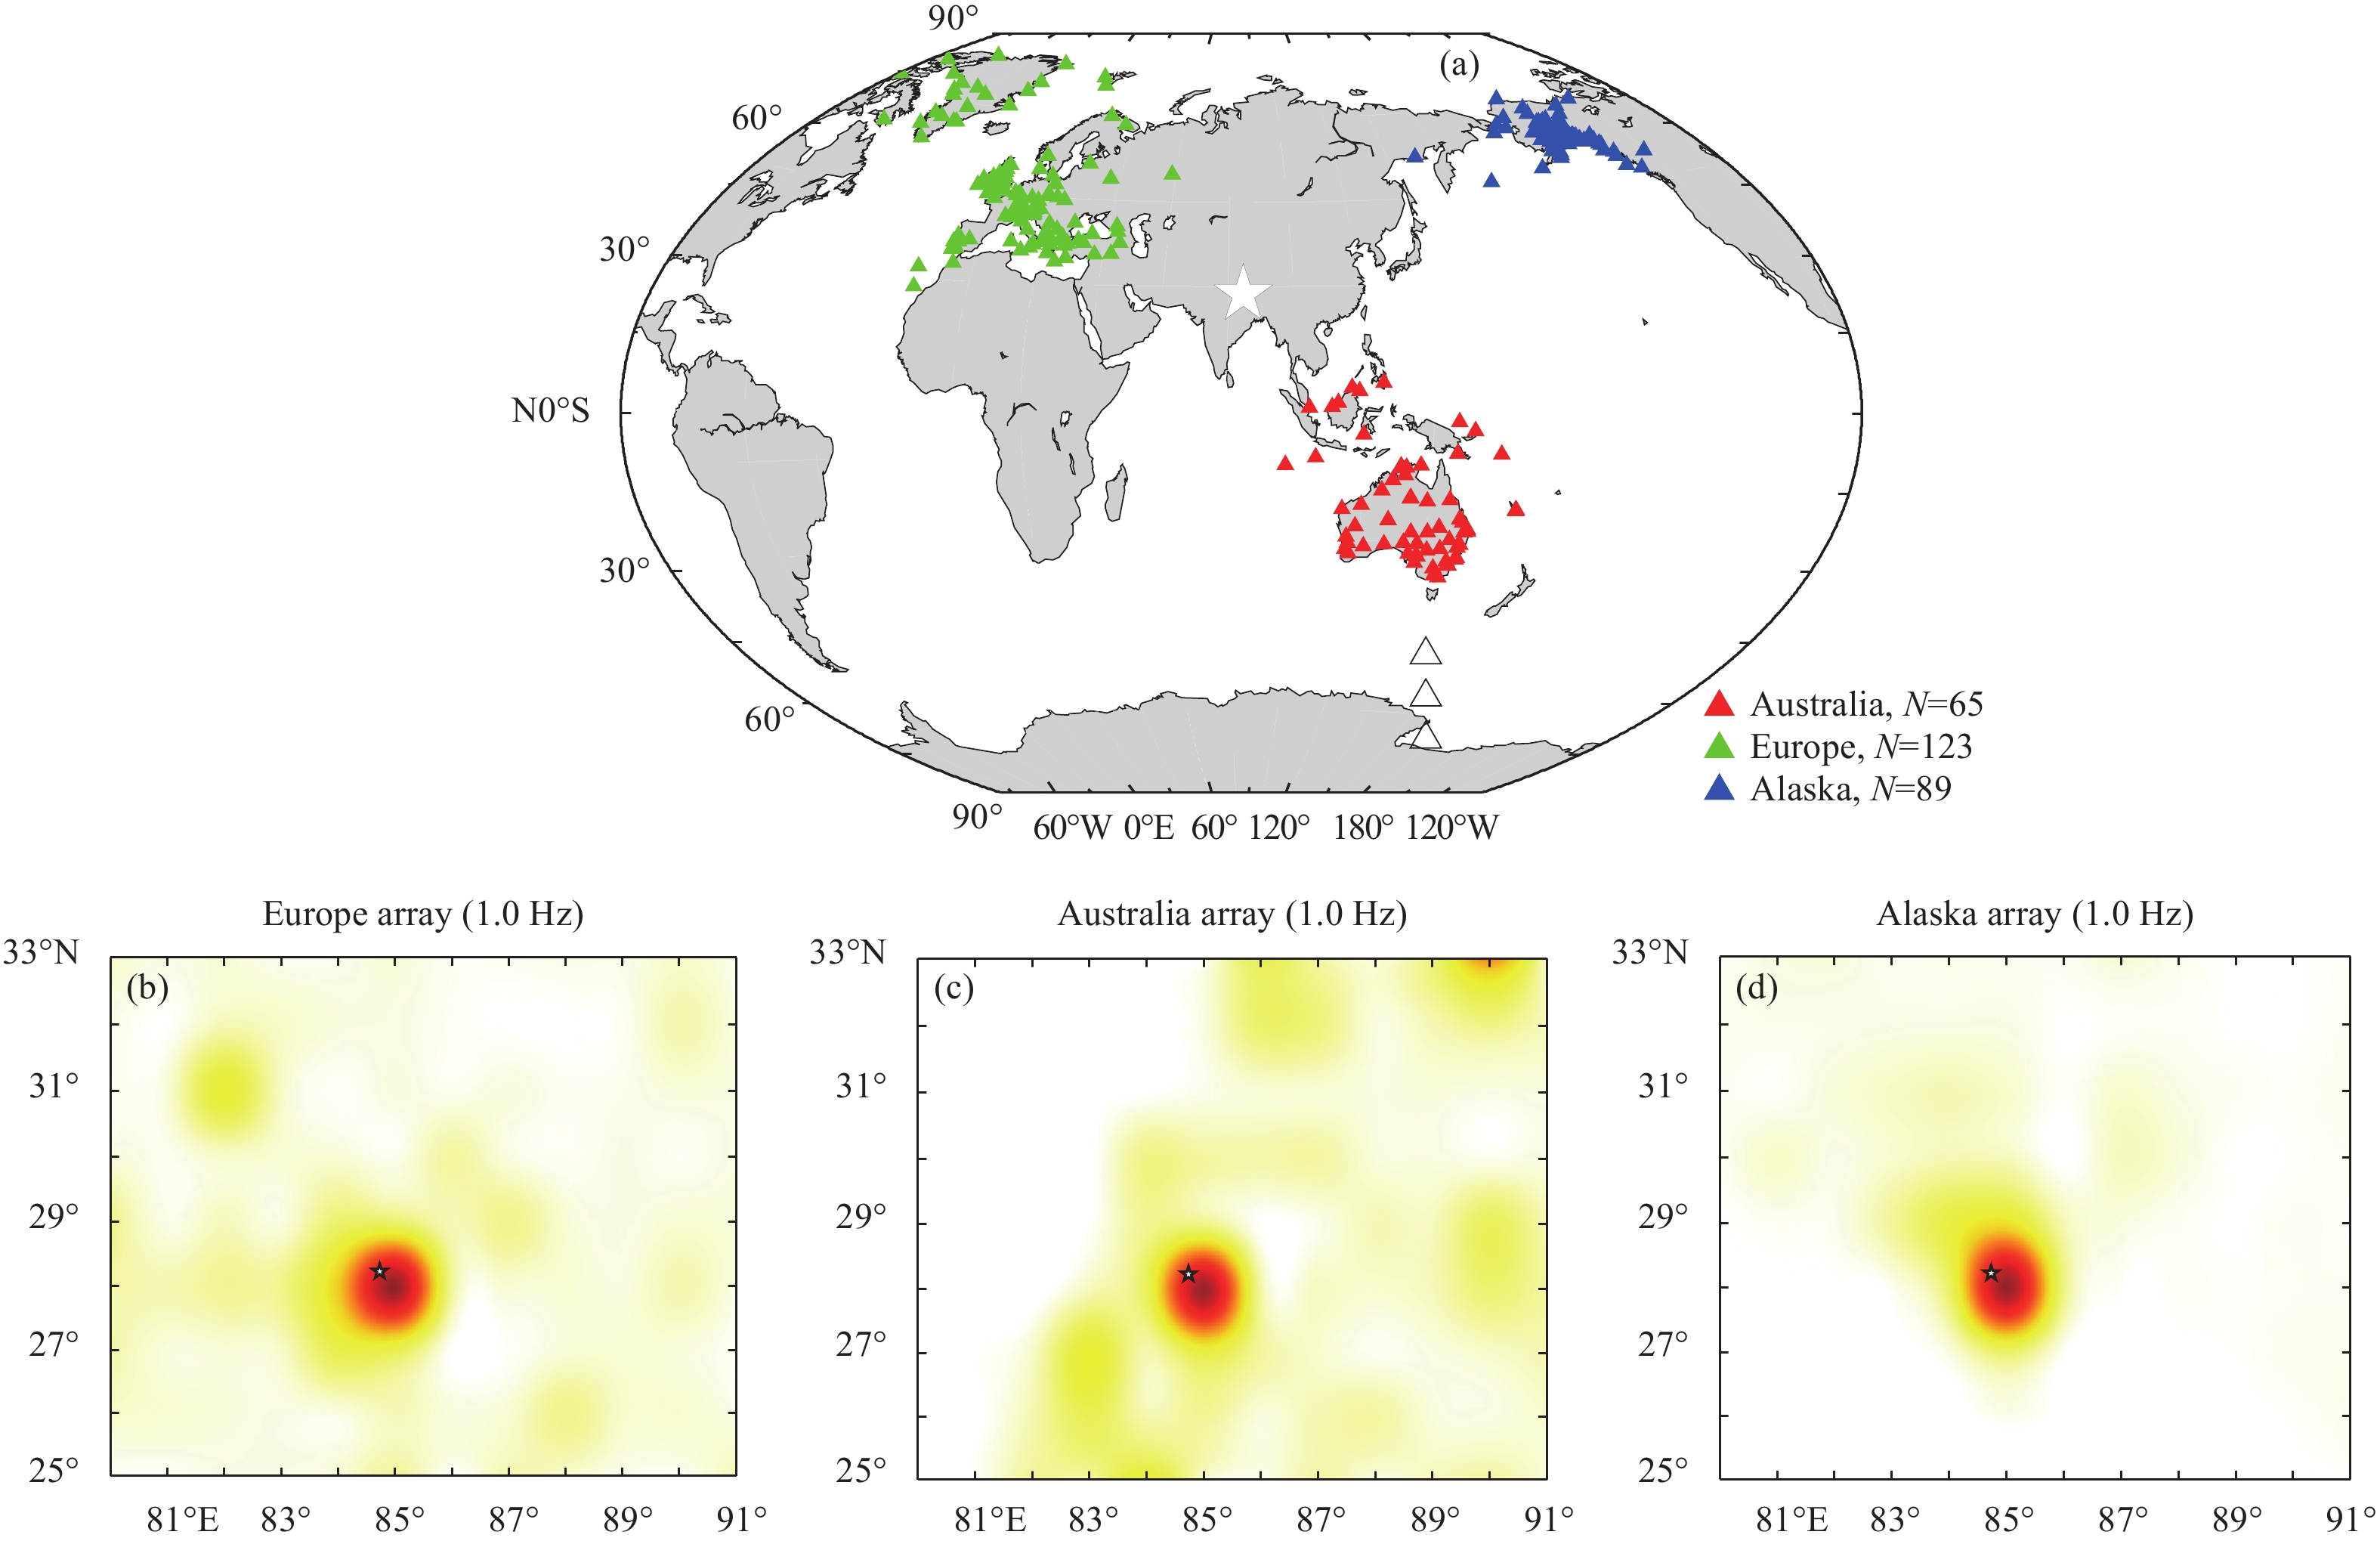
![]() Station distribution (a) and ARF for three regional subarrays (b-d) at 1Hz. The responses are shown in map view at a depth of 12 km. The star indicates the epicenter of the Nepal earthquake
Station distribution (a) and ARF for three regional subarrays (b-d) at 1Hz. The responses are shown in map view at a depth of 12 km. The star indicates the epicenter of the Nepal earthquake
-
![]() Coherence of P waves and average correlation coefficients of the subarrays in Alaska, Australia and Europe The top panels are alignment of initial P waves for each of the three arrays,the traces are unfiltered seismograms of ground velocity. The middle panels are seismic stations with MCCC (multichannel cross correlation ) for the three arrays. The bottom panels are MCCC values
Coherence of P waves and average correlation coefficients of the subarrays in Alaska, Australia and Europe The top panels are alignment of initial P waves for each of the three arrays,the traces are unfiltered seismograms of ground velocity. The middle panels are seismic stations with MCCC (multichannel cross correlation ) for the three arrays. The bottom panels are MCCC values
-
![]() Rupture propagation images for back-projection of teleseismic short-period P waves for the three subarrays (Figure 2a). The top (a-c), middle (d-f) and bottom (g-i) panels, respectively, show the time evolution of maximum beam power, the time-integrated beam power and the space-time sequences coherent energy for networks in Alaska, Australia and Europe. The circles are color-coded for elapsed time and scaled relative to peak beam power. The white stars indicate the mainshock epicenter and the black circles in subplots d—f represent early aftershocks
Rupture propagation images for back-projection of teleseismic short-period P waves for the three subarrays (Figure 2a). The top (a-c), middle (d-f) and bottom (g-i) panels, respectively, show the time evolution of maximum beam power, the time-integrated beam power and the space-time sequences coherent energy for networks in Alaska, Australia and Europe. The circles are color-coded for elapsed time and scaled relative to peak beam power. The white stars indicate the mainshock epicenter and the black circles in subplots d—f represent early aftershocks
-
![]() Snapshots of the rupture process for the Alaska subarray (top panels), the Australia subarray (middle panels) and the Europe subarray (lower panels). The bandpass for the respective seismograms was from 1.0 to 3.0 Hz (Alaska) and from 0.5 to 2.0 Hz (Australia and Europe)
Snapshots of the rupture process for the Alaska subarray (top panels), the Australia subarray (middle panels) and the Europe subarray (lower panels). The bandpass for the respective seismograms was from 1.0 to 3.0 Hz (Alaska) and from 0.5 to 2.0 Hz (Australia and Europe)
-
![]() Beam power as functions of time using the combined subarrays, Europe, Alaska and Australia (a); Time-integrated beam power using the combined three subarrays (b)
Beam power as functions of time using the combined subarrays, Europe, Alaska and Australia (a); Time-integrated beam power using the combined three subarrays (b)
-
![]() (a) Linear 1D back-projection of 1.0–3.0 Hz P wave recordings of Alaska subarray with equally spaced points oriented in the strike direction (292°N) for the mainshock. (b) Similar to (a) for a MW 5.7 aftershock that occurred near the southeastern edge of the rupture area which is used as an empirical array response function. (c) Subevent locations for Alaska network along the back-projection line. Color indicates time and circle size in proportional to the relative beam power and only subevents at least 20% as large as the maximum power are retained. (d) Subevents locations in space and time determined by deconvolution of the aftershock image from the mainshock image. The dashed line shows a simple unweighted least-squares fit to the subevent locations, giving the indicated rupture velocity. Similar to (a–d), (e–h) and (i–l) are for the Australia and Europe networks, respectively
(a) Linear 1D back-projection of 1.0–3.0 Hz P wave recordings of Alaska subarray with equally spaced points oriented in the strike direction (292°N) for the mainshock. (b) Similar to (a) for a MW 5.7 aftershock that occurred near the southeastern edge of the rupture area which is used as an empirical array response function. (c) Subevent locations for Alaska network along the back-projection line. Color indicates time and circle size in proportional to the relative beam power and only subevents at least 20% as large as the maximum power are retained. (d) Subevents locations in space and time determined by deconvolution of the aftershock image from the mainshock image. The dashed line shows a simple unweighted least-squares fit to the subevent locations, giving the indicated rupture velocity. Similar to (a–d), (e–h) and (i–l) are for the Australia and Europe networks, respectively
-
![]() Rupture velocity estimated from linear back-projection and deconvolution of empirical array response functions. The gray dashed line is fit by least-squares regression of unweighted subevent locations
Rupture velocity estimated from linear back-projection and deconvolution of empirical array response functions. The gray dashed line is fit by least-squares regression of unweighted subevent locations