 Download:
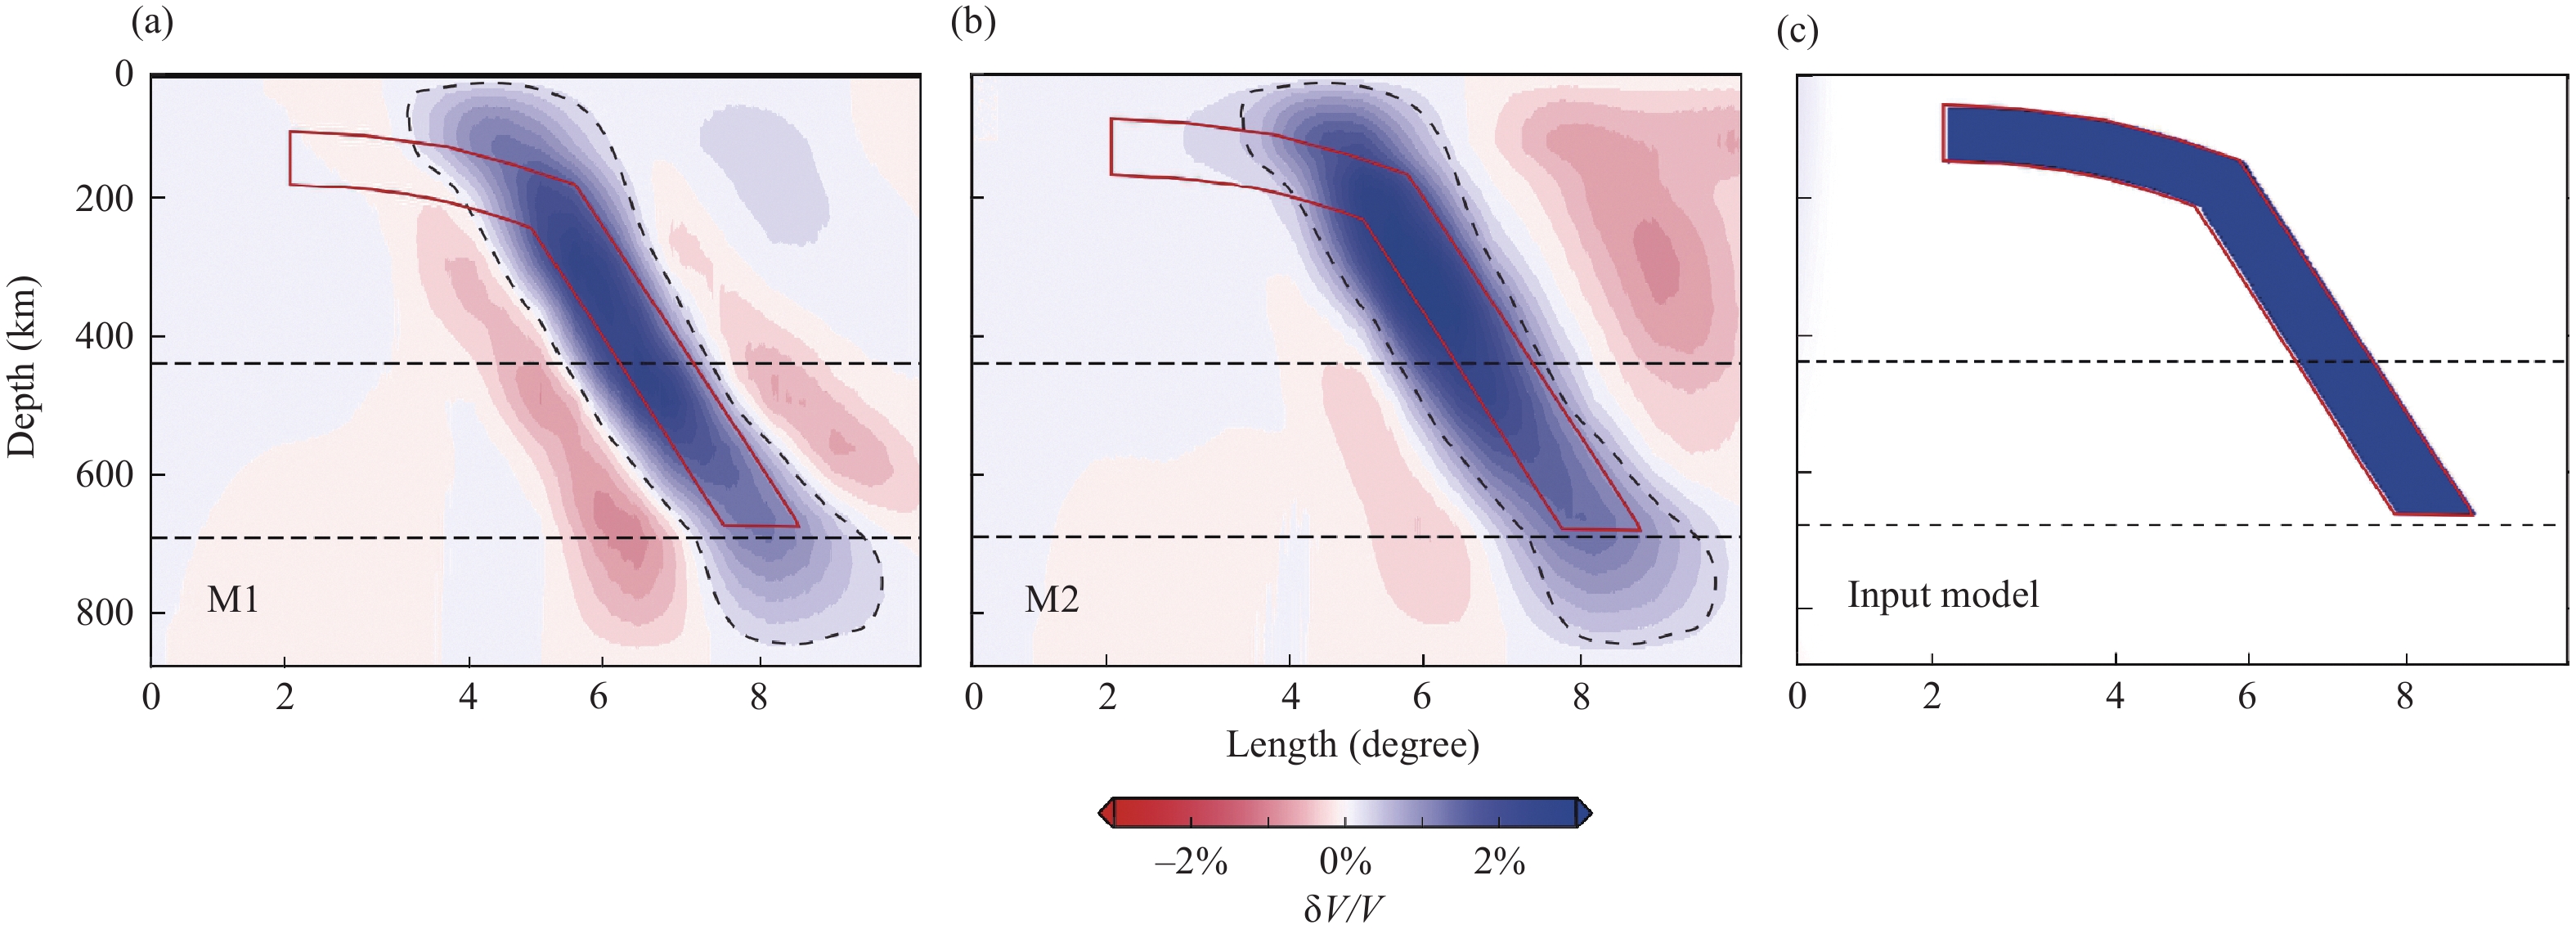
Results of a synthetic tomography test. (a) Result from M1. (b) Result of M2. (c) Synthetic slab model. The dashed line in (a) depicts the contour of the slab from M1. The dashed line from (a) is also added in (b) for comparison purposes. The red lines in plots (a)–(c) depict the contour of the input slab model.
Figures of the Article
-
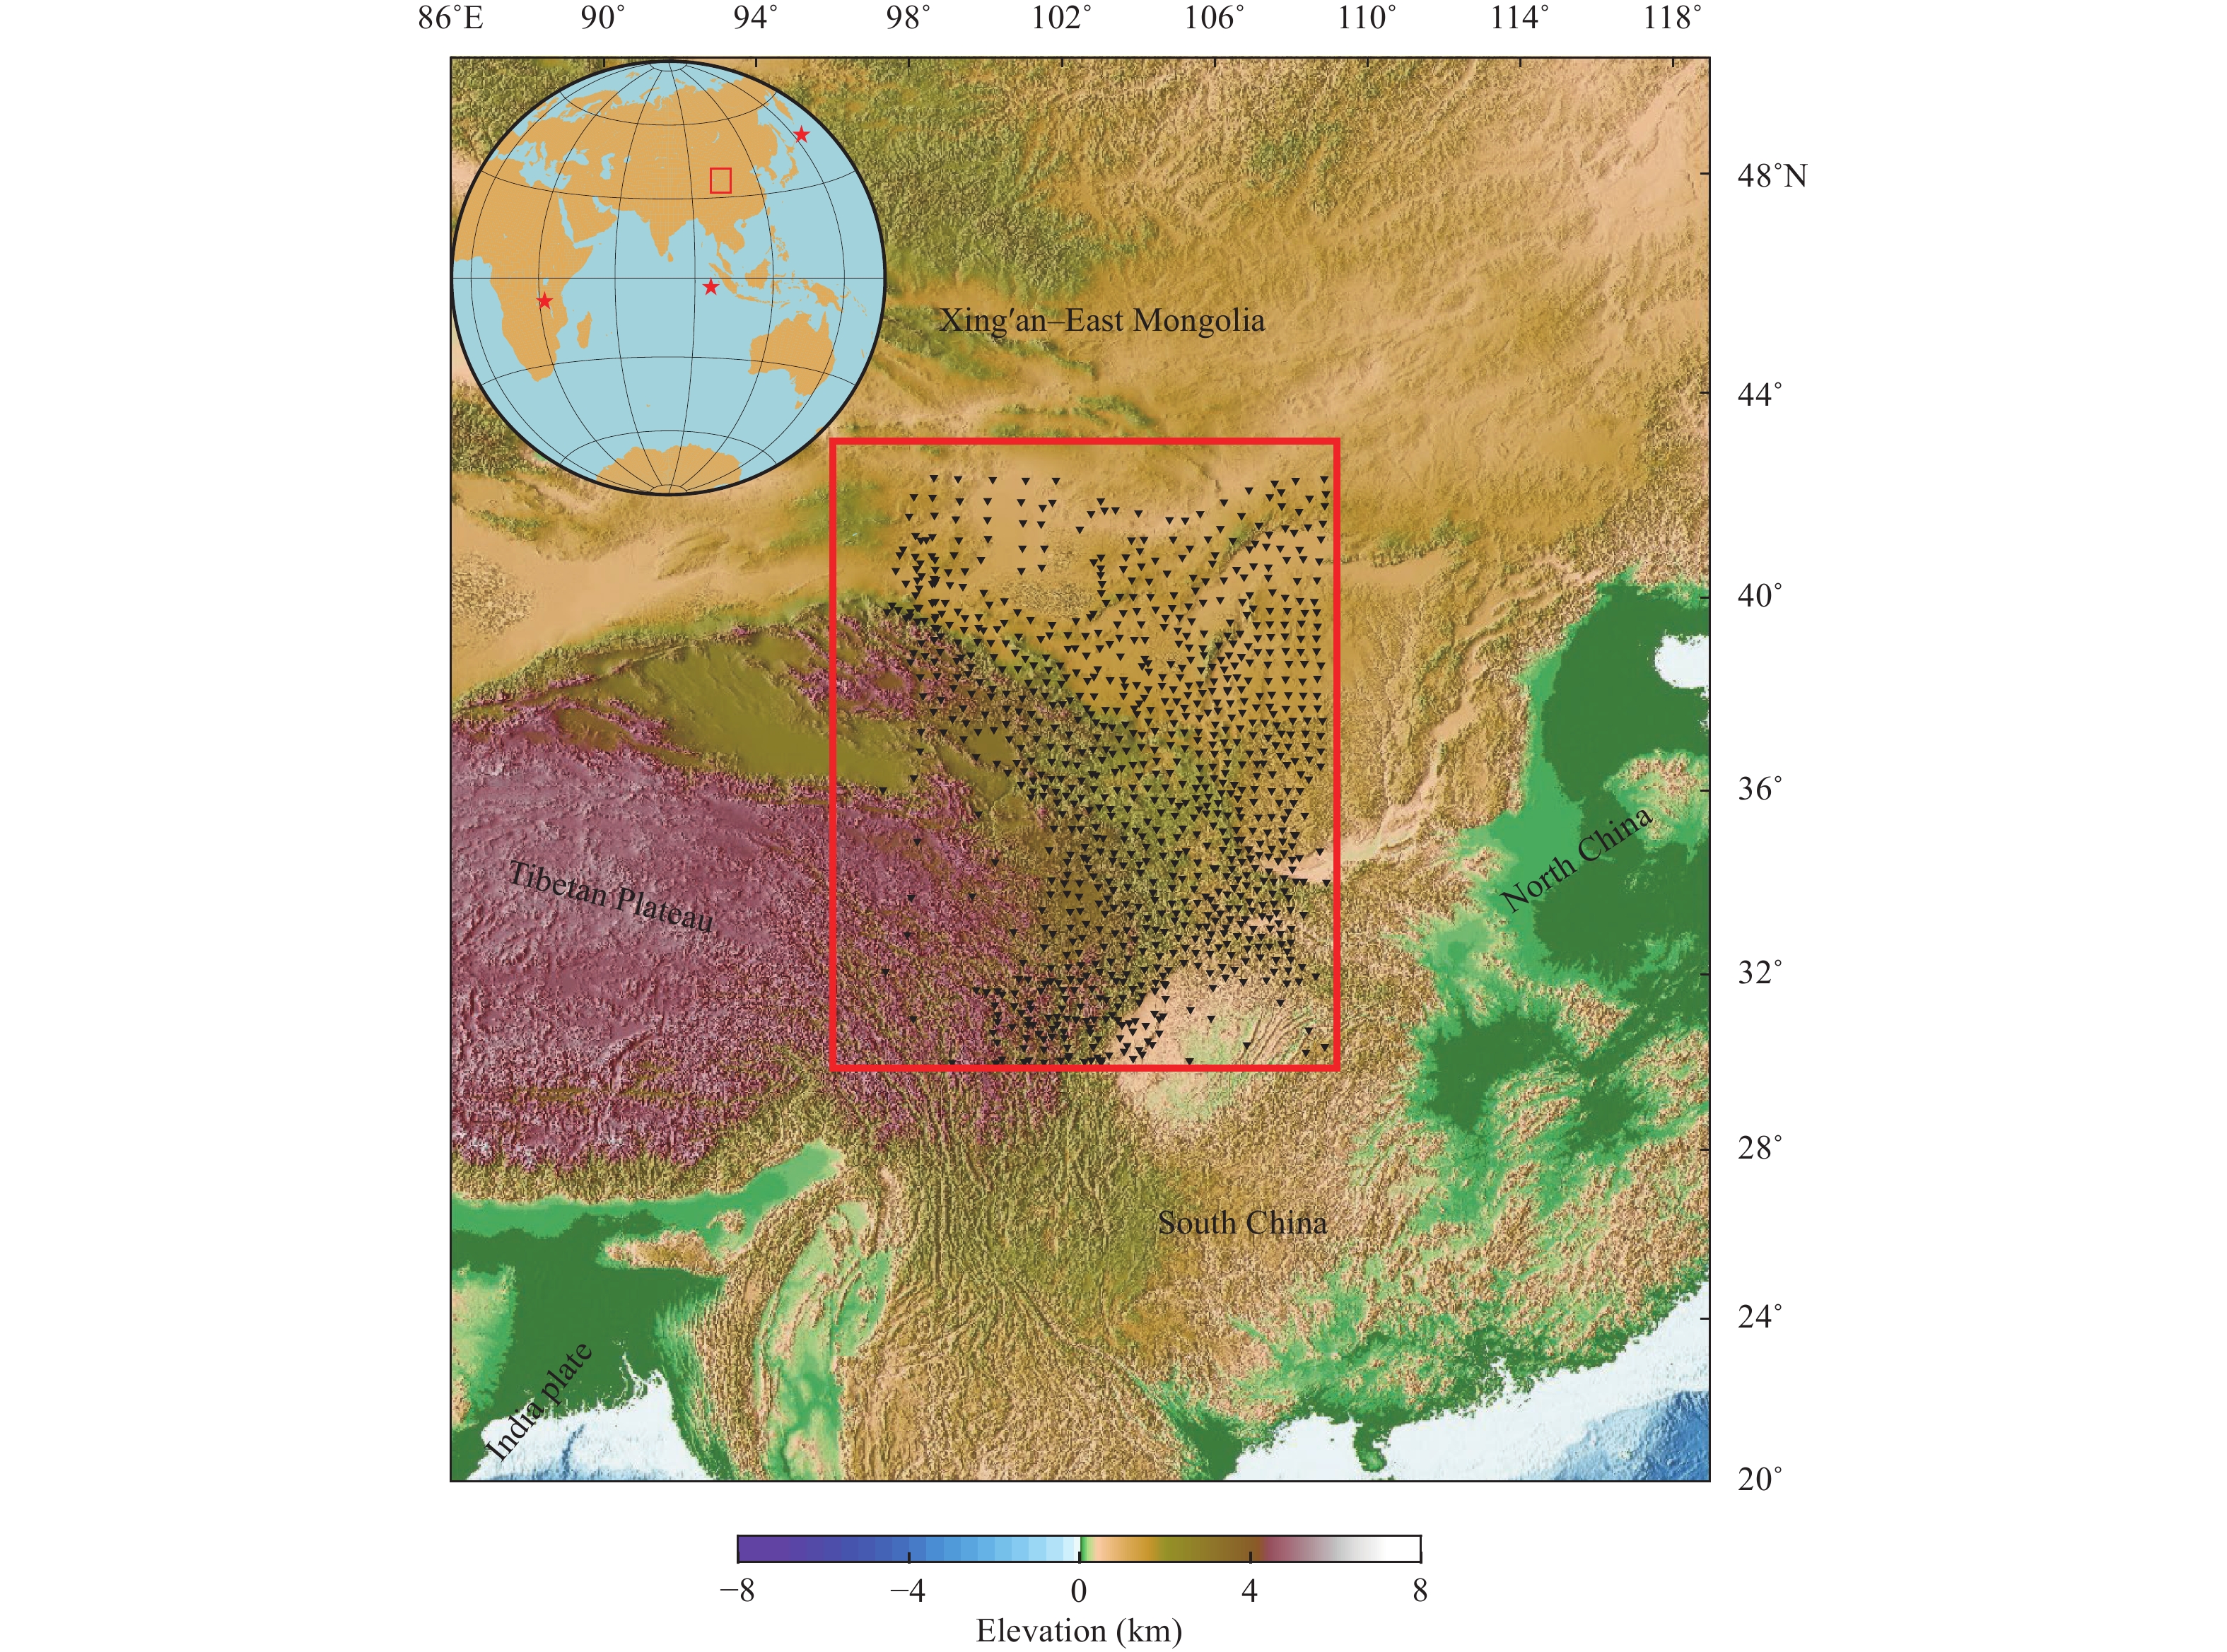
![]() Stations (black inverted triangles) in the northeastern Tibetan Plateau. The inset map shows the study area on the globe. Three teleseismic events (red stars) are selected for subsequent analyses. The red rectangles in the plots indicate the range of the study area.
Stations (black inverted triangles) in the northeastern Tibetan Plateau. The inset map shows the study area on the globe. Three teleseismic events (red stars) are selected for subsequent analyses. The red rectangles in the plots indicate the range of the study area.
-
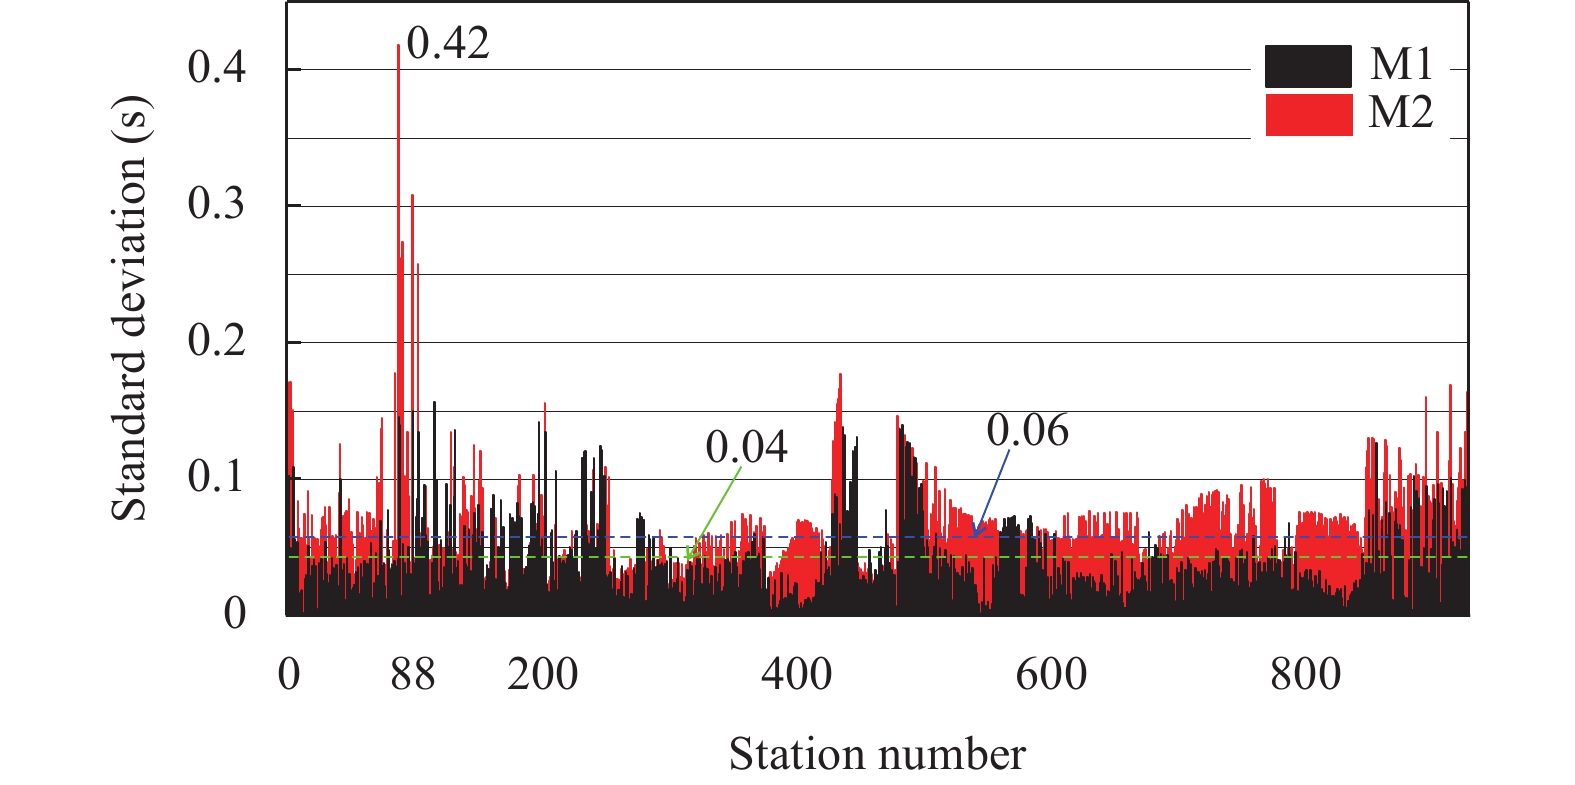
![]() Standard deviations of the residuals calculated in four heterogeneous global models. The black and red lines are from M1 and M2, respectively. The green and blue dashed lines represent the average values of M1 and M2, respectively.
Standard deviations of the residuals calculated in four heterogeneous global models. The black and red lines are from M1 and M2, respectively. The green and blue dashed lines represent the average values of M1 and M2, respectively.
-
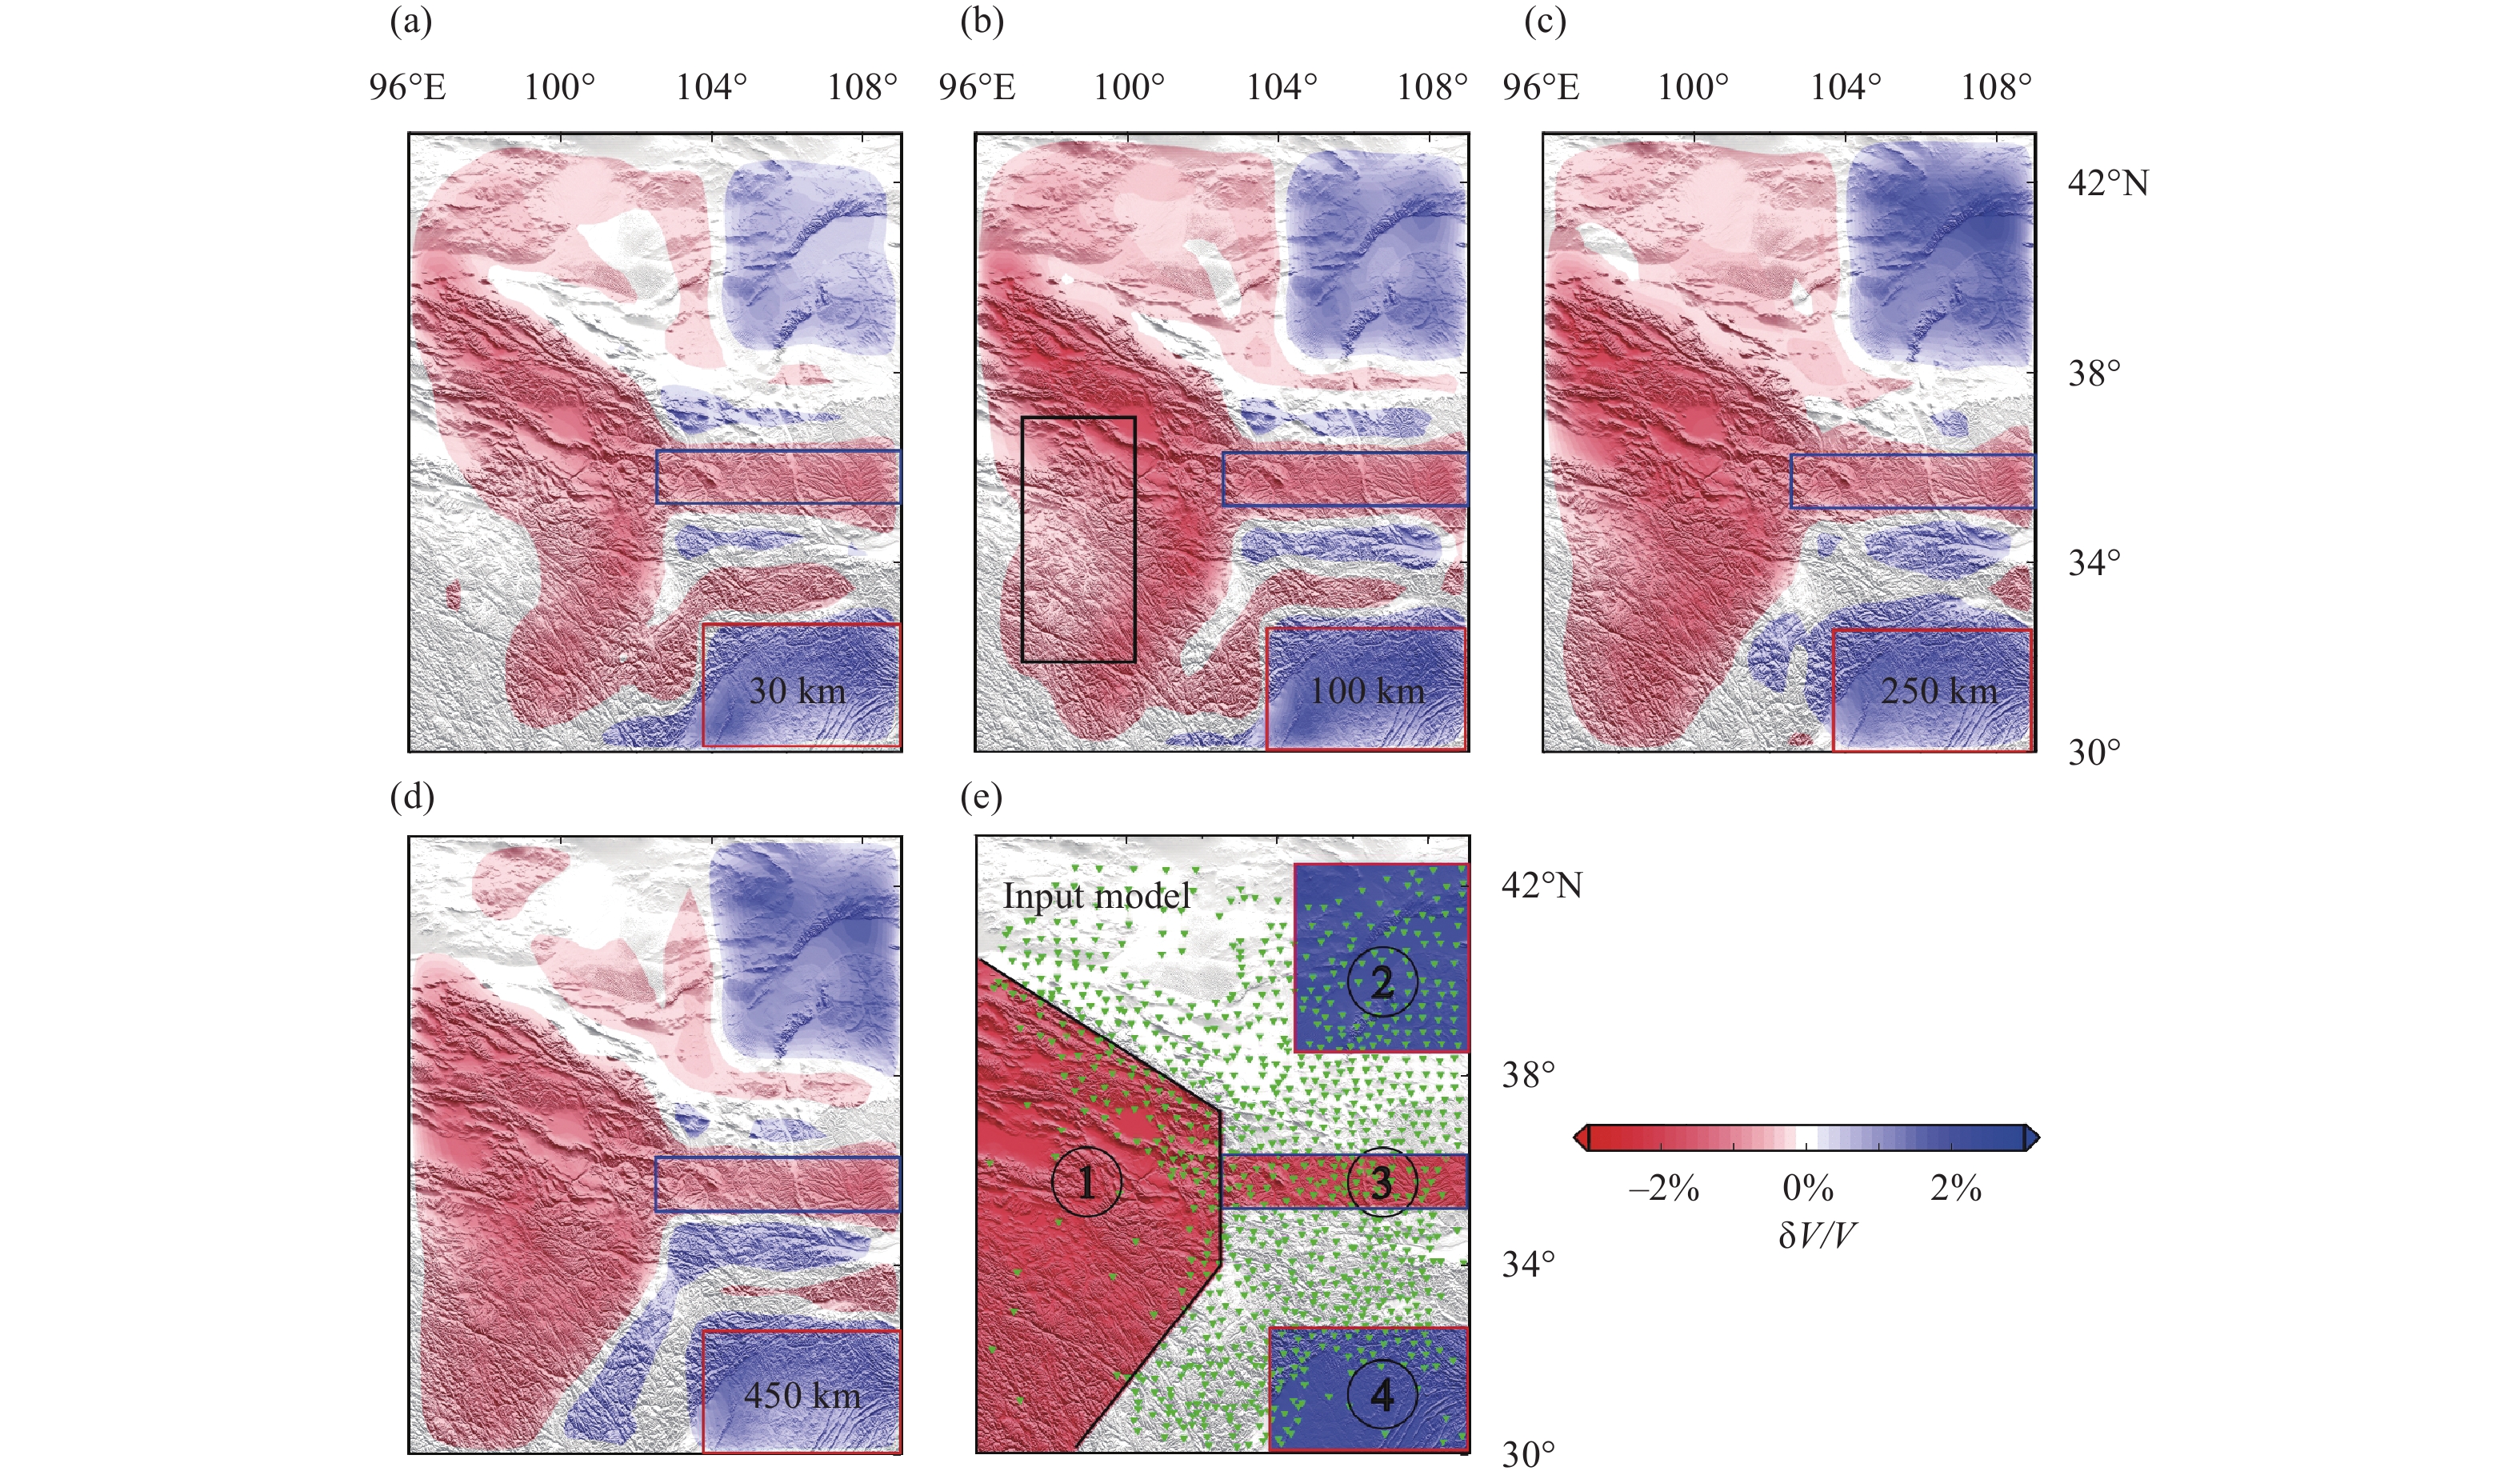
![]() Results of a synthetic tomography test from M1. The tomographic results were obtained by incorporating the influence of mantle heterogeneities outside the imaging domain. (a)–(d) are the horizontal slices of the inversion results at different depths. Depth is shown at the right-lower corner of each plot. (e) The synthetic input model. (f) Teleseismic events selected for the synthetic test. The numbers with circles represent the blocks of the input model. The green lines in (a)–(c) depict the contours of the imaged block 4; the green line in (d) delineates the contour of imaged block 3. The black and red lines in each plot mark the contours of blocks 1 and 4 of the input model, respectively. The green inverted triangles in plot (e) denote the seismic stations.
Results of a synthetic tomography test from M1. The tomographic results were obtained by incorporating the influence of mantle heterogeneities outside the imaging domain. (a)–(d) are the horizontal slices of the inversion results at different depths. Depth is shown at the right-lower corner of each plot. (e) The synthetic input model. (f) Teleseismic events selected for the synthetic test. The numbers with circles represent the blocks of the input model. The green lines in (a)–(c) depict the contours of the imaged block 4; the green line in (d) delineates the contour of imaged block 3. The black and red lines in each plot mark the contours of blocks 1 and 4 of the input model, respectively. The green inverted triangles in plot (e) denote the seismic stations.
-
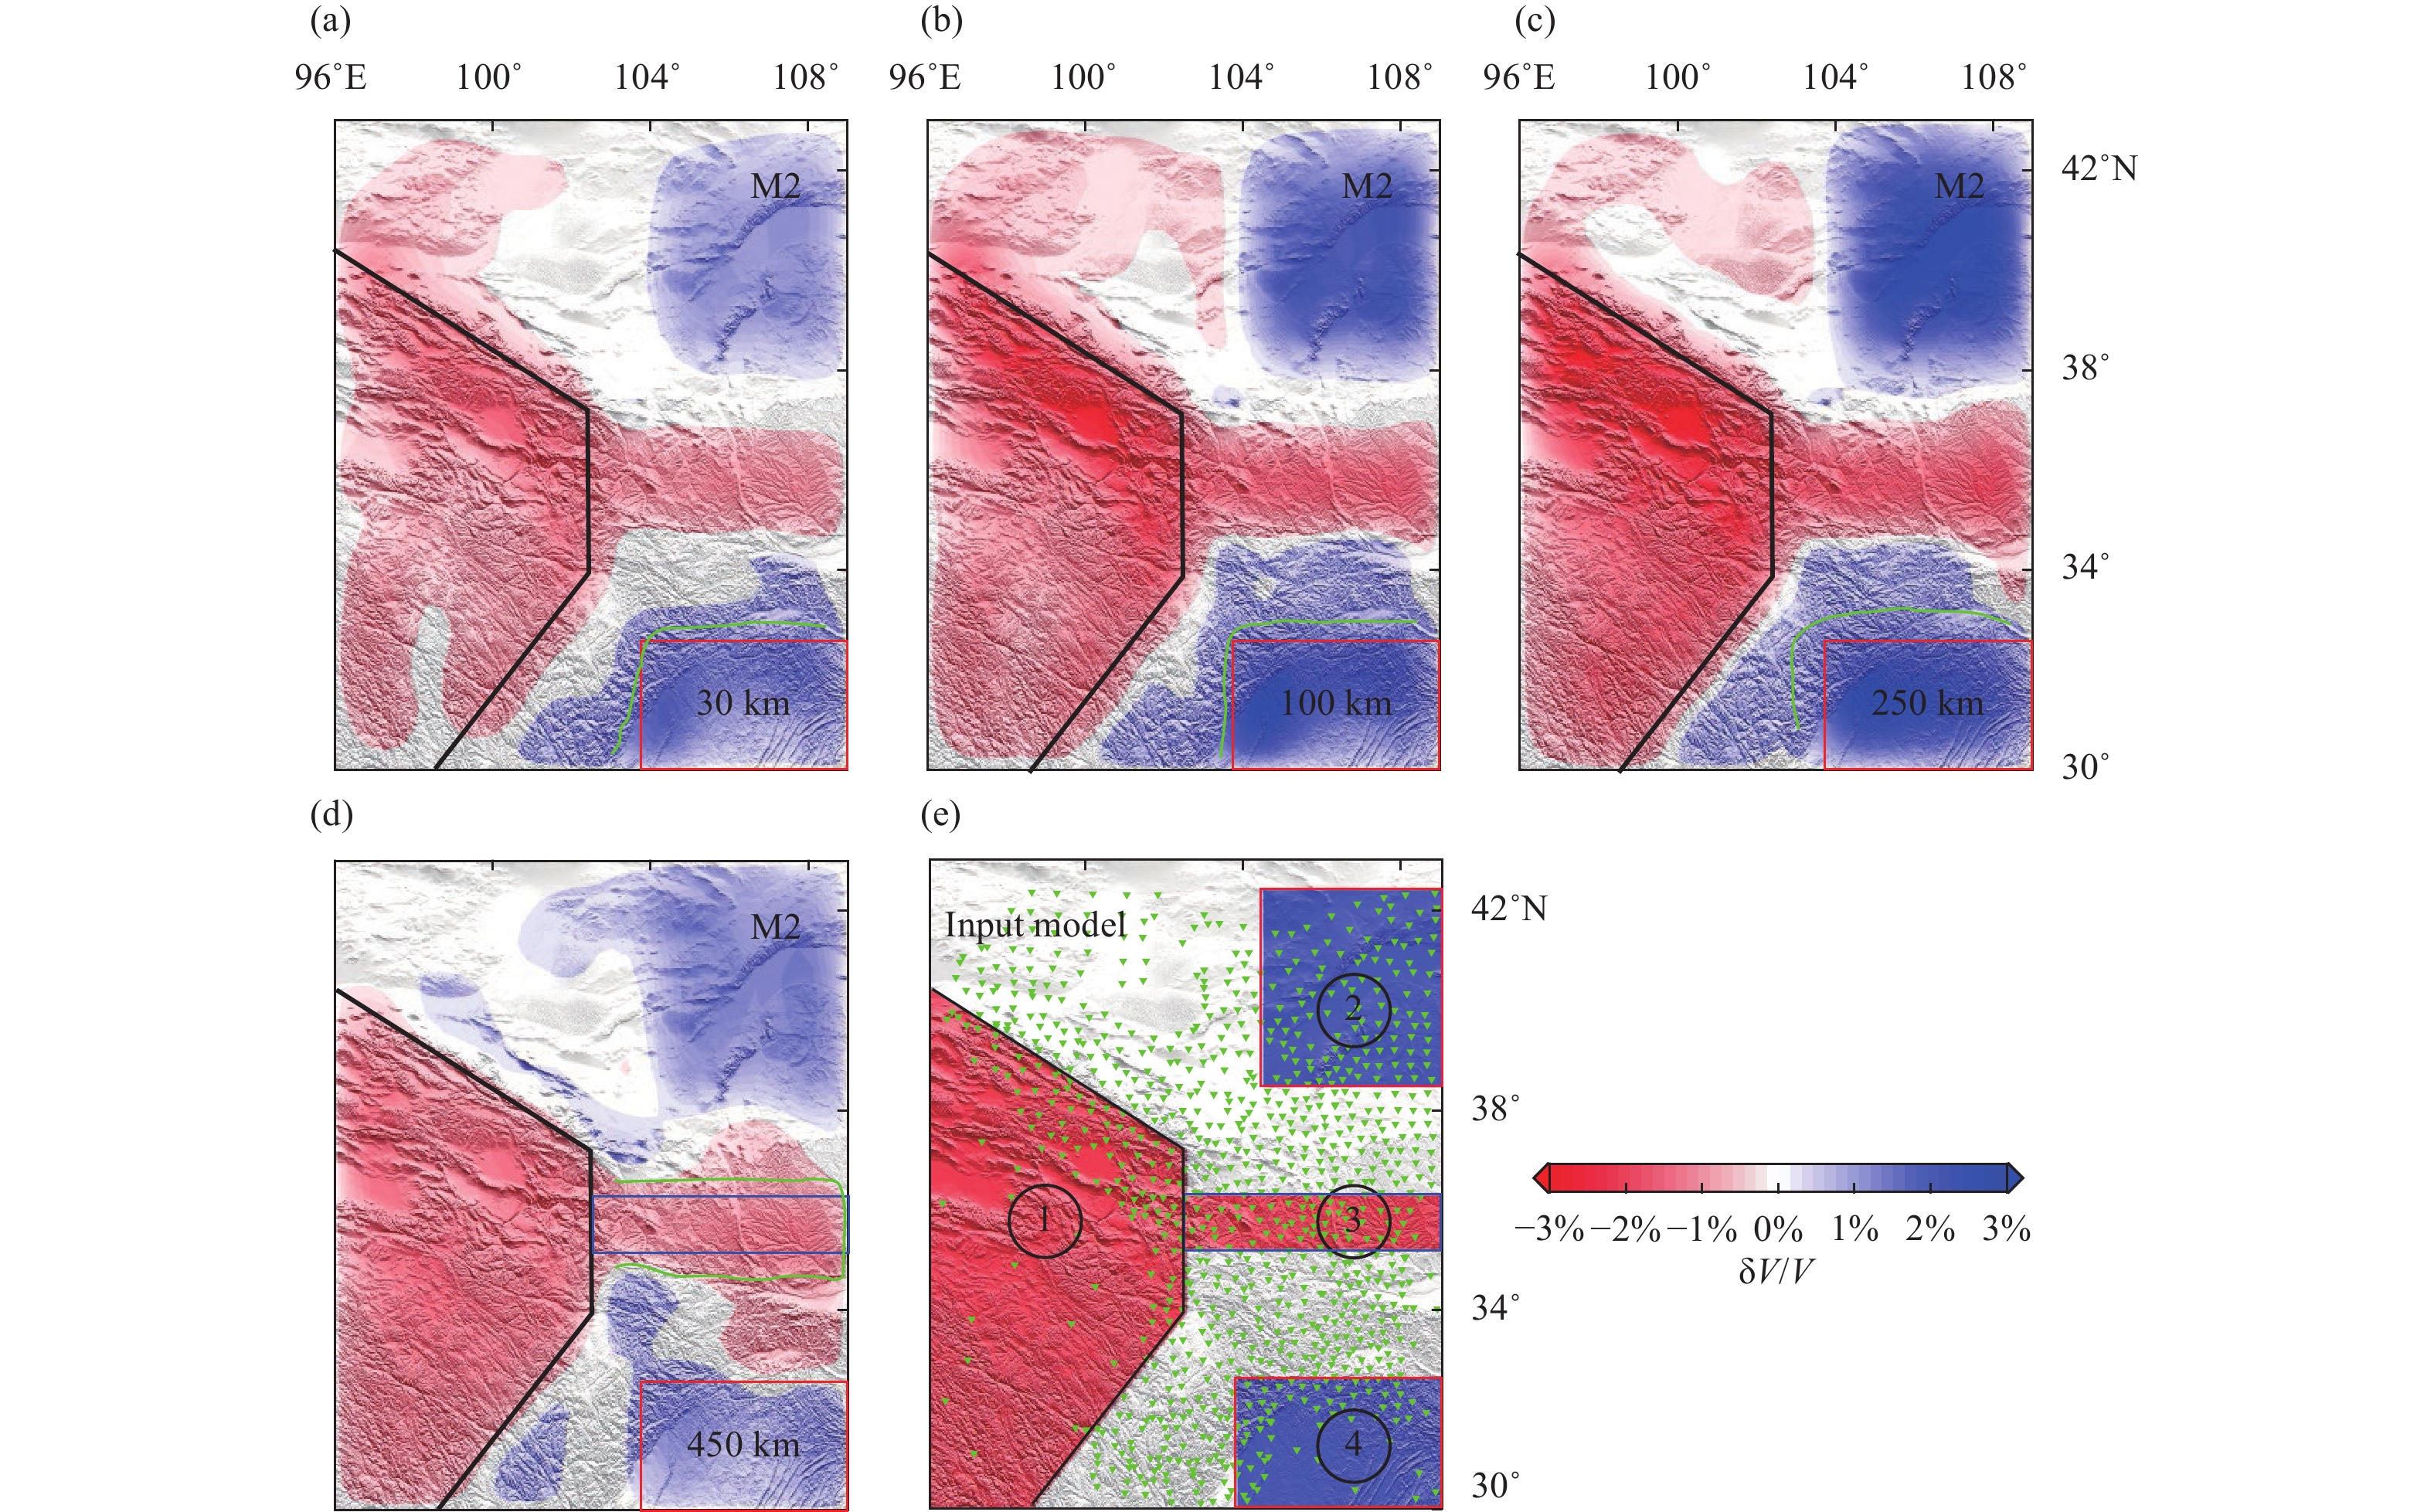
![]() Results of a synthetic tomography test from M2. The tomographic results were obtained by incorporating the influence of mantle heterogeneities outside the imaging domain. (a)–(d) are the horizontal slices of the inversion results at different depths. Depth is shown at the right-lower corner of each plot. (e) The synthetic input model. The lines (black, red and green lines) in Figure 3 are moved to this figure for comparison purposes. The numbers with circles represent the blocks of the input model. The green inverted triangles in plot (e) denote the seismic stations.
Results of a synthetic tomography test from M2. The tomographic results were obtained by incorporating the influence of mantle heterogeneities outside the imaging domain. (a)–(d) are the horizontal slices of the inversion results at different depths. Depth is shown at the right-lower corner of each plot. (e) The synthetic input model. The lines (black, red and green lines) in Figure 3 are moved to this figure for comparison purposes. The numbers with circles represent the blocks of the input model. The green inverted triangles in plot (e) denote the seismic stations.
-
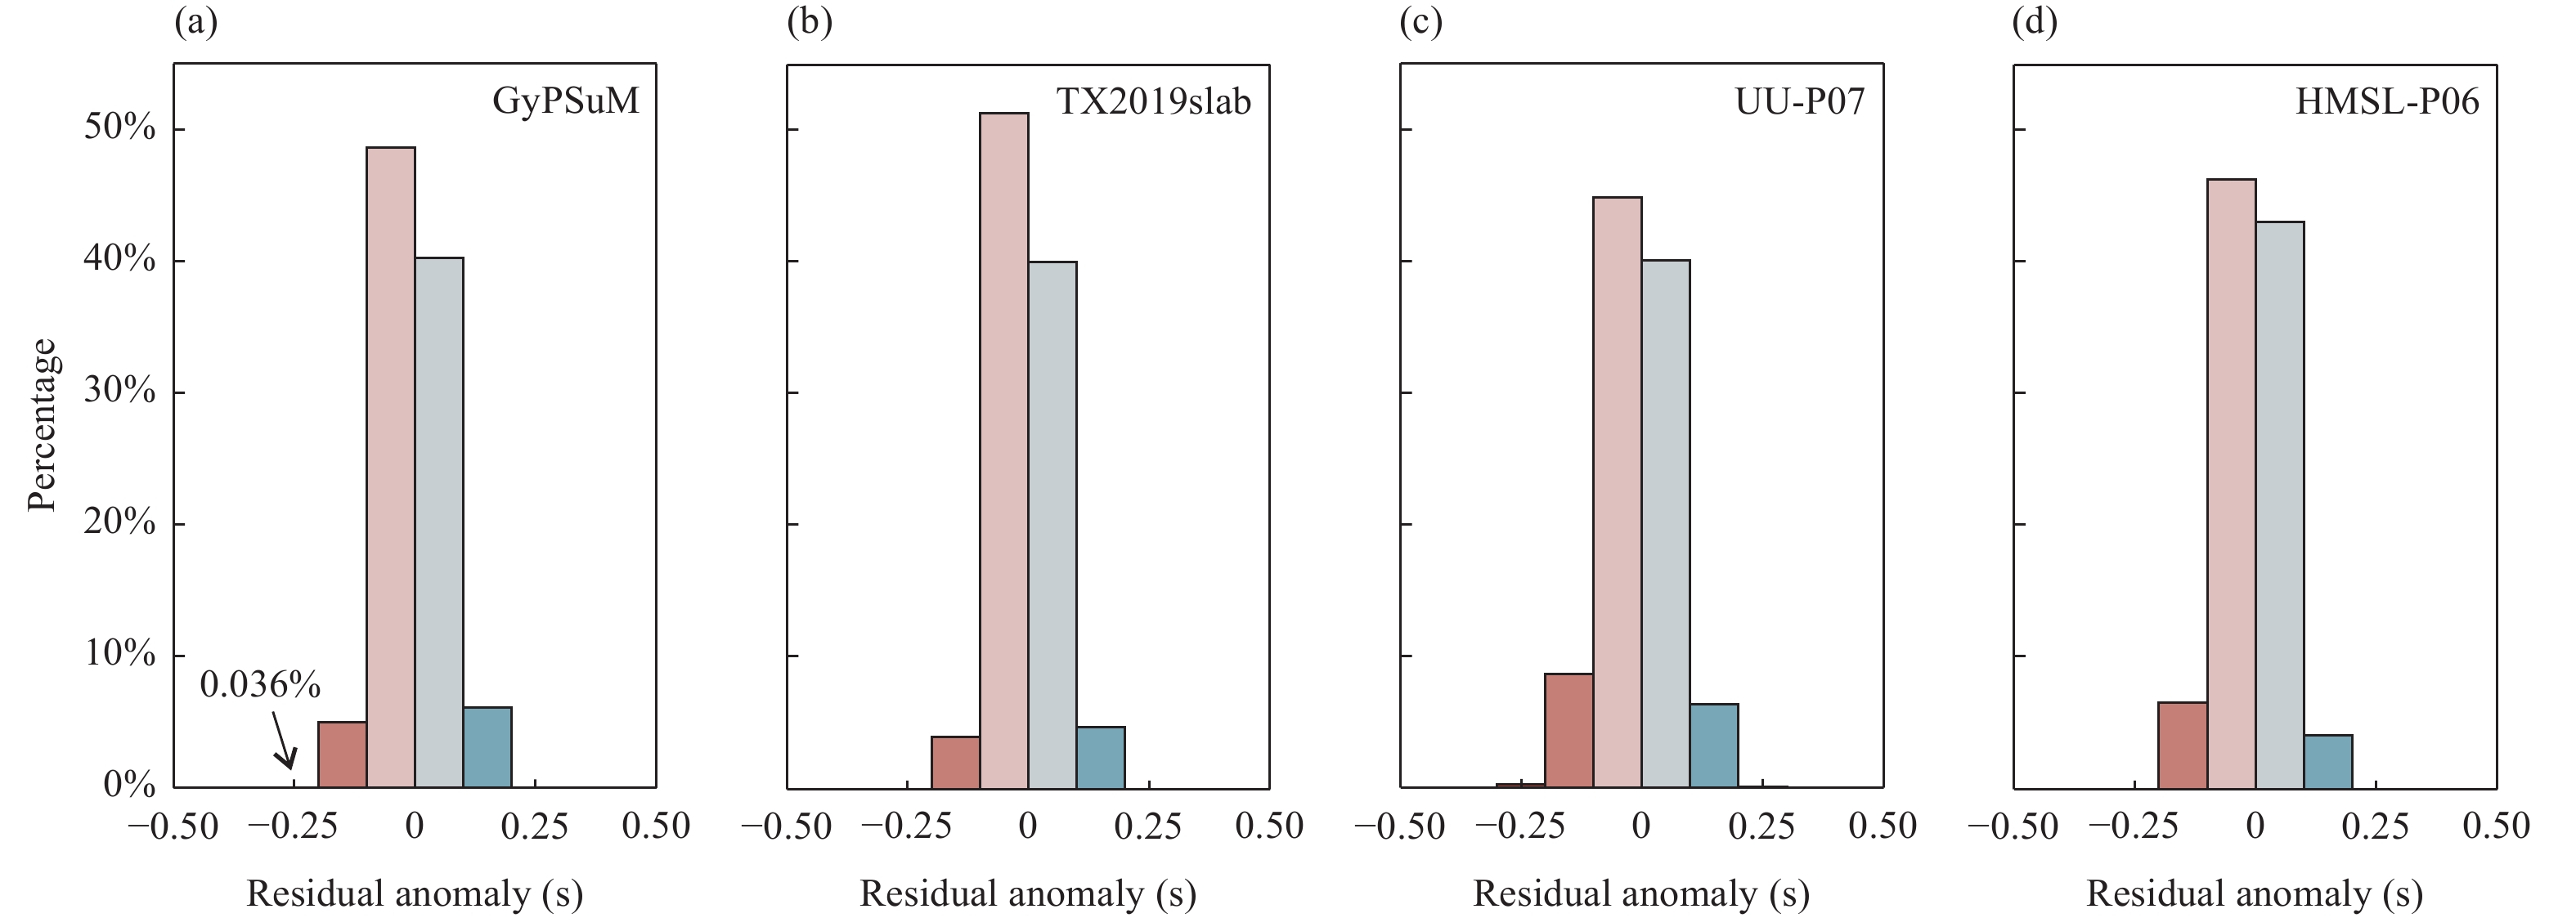
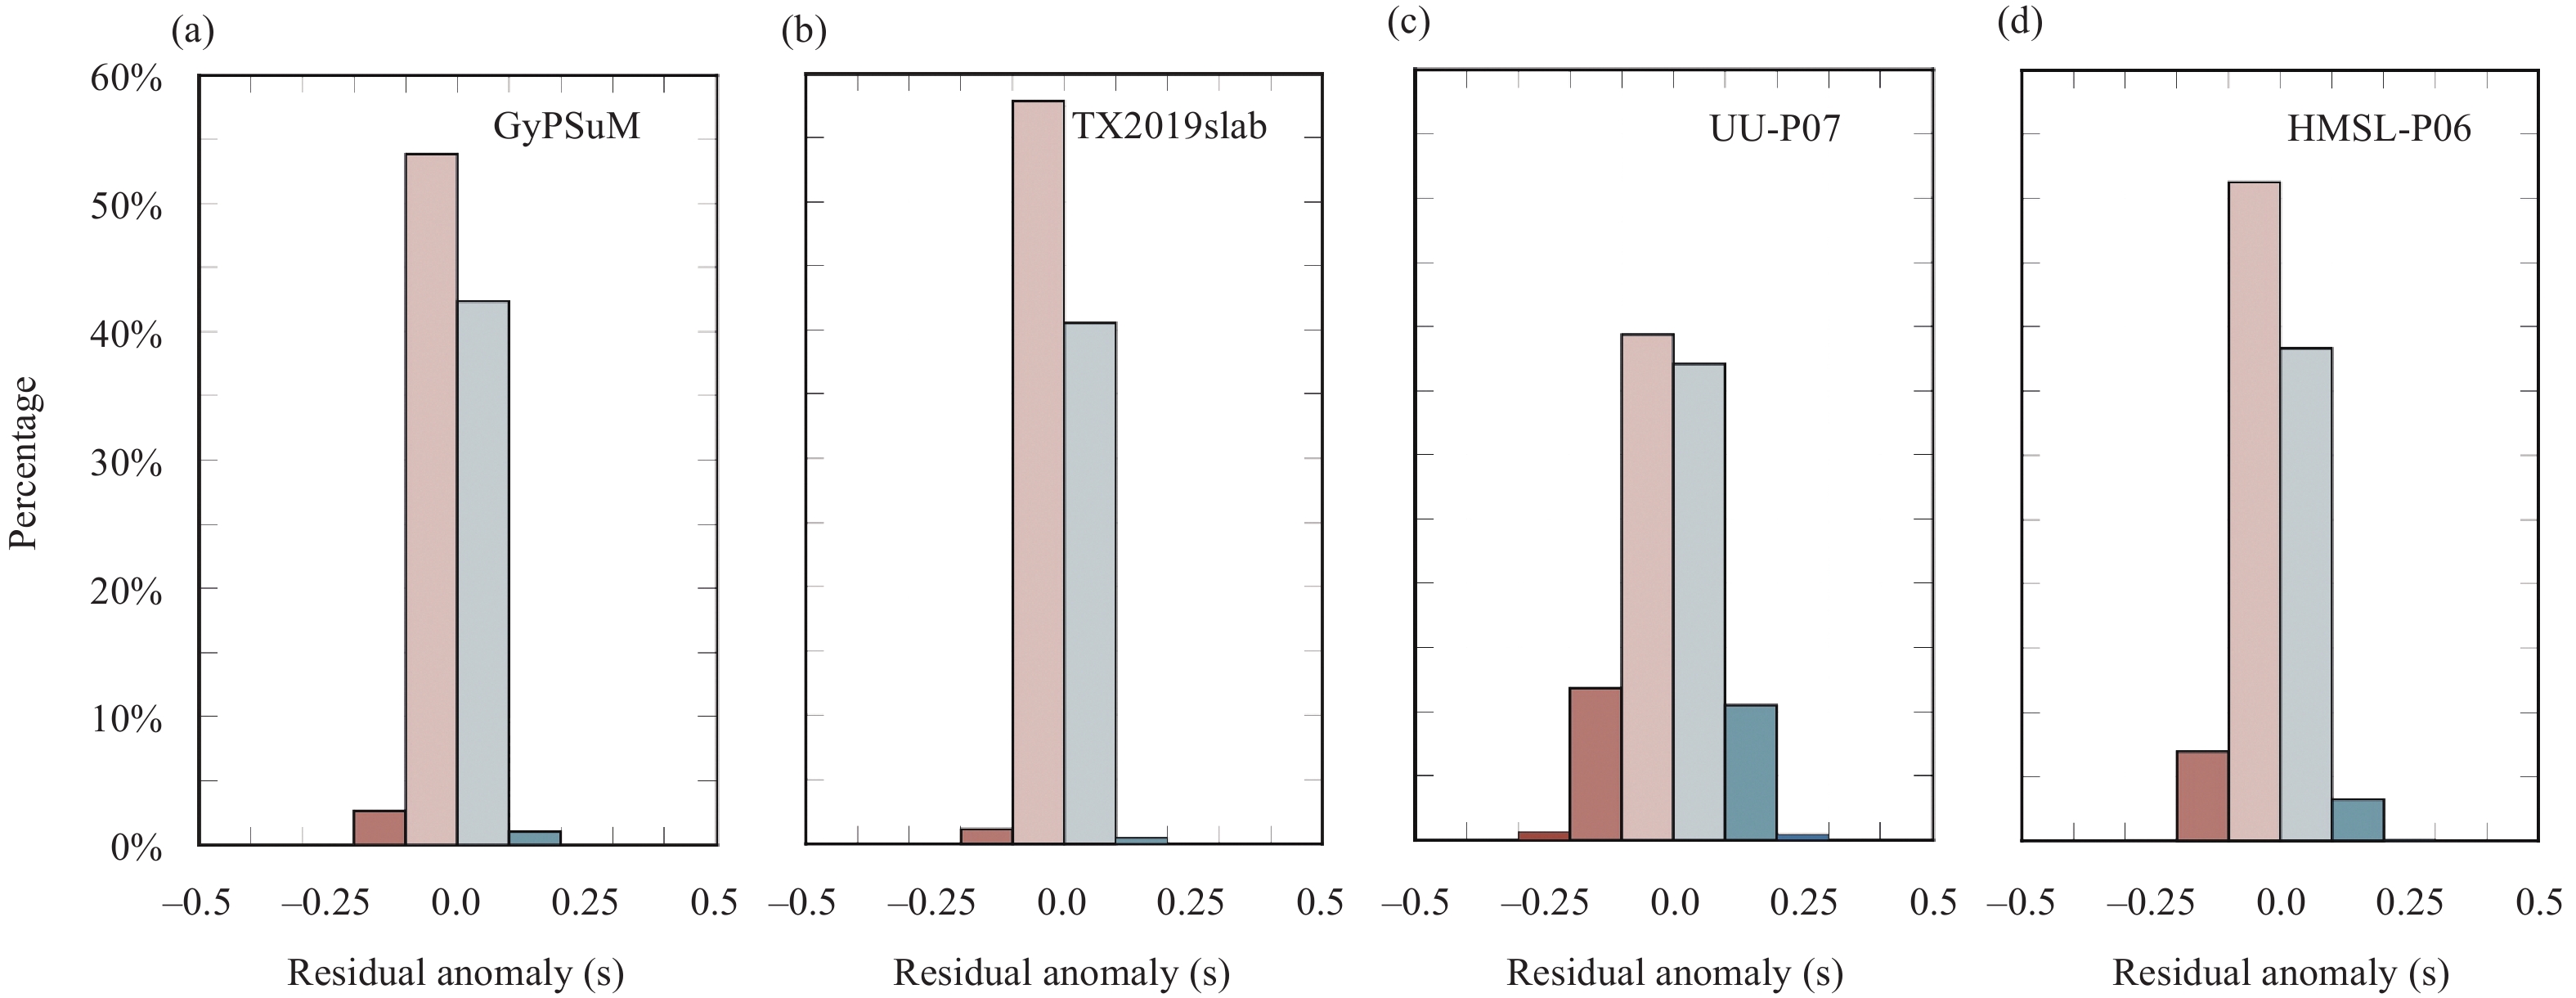
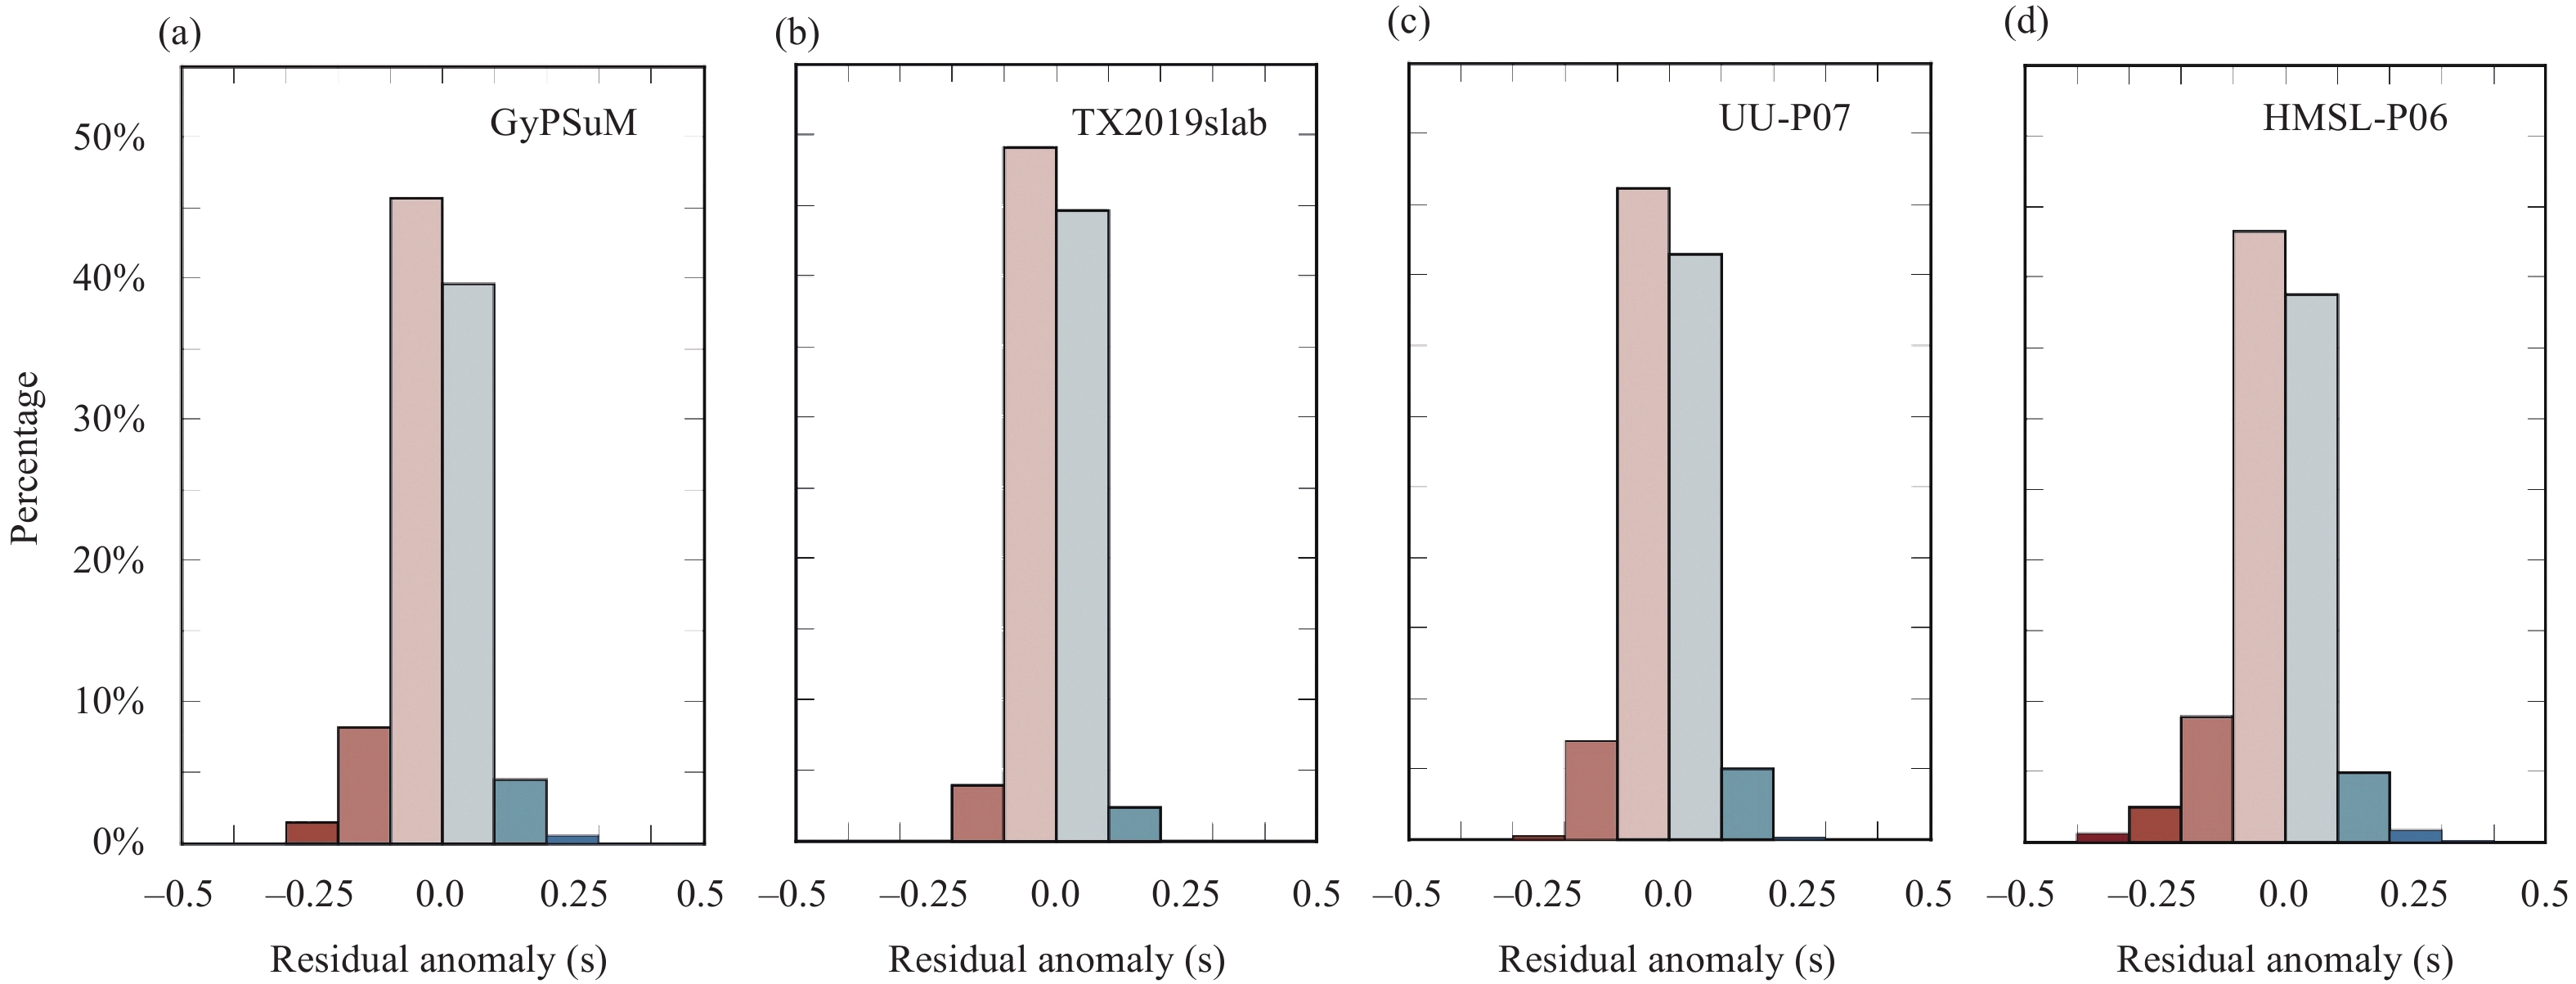
![]() Residual anomalies of M1 for the source in East Africa. Residual anomalies in (a)–(d) are calculated in the global models GyPSuM, TX2019slab, UU-P07, and HMSL-P06, respectively. The length of columns represents the percentage; the color of the columns denotes the residual anomaly.
Residual anomalies of M1 for the source in East Africa. Residual anomalies in (a)–(d) are calculated in the global models GyPSuM, TX2019slab, UU-P07, and HMSL-P06, respectively. The length of columns represents the percentage; the color of the columns denotes the residual anomaly.
-
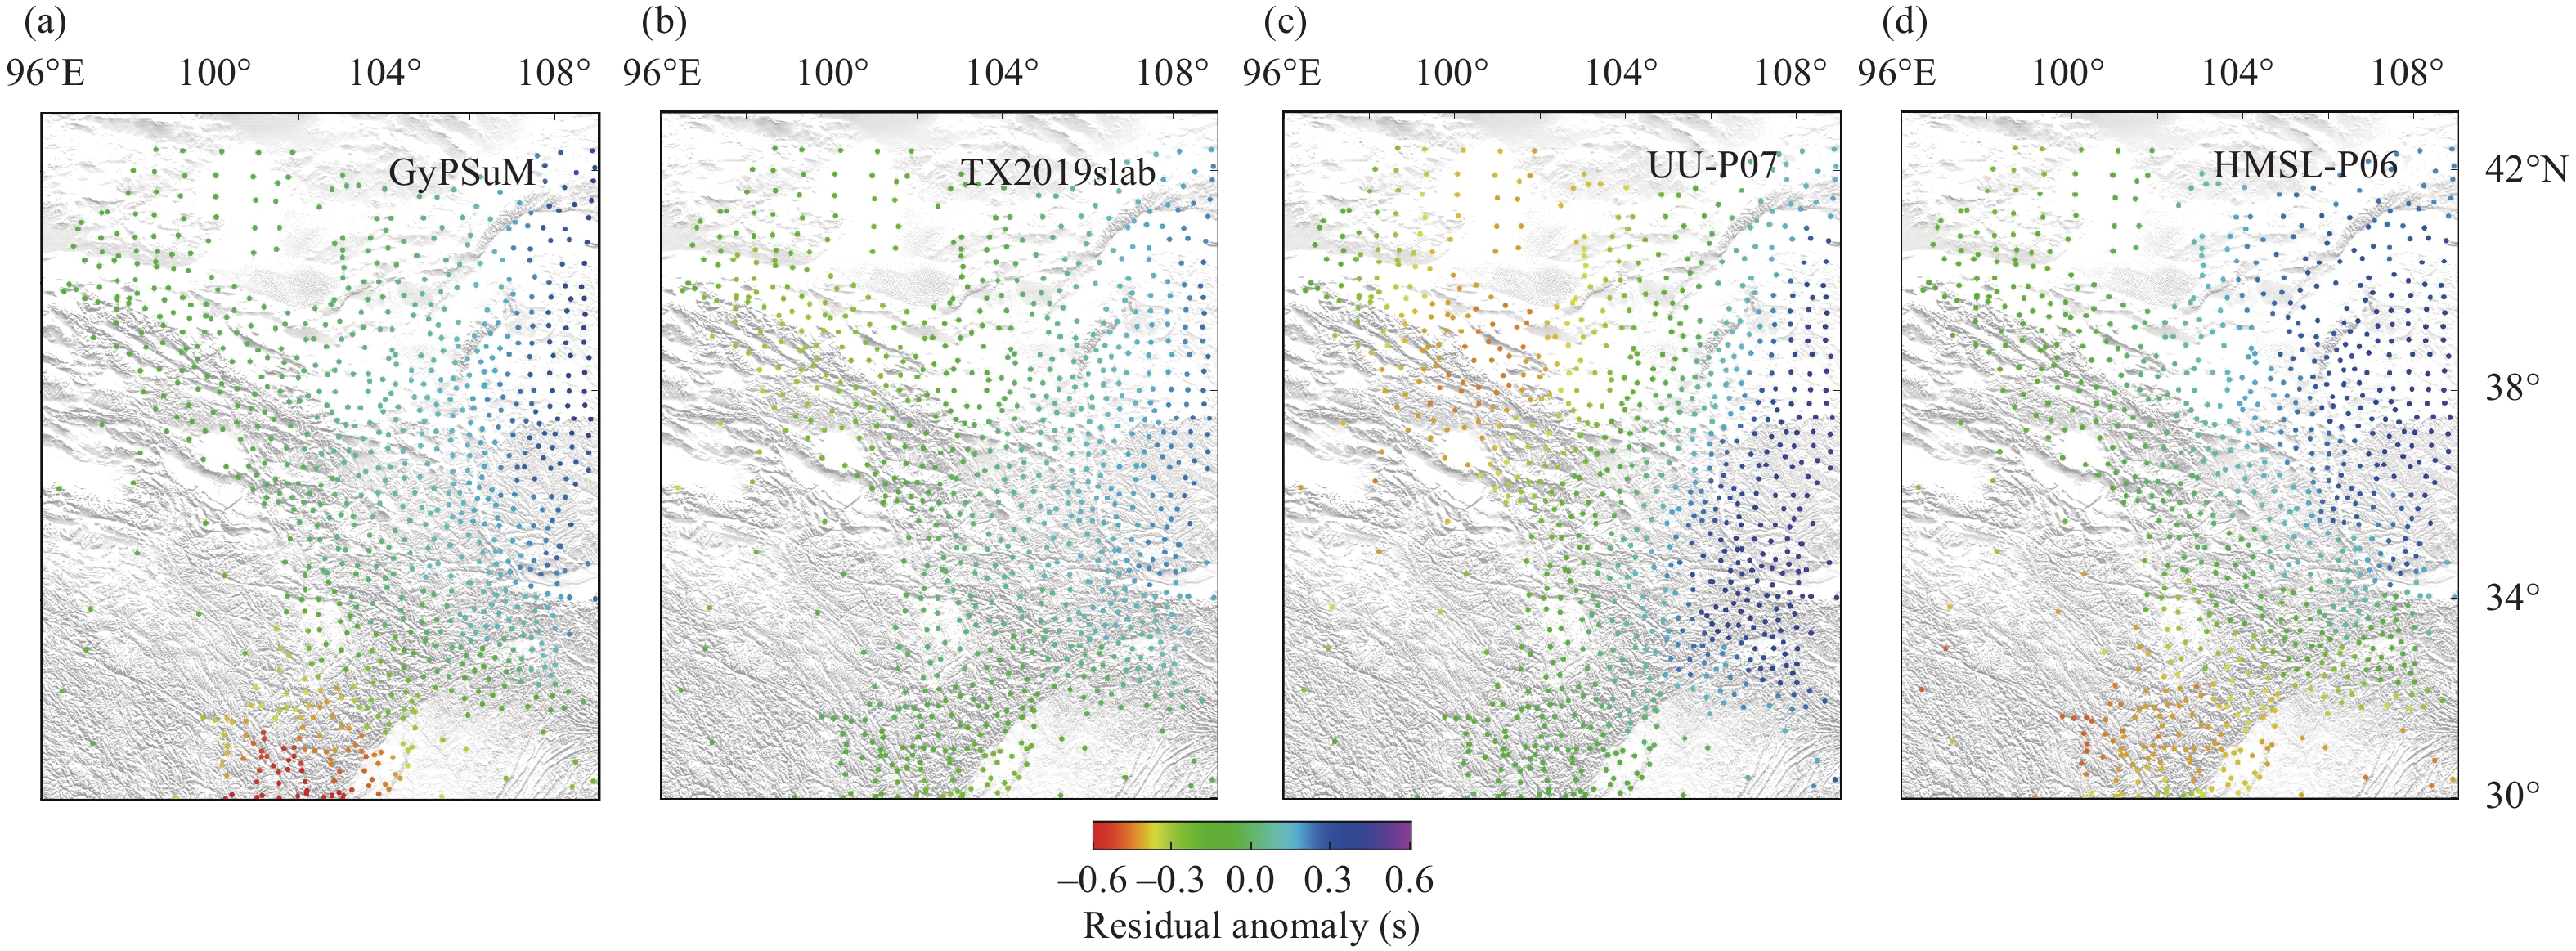
![]() Residual anomalies of M2 for the source in East Africa. Residual anomalies in (a)–(d) are calculated in the global models GyPSuM, TX2019slab, UU-P07, and HMSL-P06, respectively. The dots represent the locations of the stations shown in Figure 1. The color of the dots denotes the value of the residual anomaly.
Residual anomalies of M2 for the source in East Africa. Residual anomalies in (a)–(d) are calculated in the global models GyPSuM, TX2019slab, UU-P07, and HMSL-P06, respectively. The dots represent the locations of the stations shown in Figure 1. The color of the dots denotes the value of the residual anomaly.
-
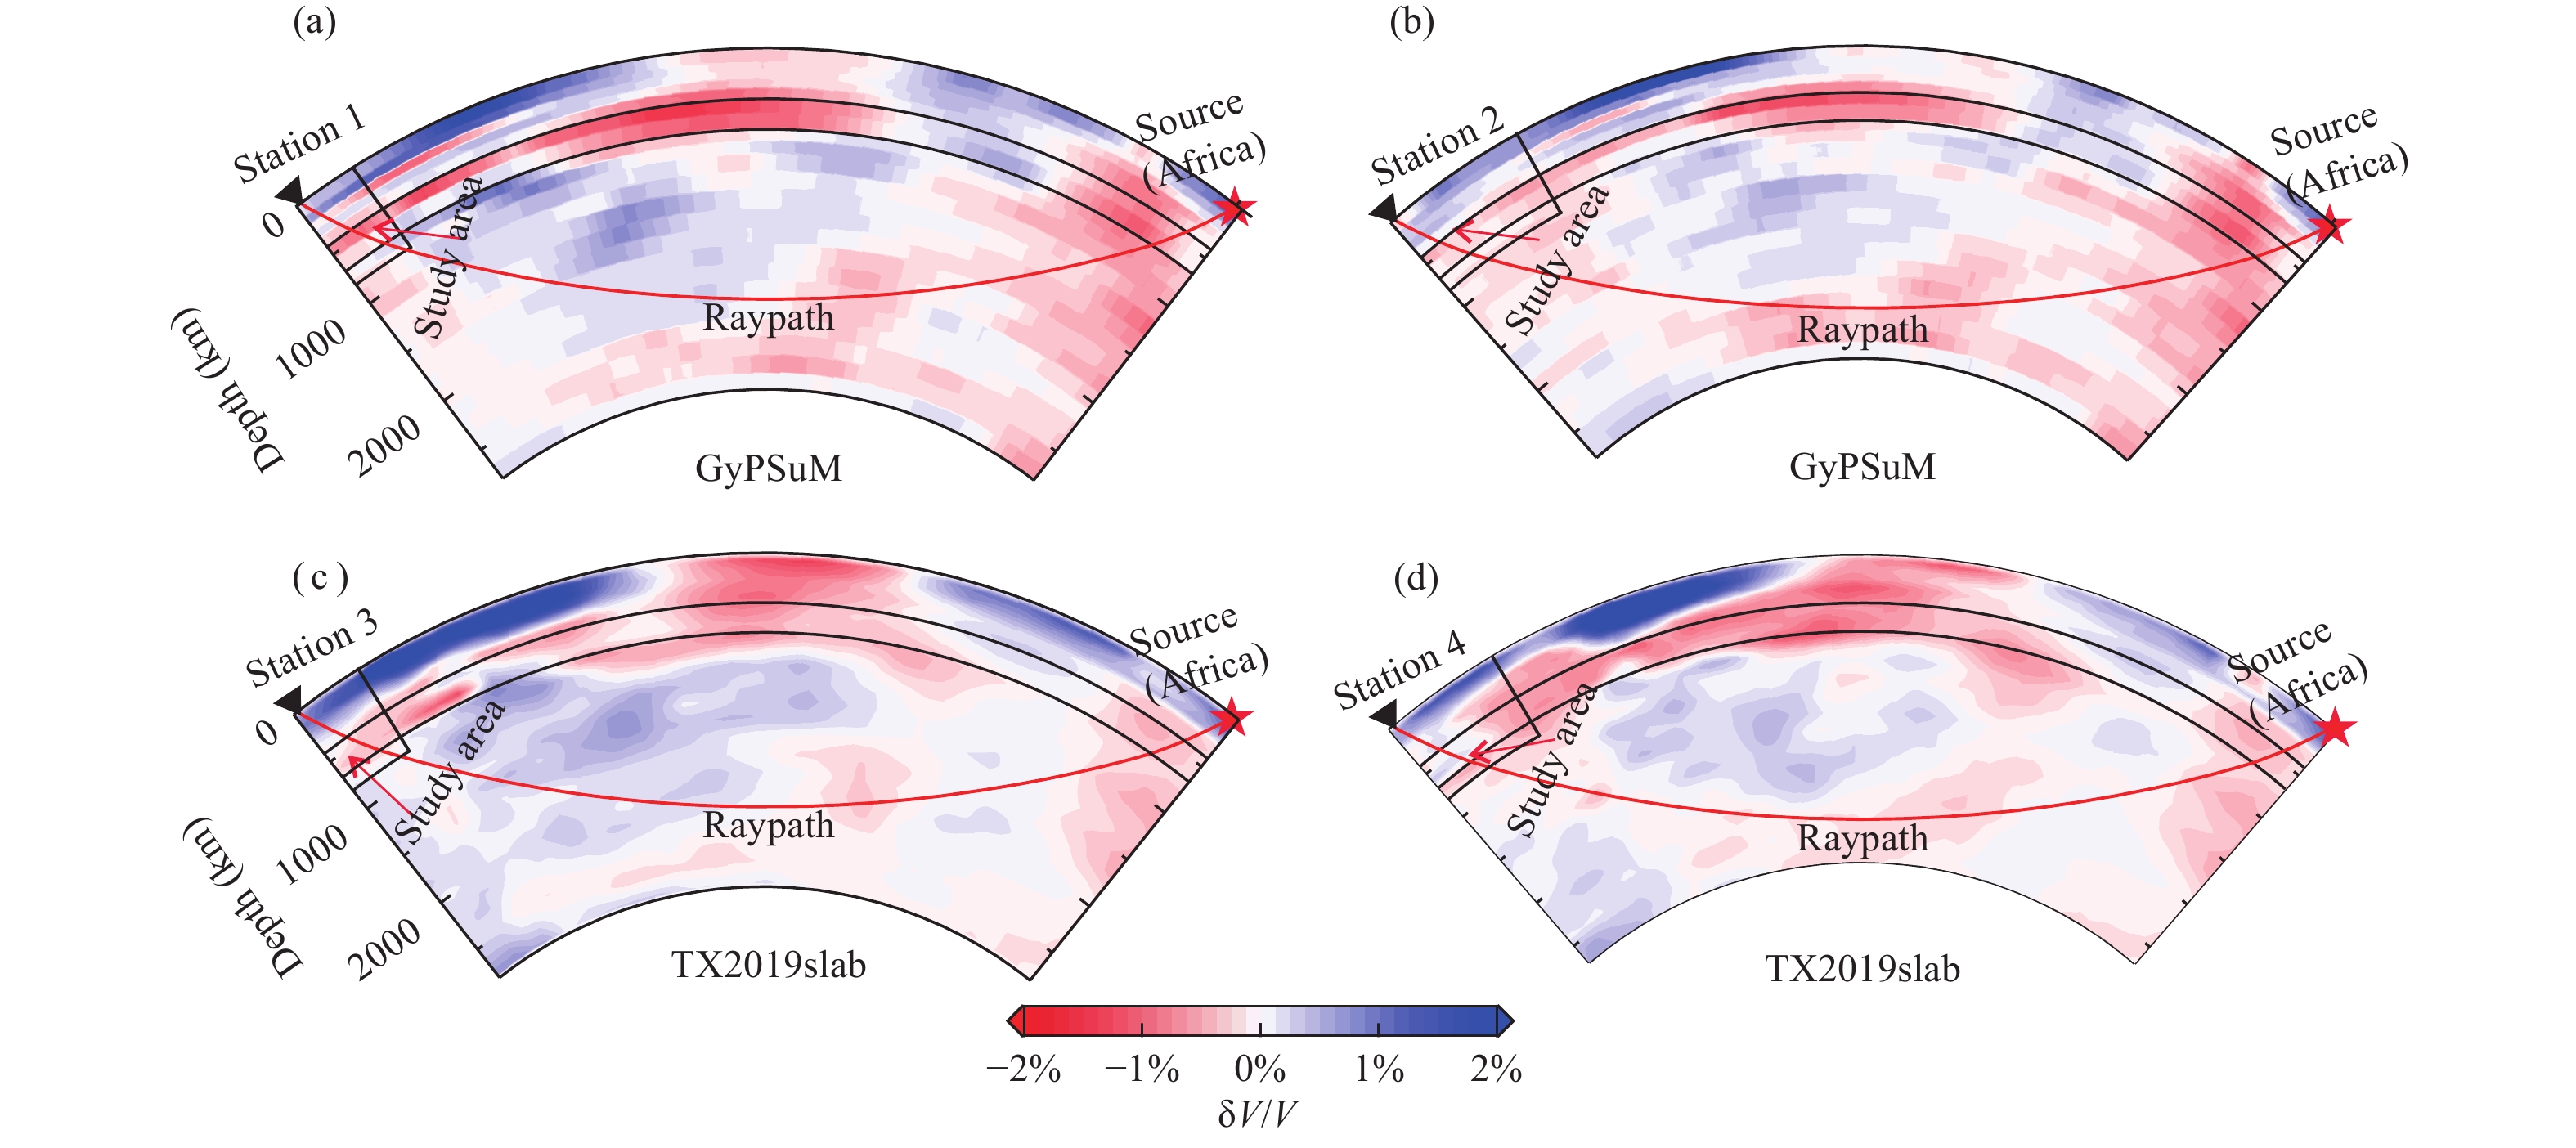
![]() Ray paths and velocity perturbations on cross sections in global models. The red and blue colors show low- and high- velocity perturbations, respectively. The perturbation scale is shown on the bottom. The red star shows earthquake that occurred in East Africa. The red line denotes the ray from the source to a station. The black triangles represent the stations shown in Figure 6a and 6b.
Ray paths and velocity perturbations on cross sections in global models. The red and blue colors show low- and high- velocity perturbations, respectively. The perturbation scale is shown on the bottom. The red star shows earthquake that occurred in East Africa. The red line denotes the ray from the source to a station. The black triangles represent the stations shown in Figure 6a and 6b.
-
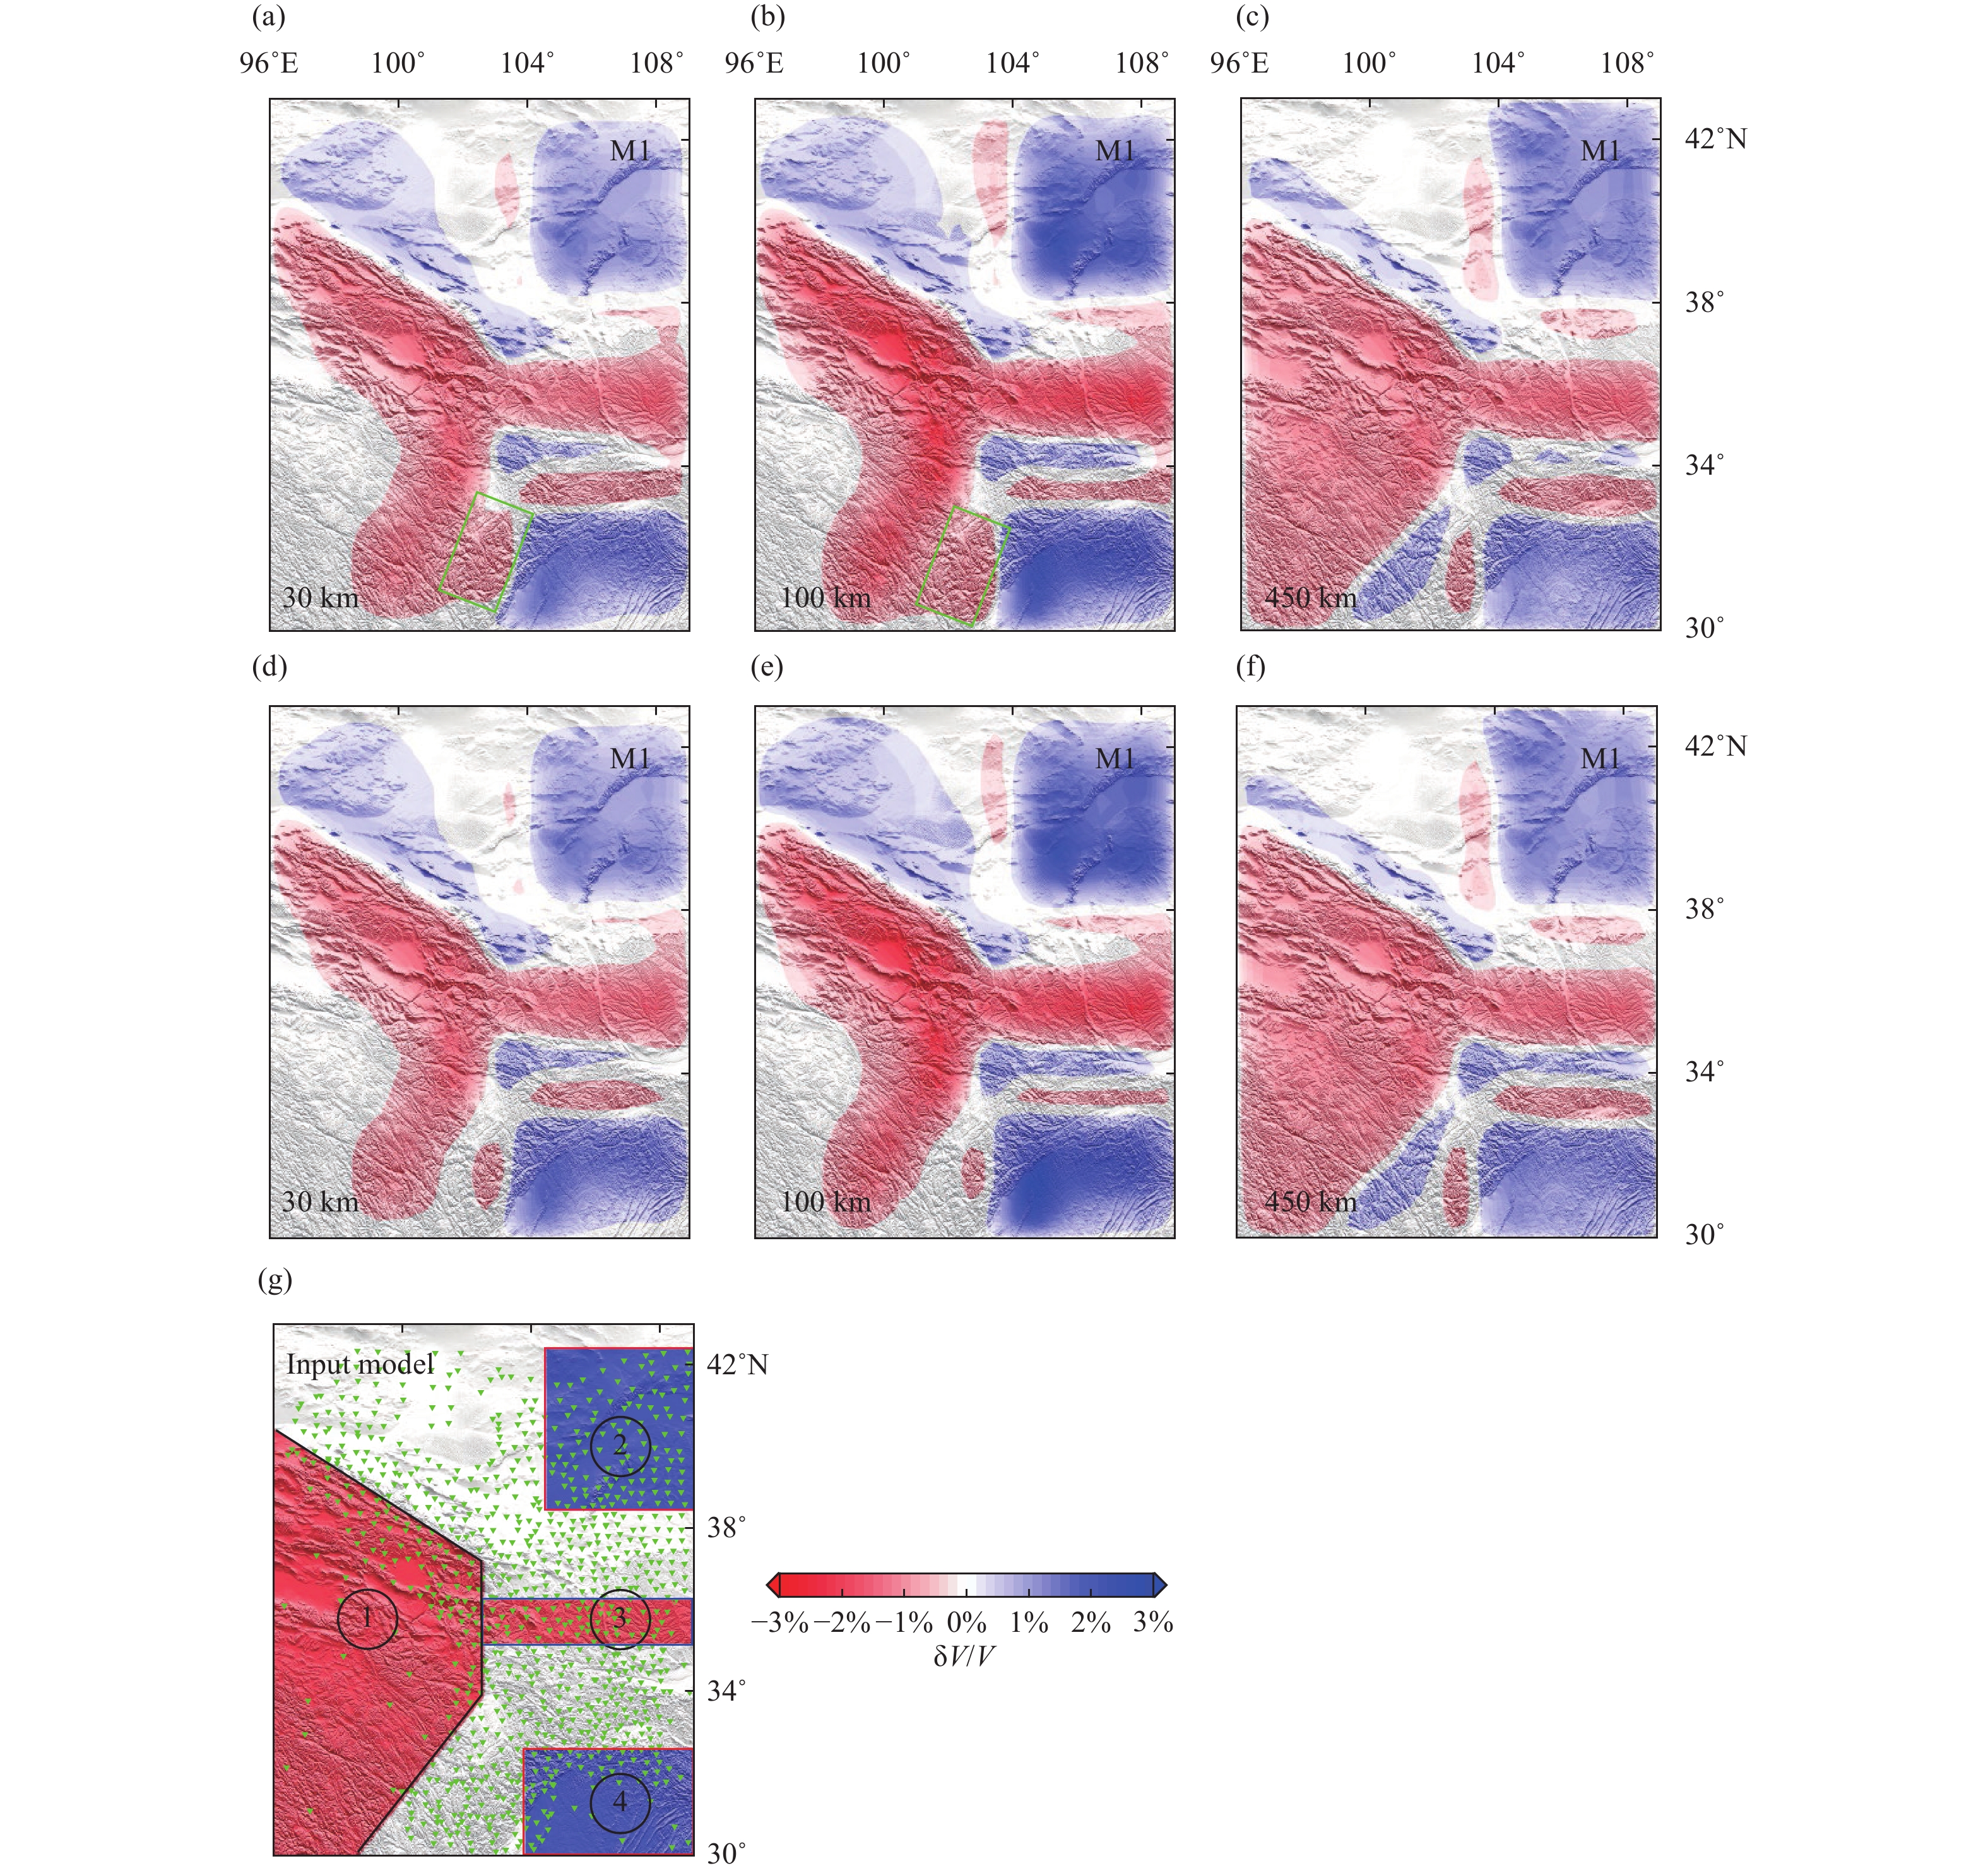
![]() Results of a synthetic tomography test from M1. Tomographic images in (a)–(c) are obtained by incorporating the influence of global mantle heterogeneity. Tomographic images in (d)–(f) are obtained by excluding the influence of global mantle heterogeneity. (g) The synthetic input model. The green rectangles in (a) and (b) mark artifacts that are caused by global mantle heterogeneity. The black, red, and blue lines in (g) mark the contours of the input blocks, respectively. The numbers with circles represent the blocks of the input model. The green inverted triangles in plot (g) denote the seismic stations.
Results of a synthetic tomography test from M1. Tomographic images in (a)–(c) are obtained by incorporating the influence of global mantle heterogeneity. Tomographic images in (d)–(f) are obtained by excluding the influence of global mantle heterogeneity. (g) The synthetic input model. The green rectangles in (a) and (b) mark artifacts that are caused by global mantle heterogeneity. The black, red, and blue lines in (g) mark the contours of the input blocks, respectively. The numbers with circles represent the blocks of the input model. The green inverted triangles in plot (g) denote the seismic stations.
-
![]() Results of a synthetic tomography test from M2. Tomographic images in (a)–(c) are obtained by incorporating the influence of global mantle heterogeneity. Tomographic images in (d)–(f) are obtained by excluding the influence of global mantle heterogeneity. (g) The synthetic input model. The green rectangles in (a)–(c) indicate artifacts that are caused by global mantle heterogeneity. The red lines in (a)–(f) and the blue and black lines in (c) mark the contours of input blocks. The numbers with circles represent the blocks of the input model. The green inverted triangles in plot (g) denote the seismic stations.
Results of a synthetic tomography test from M2. Tomographic images in (a)–(c) are obtained by incorporating the influence of global mantle heterogeneity. Tomographic images in (d)–(f) are obtained by excluding the influence of global mantle heterogeneity. (g) The synthetic input model. The green rectangles in (a)–(c) indicate artifacts that are caused by global mantle heterogeneity. The red lines in (a)–(f) and the blue and black lines in (c) mark the contours of input blocks. The numbers with circles represent the blocks of the input model. The green inverted triangles in plot (g) denote the seismic stations.
-
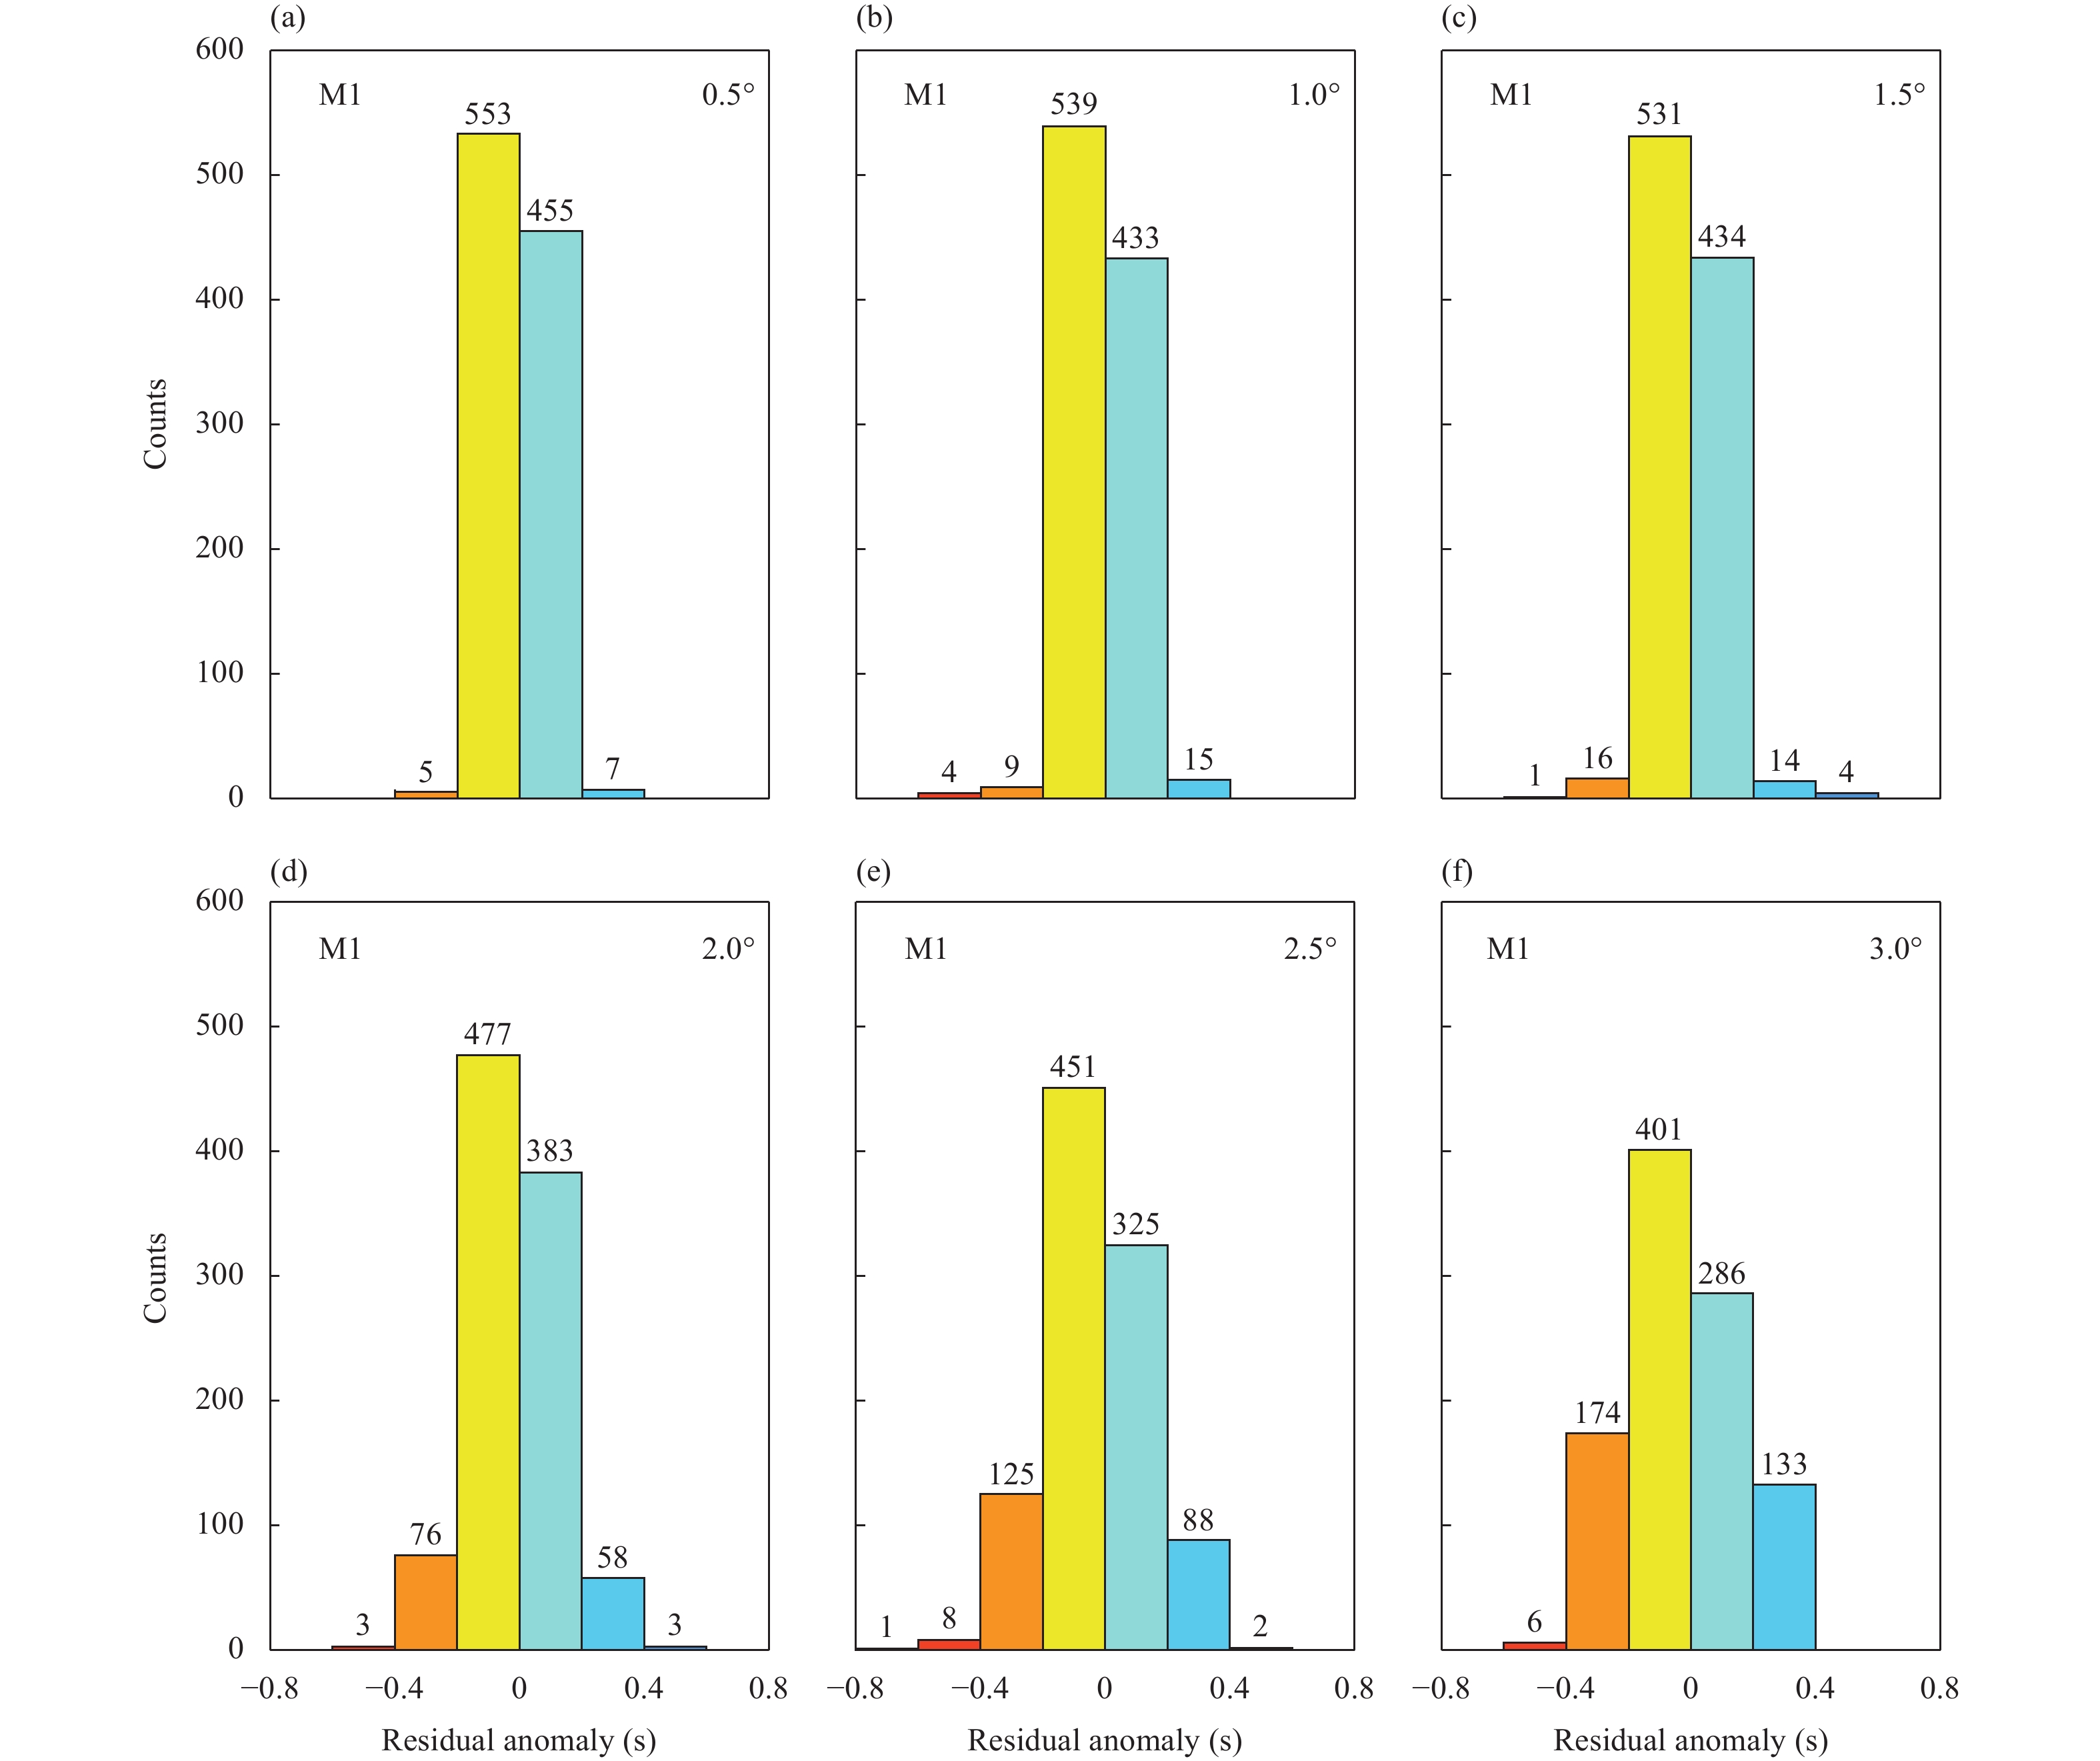
![]() The residual anomalies of M1 for the source in East Africa. Plots (a)–(f) are obtained by using station pairs with station spacings of 0.5°, 1.0°, 1.5°, 2.0°, 2.5° and 3.0°, respectively. The number of station pairs for each column is shown atop the column.
The residual anomalies of M1 for the source in East Africa. Plots (a)–(f) are obtained by using station pairs with station spacings of 0.5°, 1.0°, 1.5°, 2.0°, 2.5° and 3.0°, respectively. The number of station pairs for each column is shown atop the column.
-
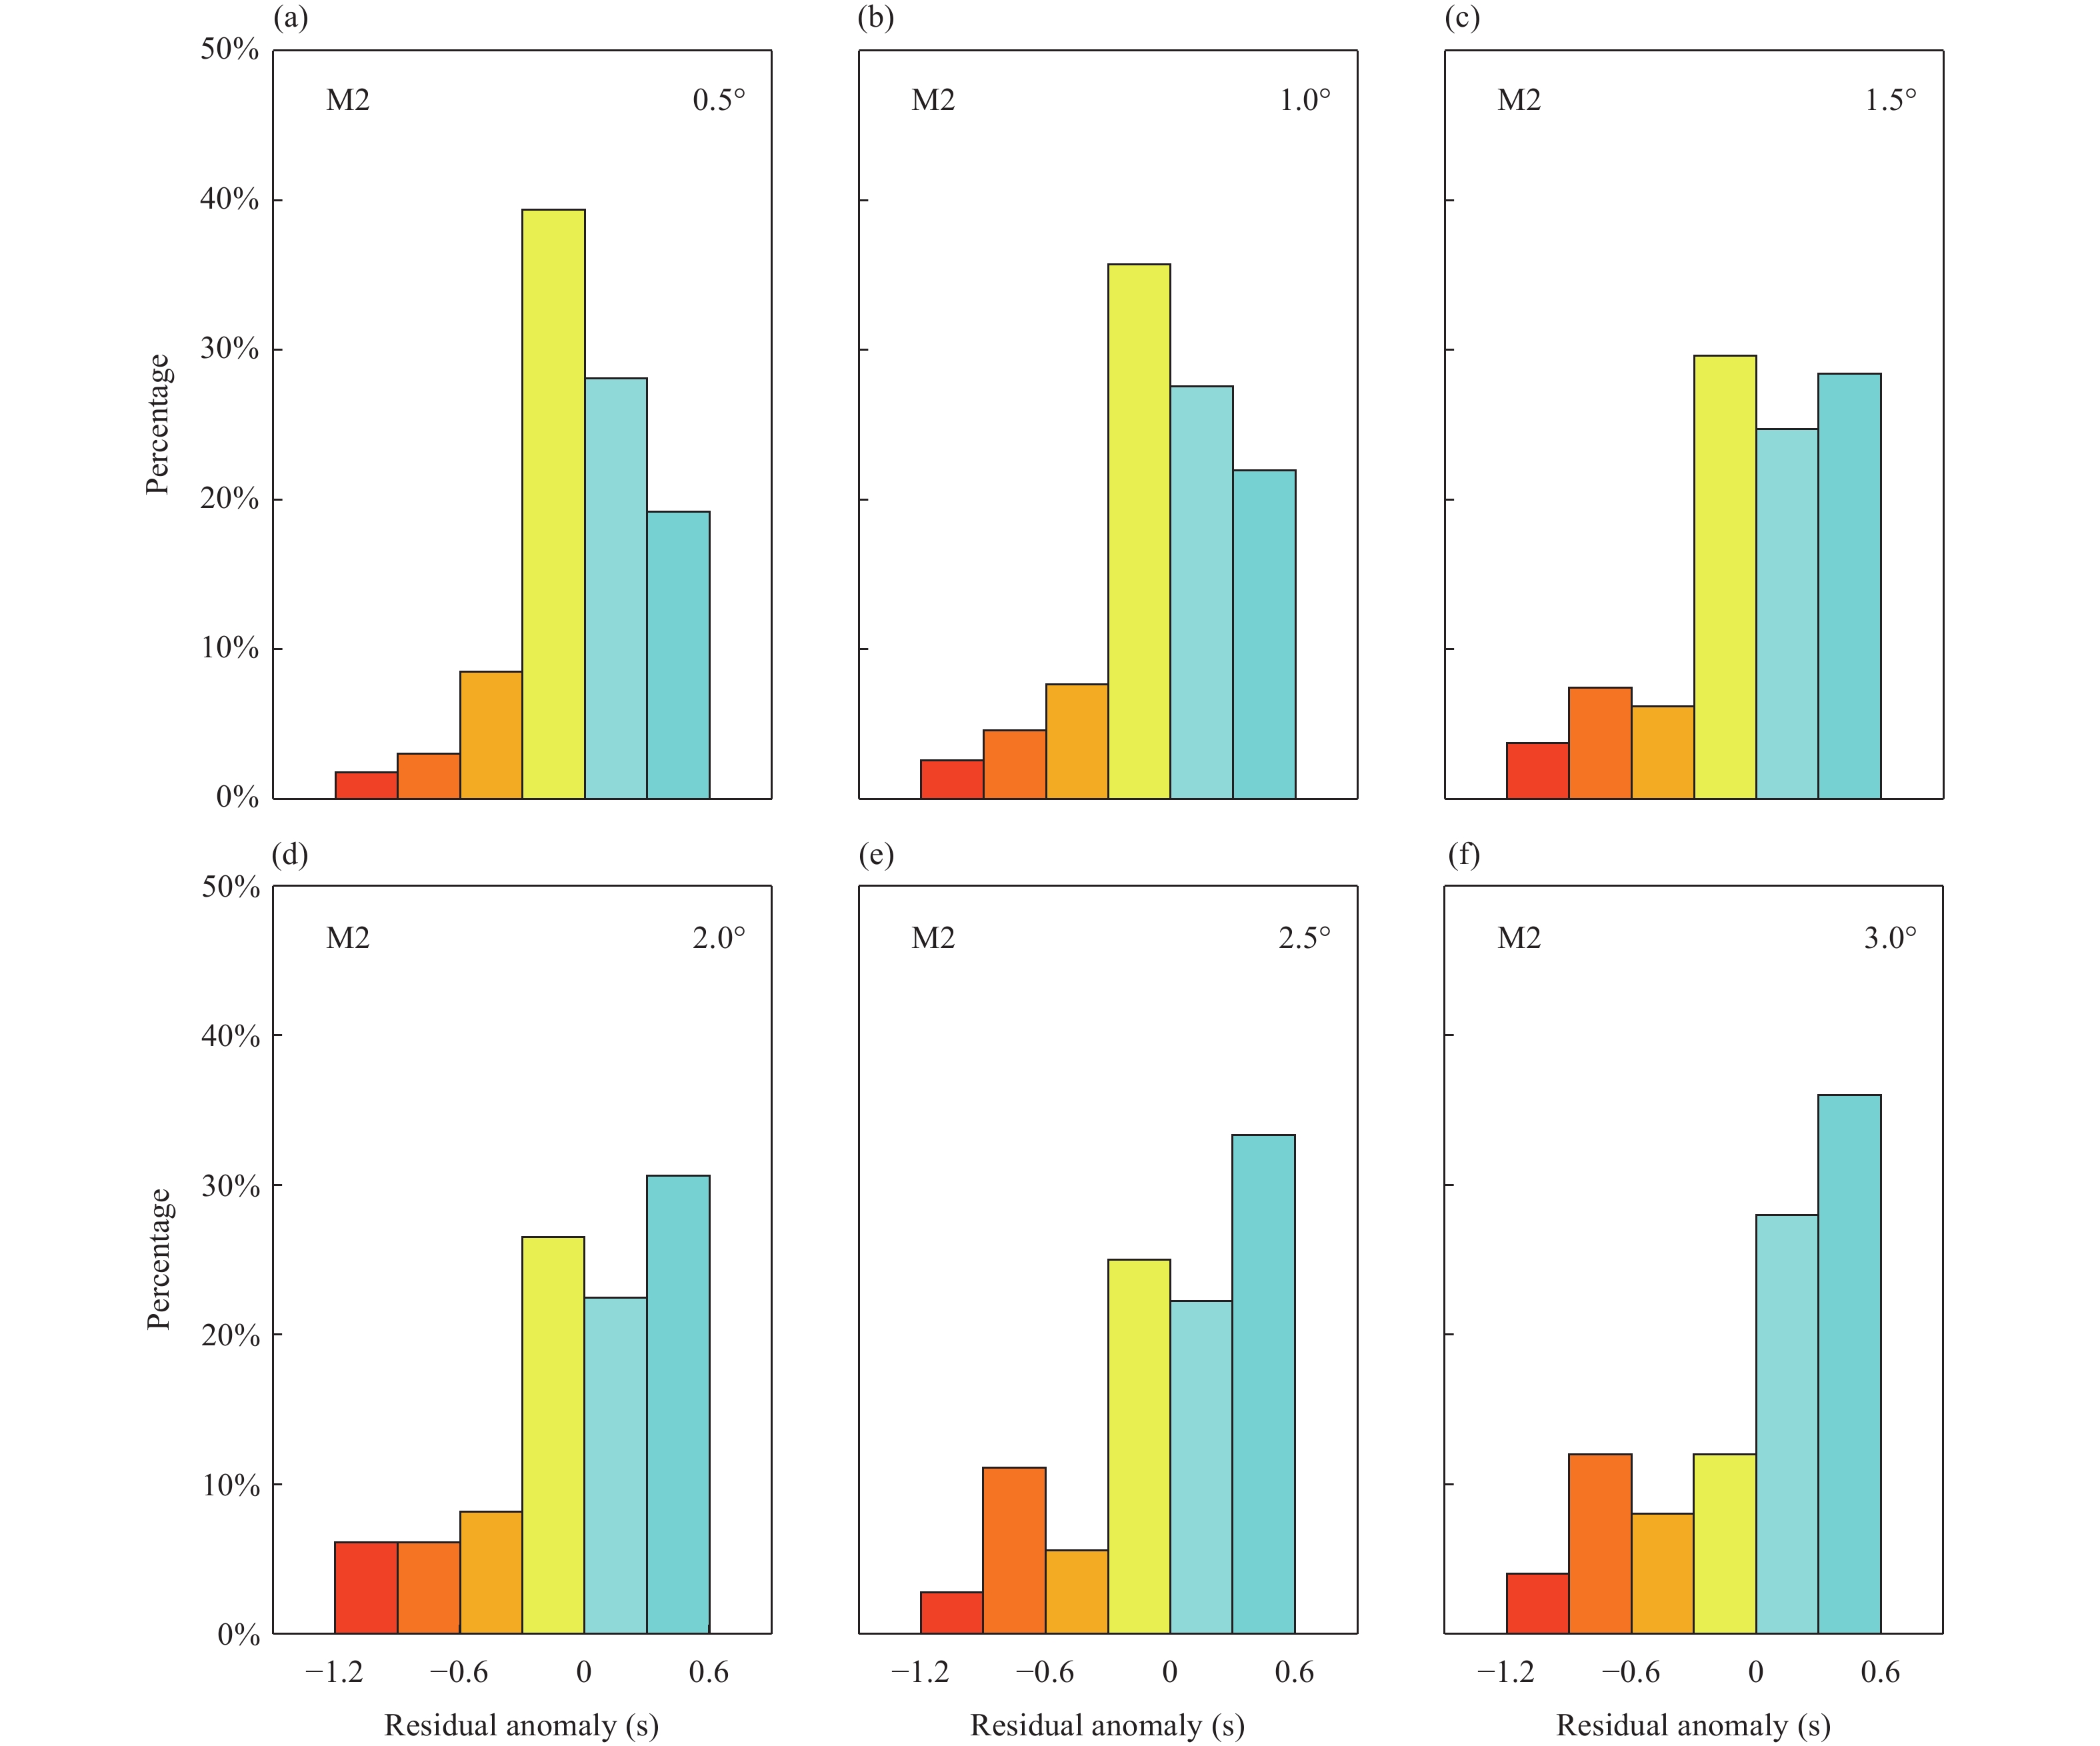
![]() The residual anomalies of M2 for the source in East Africa. Plots (a)–(f) are obtained by using average station spacings of 0.5°, 1.0°, 1.5°, 2.0°, 2.5° and 3.0°, respectively.
The residual anomalies of M2 for the source in East Africa. Plots (a)–(f) are obtained by using average station spacings of 0.5°, 1.0°, 1.5°, 2.0°, 2.5° and 3.0°, respectively.
-
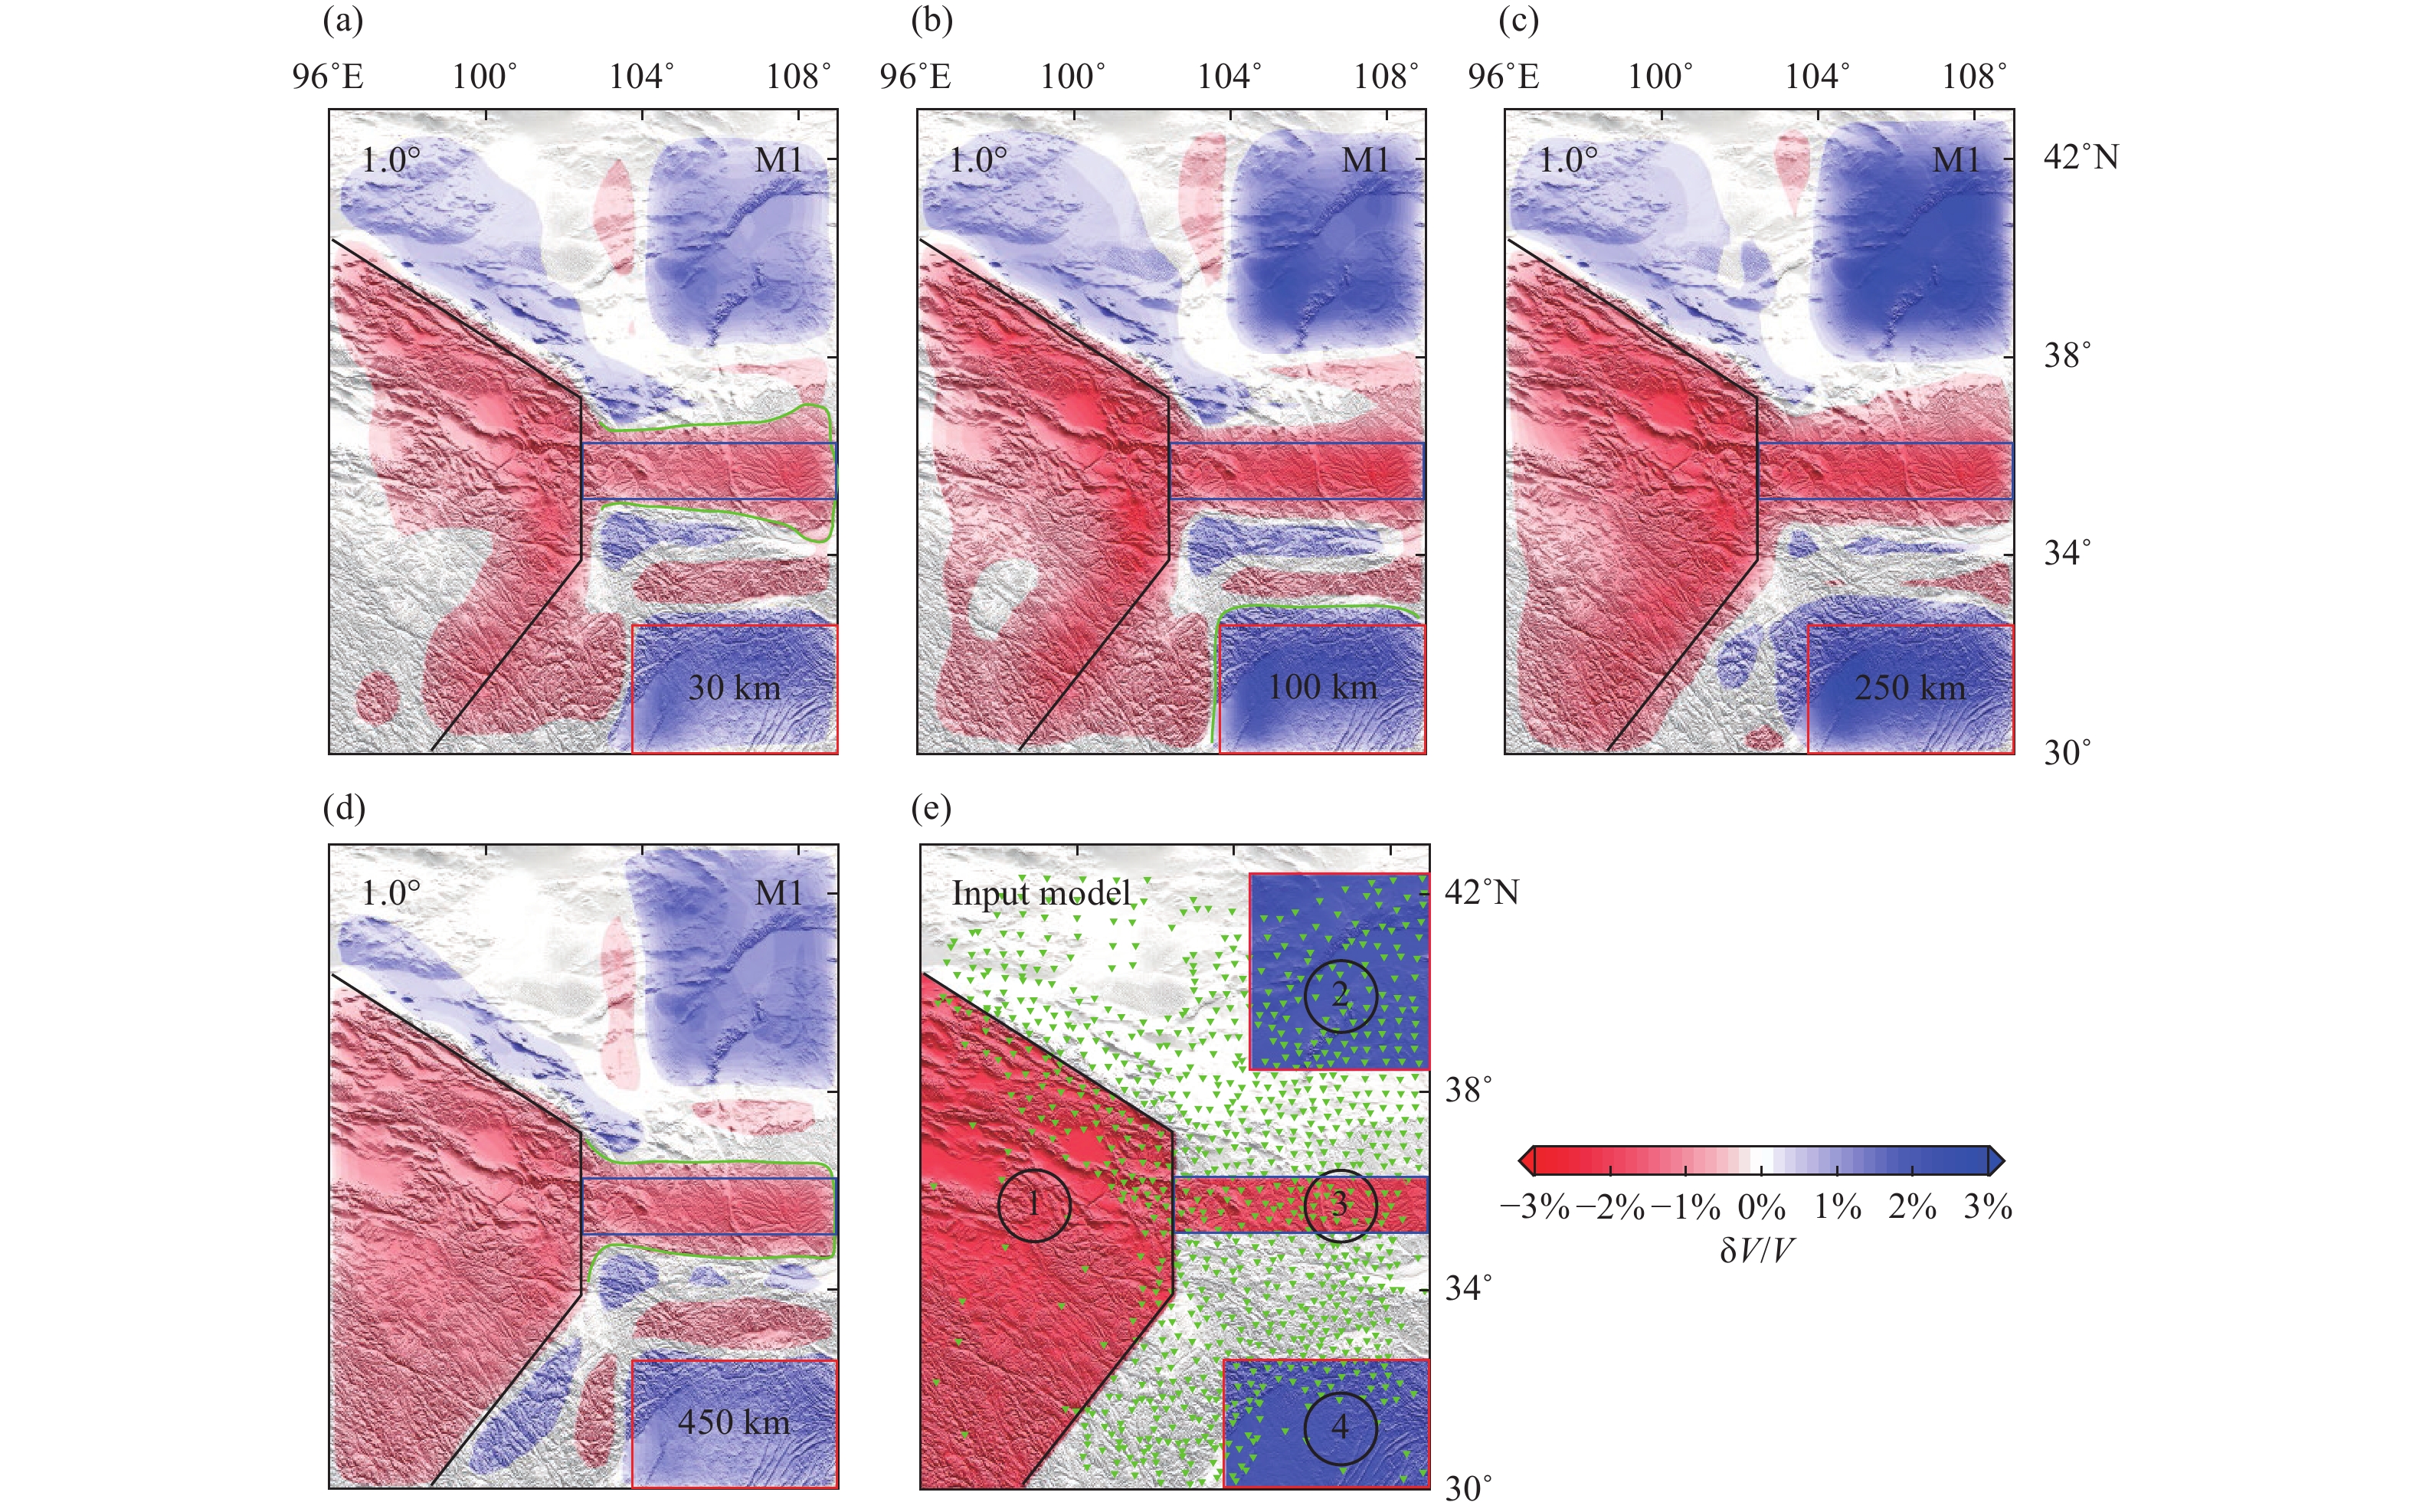
![]() Synthetic tomography test for investigating the influence of station spacing. The test is conducted by using M1 with a station spacing of 1.0°. (a)–(d) are the horizontal slices of the inversion results at different depths. Depth is shown at the right-lower corner of each plot. (e) The synthetic input model. The green lines in (a) and (d) depict the contours of imaged block 3. The black, blue and red lines in each plot mark the contours of blocks1, 3, and 4 of the input model, respectively. The numbers with circles represent the blocks of the input model. The inverted triangles in plot (e) denote seismic stations.
Synthetic tomography test for investigating the influence of station spacing. The test is conducted by using M1 with a station spacing of 1.0°. (a)–(d) are the horizontal slices of the inversion results at different depths. Depth is shown at the right-lower corner of each plot. (e) The synthetic input model. The green lines in (a) and (d) depict the contours of imaged block 3. The black, blue and red lines in each plot mark the contours of blocks1, 3, and 4 of the input model, respectively. The numbers with circles represent the blocks of the input model. The inverted triangles in plot (e) denote seismic stations.
-
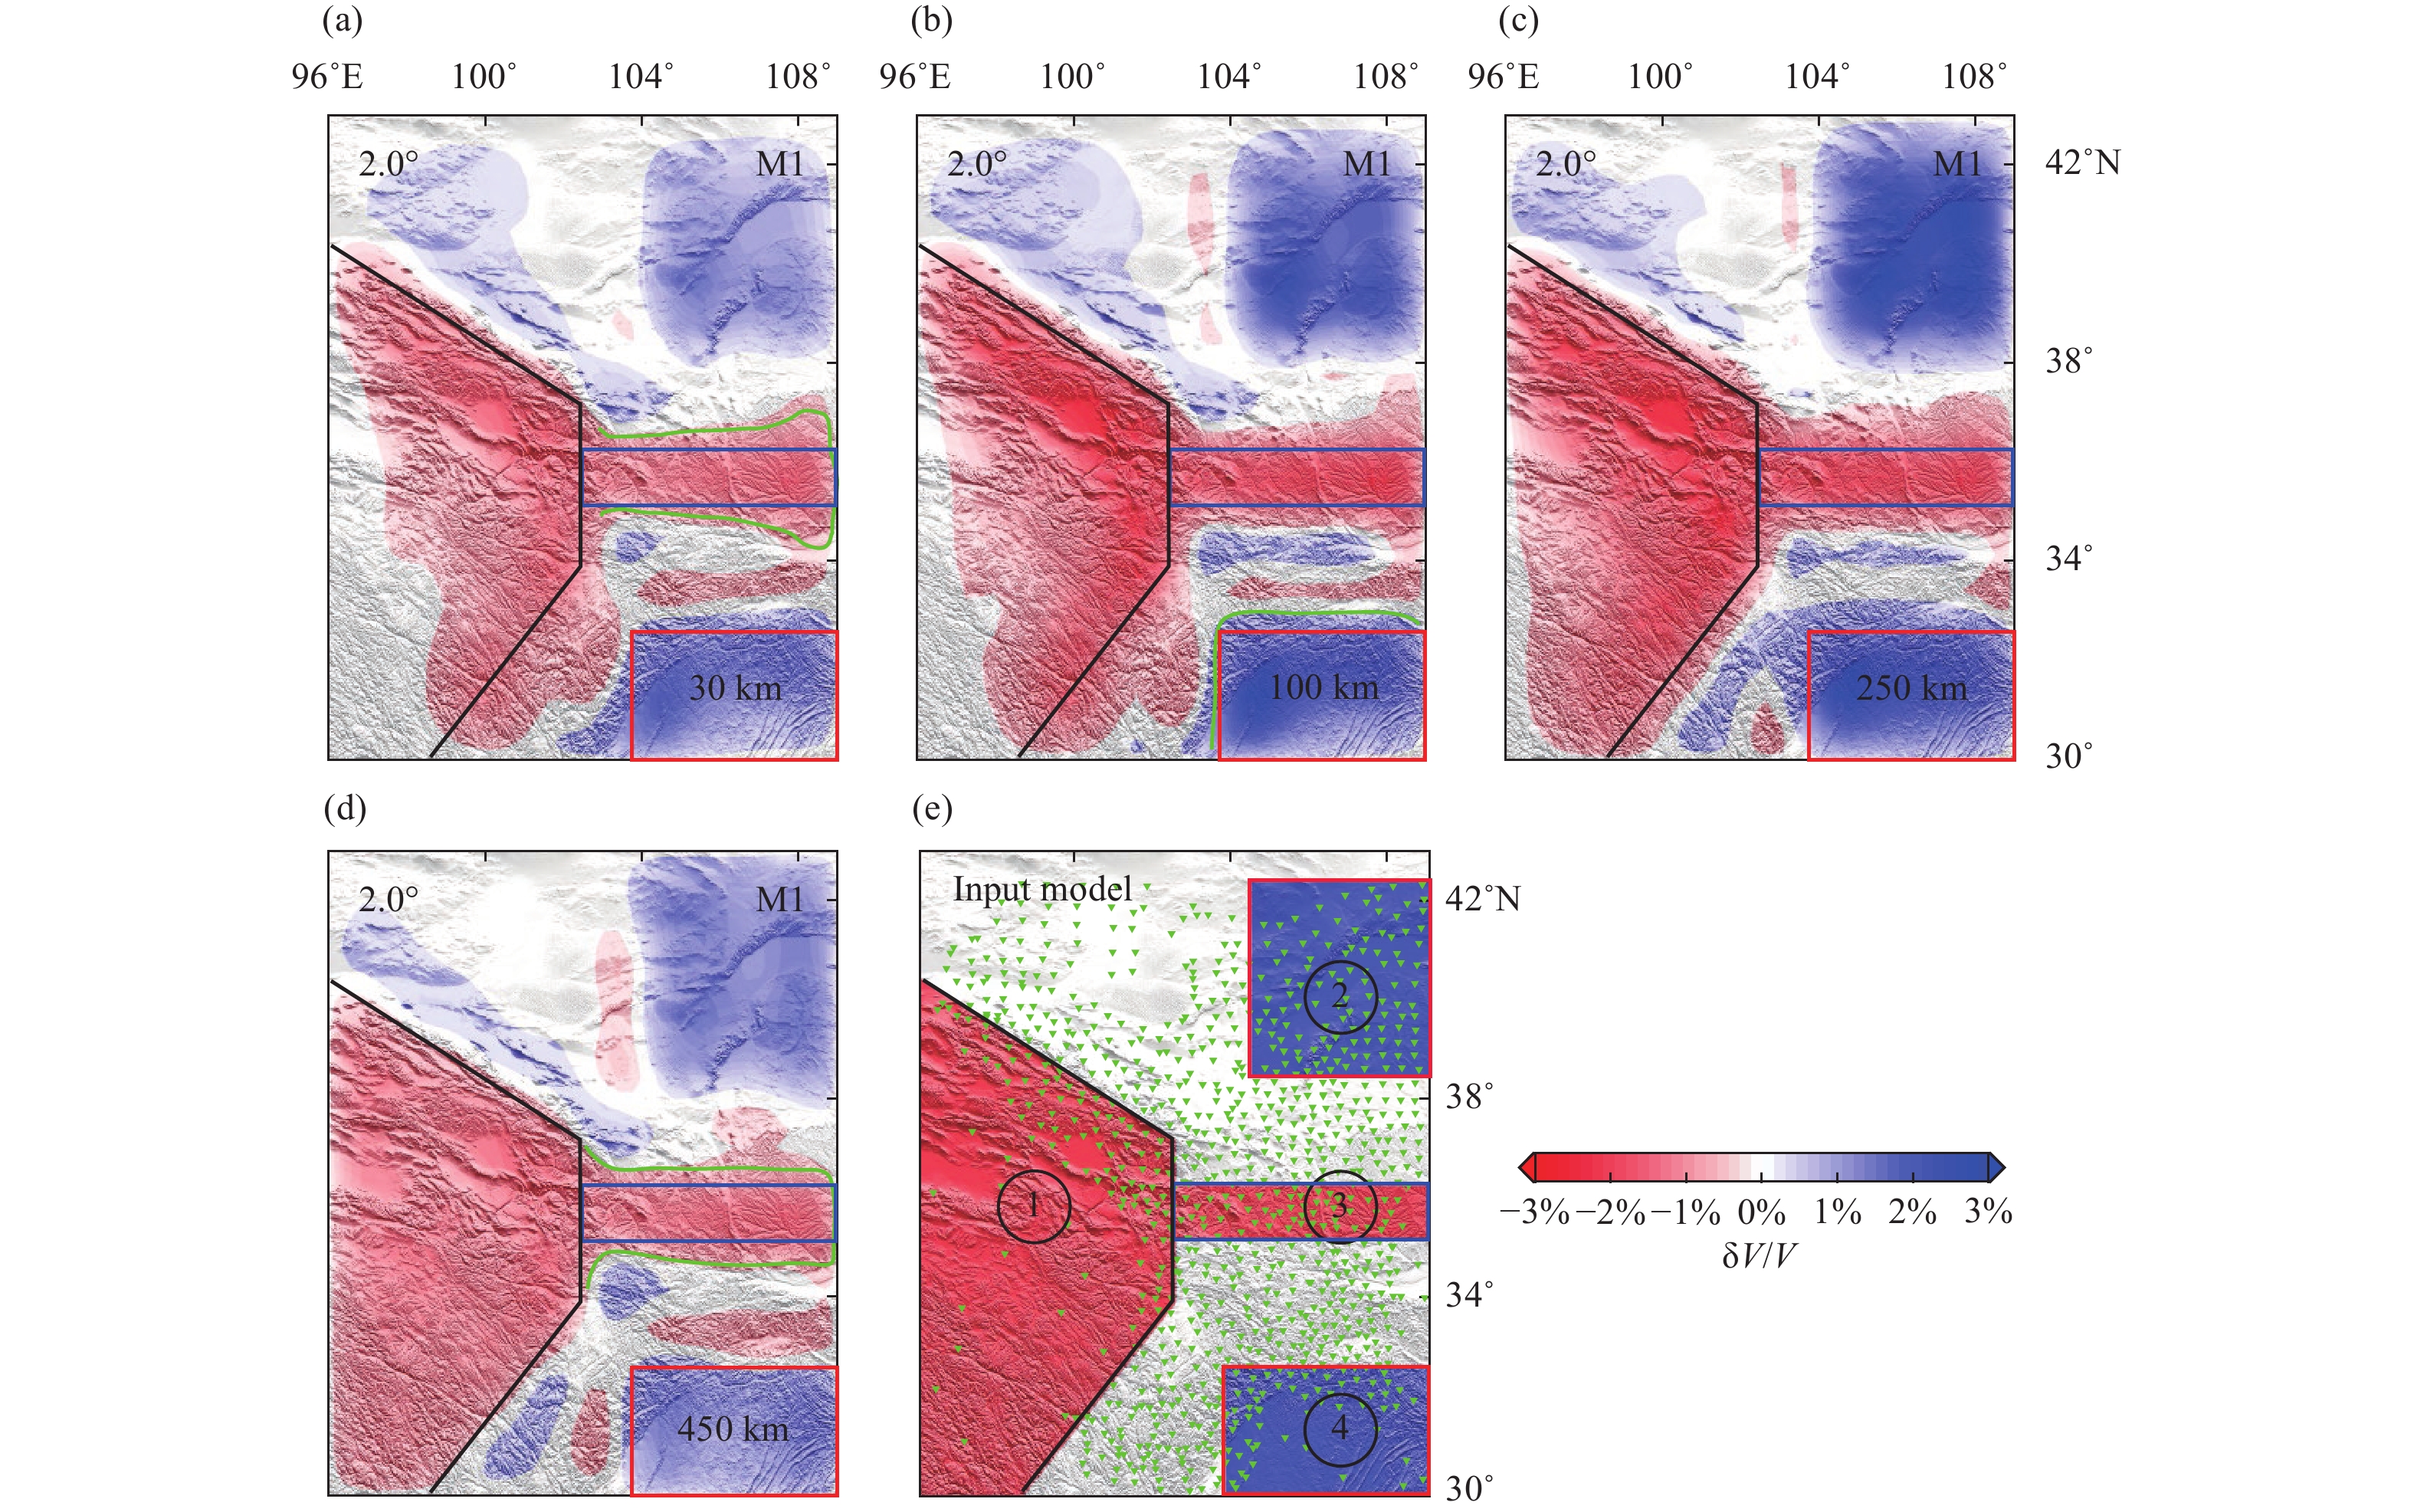
![]() Synthetic tomography test for investigating the influence of station spacing. The test is conducted by using M1 with a station spacing of 2.0°. (a)–(d) are the horizontal slices of the inversion results at different depths. Depth is shown at the right-lower corner of each plot. (e) The synthetic input model. The green lines in (a), (b), and (d) are from Figure 12 for comparison purposes. The black, blue and red lines in (a)–(d) mark the contours of blocks 1, 3, and 4 of the input model, respectively. The numbers with circles represent the blocks of the input model. The inverted triangles in plot (e) denote seismic stations.
Synthetic tomography test for investigating the influence of station spacing. The test is conducted by using M1 with a station spacing of 2.0°. (a)–(d) are the horizontal slices of the inversion results at different depths. Depth is shown at the right-lower corner of each plot. (e) The synthetic input model. The green lines in (a), (b), and (d) are from Figure 12 for comparison purposes. The black, blue and red lines in (a)–(d) mark the contours of blocks 1, 3, and 4 of the input model, respectively. The numbers with circles represent the blocks of the input model. The inverted triangles in plot (e) denote seismic stations.
-
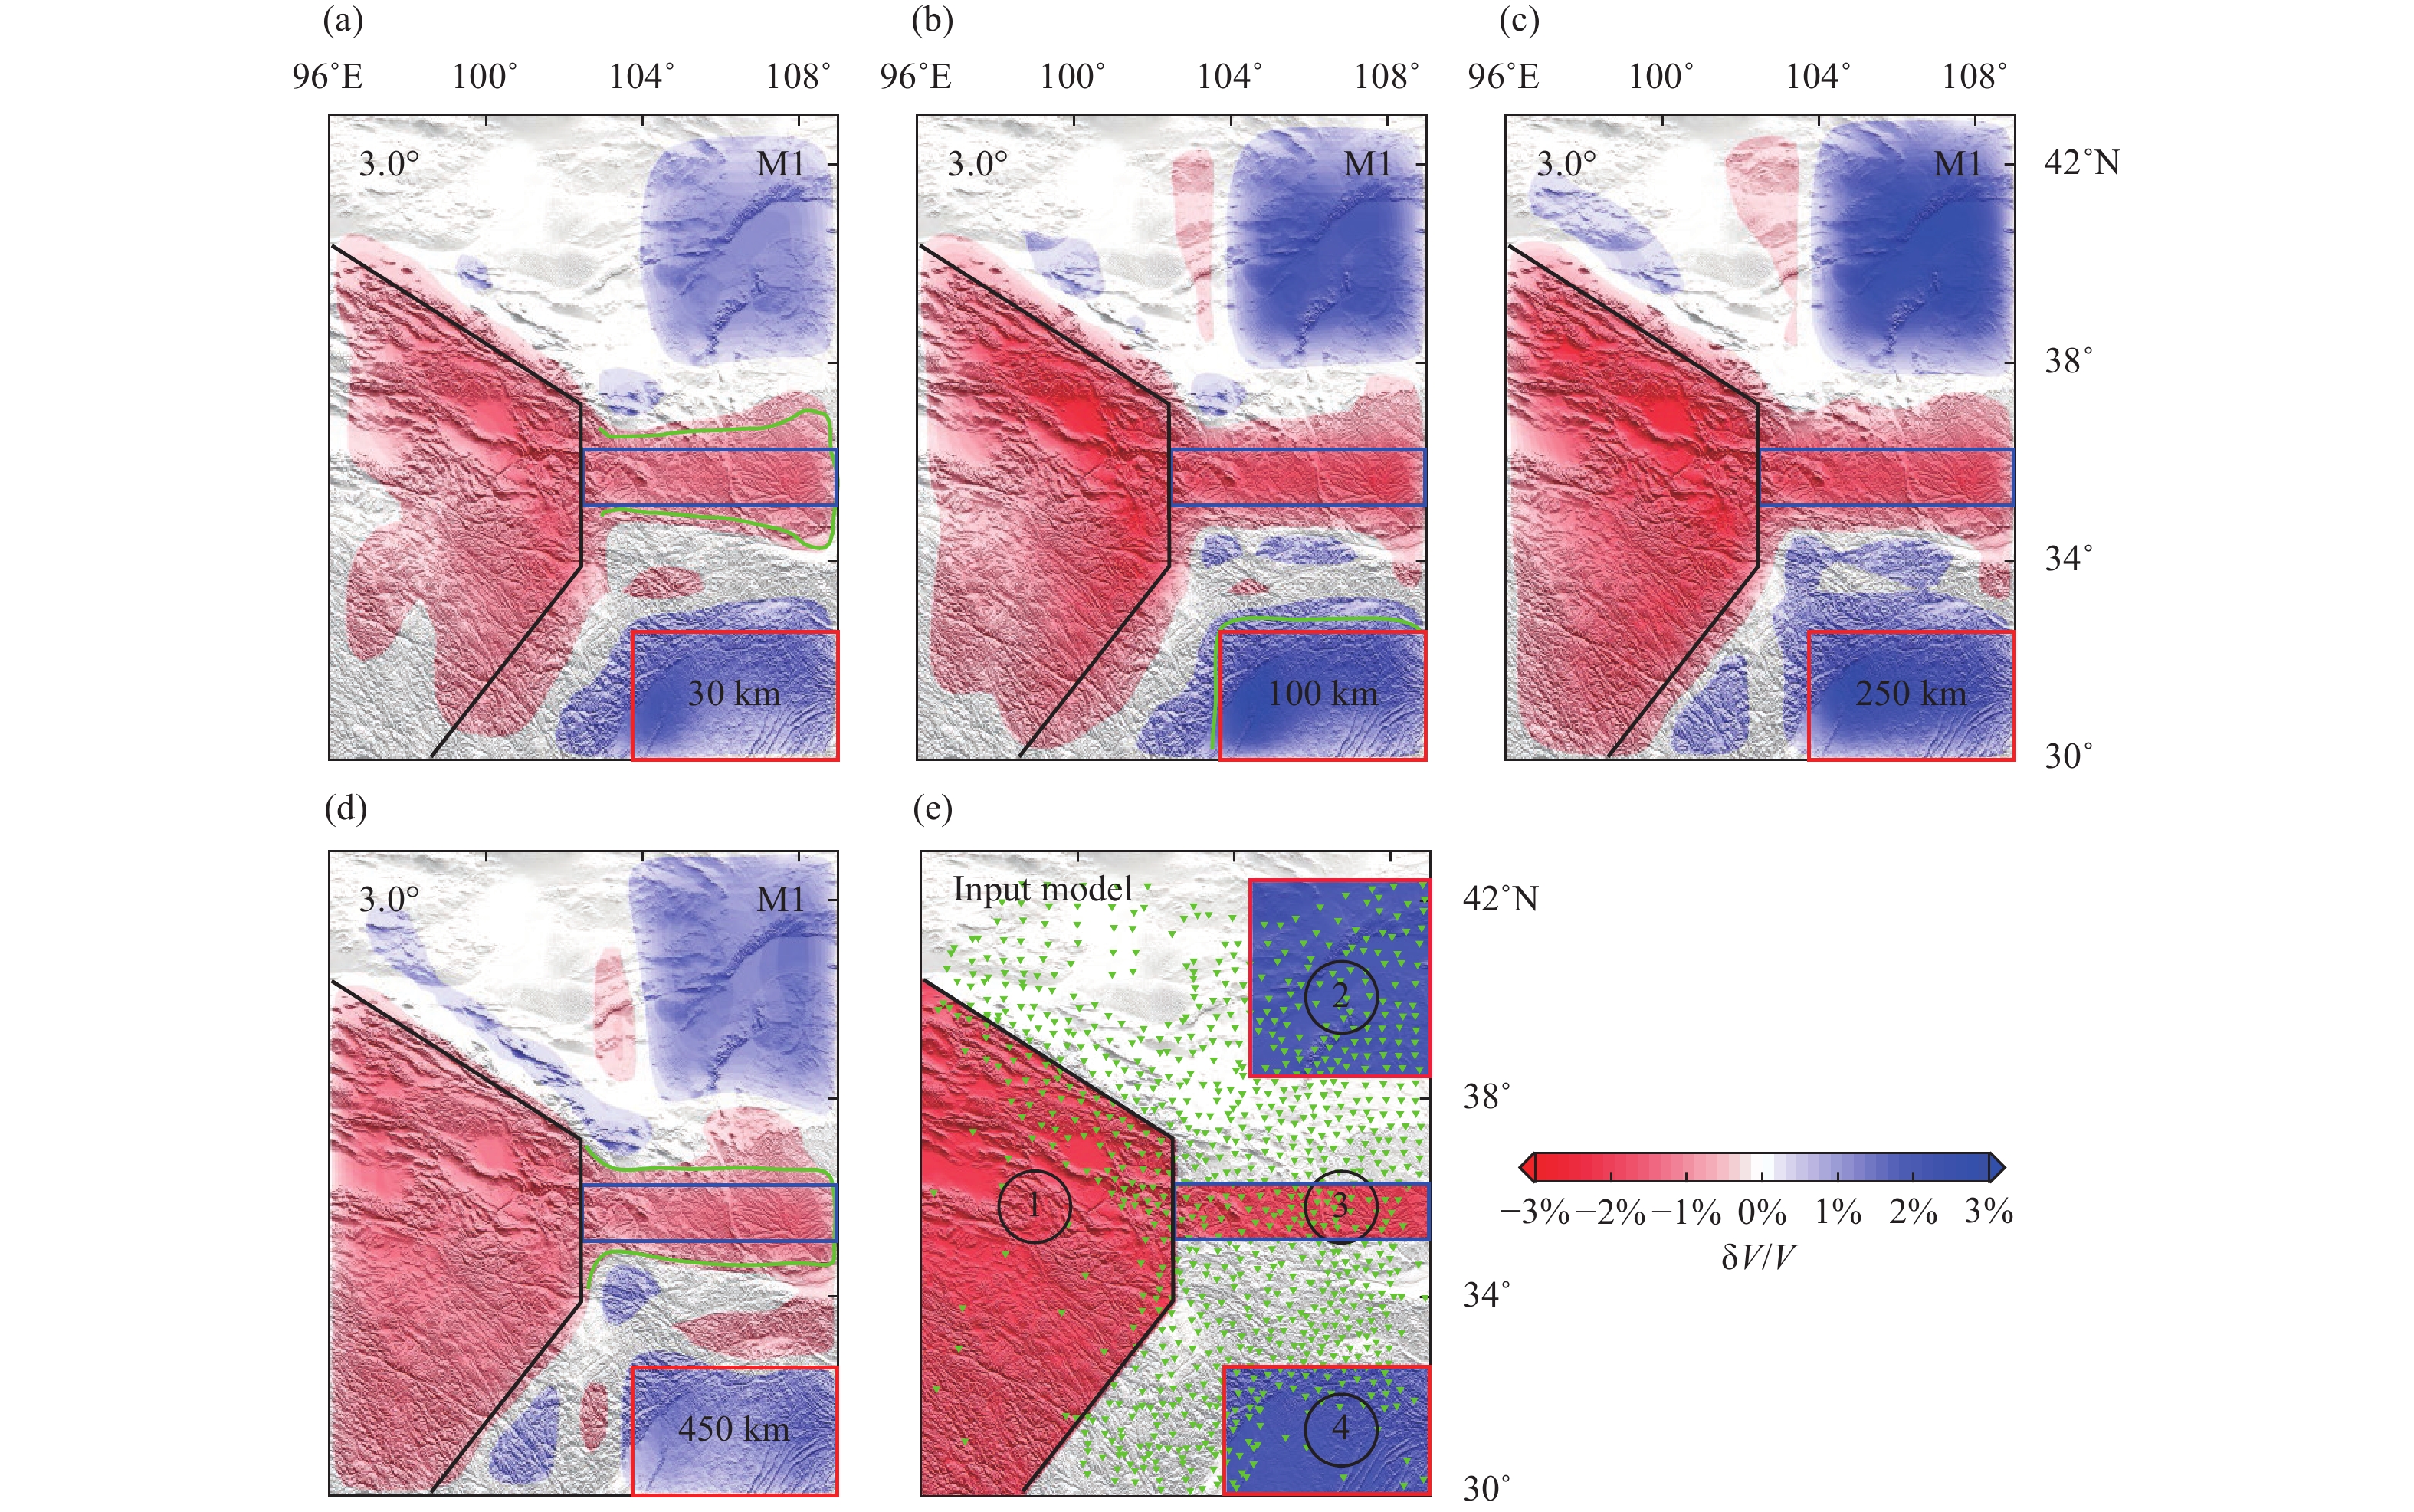
![]() Synthetic tomography test for investigating the influence of station spacing. The test is conducted by using M1 with a station spacing of 3.0°. (a)–(d) are the horizontal slices of the inversion results at different depths. Depth is shown at the right-lower corner of each plot. (e) The synthetic input model. The green lines in (a), (b), and (d) are from Figure 12 for comparison purposes. The black, blue and red lines in each plot mark the contours of blocks 1, 3, and 4 of the input model, respectively. The numbers with circles represent the blocks of the input model. The inverted triangles in plot (e) denote seismic stations.
Synthetic tomography test for investigating the influence of station spacing. The test is conducted by using M1 with a station spacing of 3.0°. (a)–(d) are the horizontal slices of the inversion results at different depths. Depth is shown at the right-lower corner of each plot. (e) The synthetic input model. The green lines in (a), (b), and (d) are from Figure 12 for comparison purposes. The black, blue and red lines in each plot mark the contours of blocks 1, 3, and 4 of the input model, respectively. The numbers with circles represent the blocks of the input model. The inverted triangles in plot (e) denote seismic stations.
-
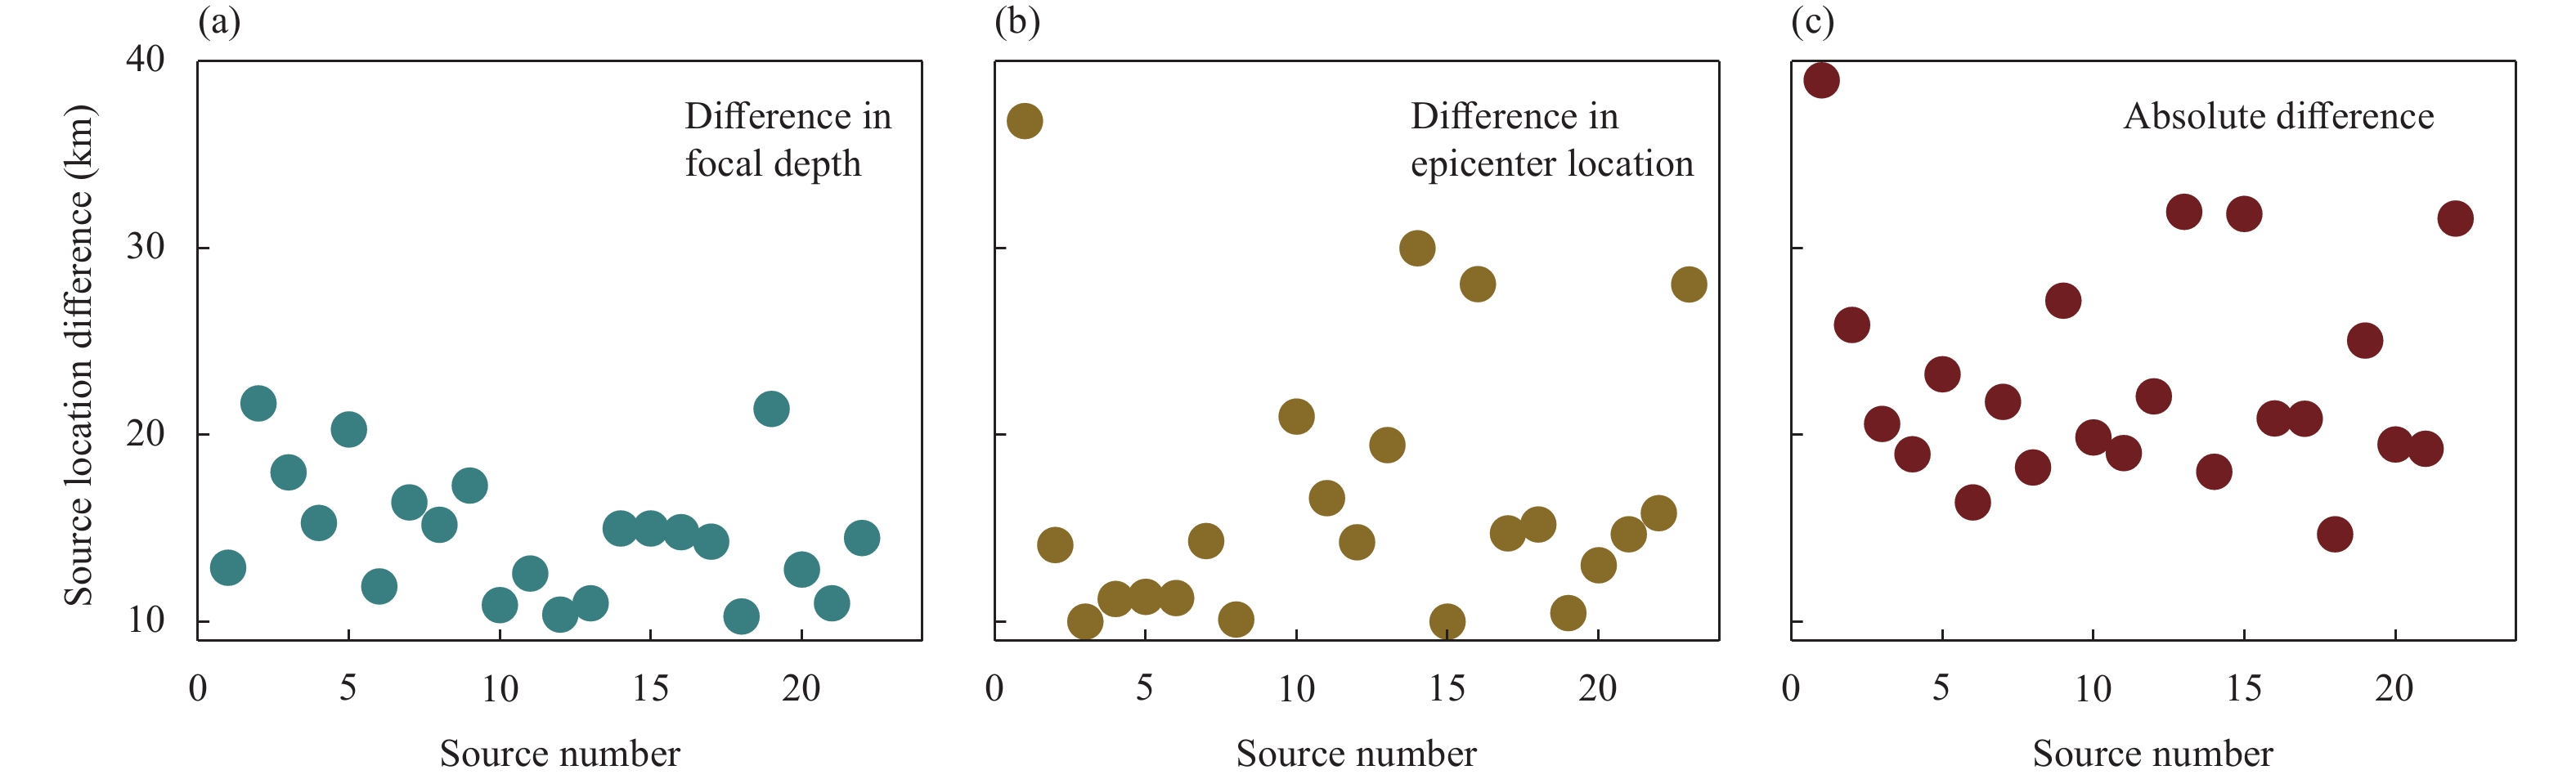
![]() The difference in hypocenter locations provided by ISC and USGS. Plots (a), (b) and (c) show the differences in source locations in focal depths, epicenters and absolute locations, respectively.
The difference in hypocenter locations provided by ISC and USGS. Plots (a), (b) and (c) show the differences in source locations in focal depths, epicenters and absolute locations, respectively.
-
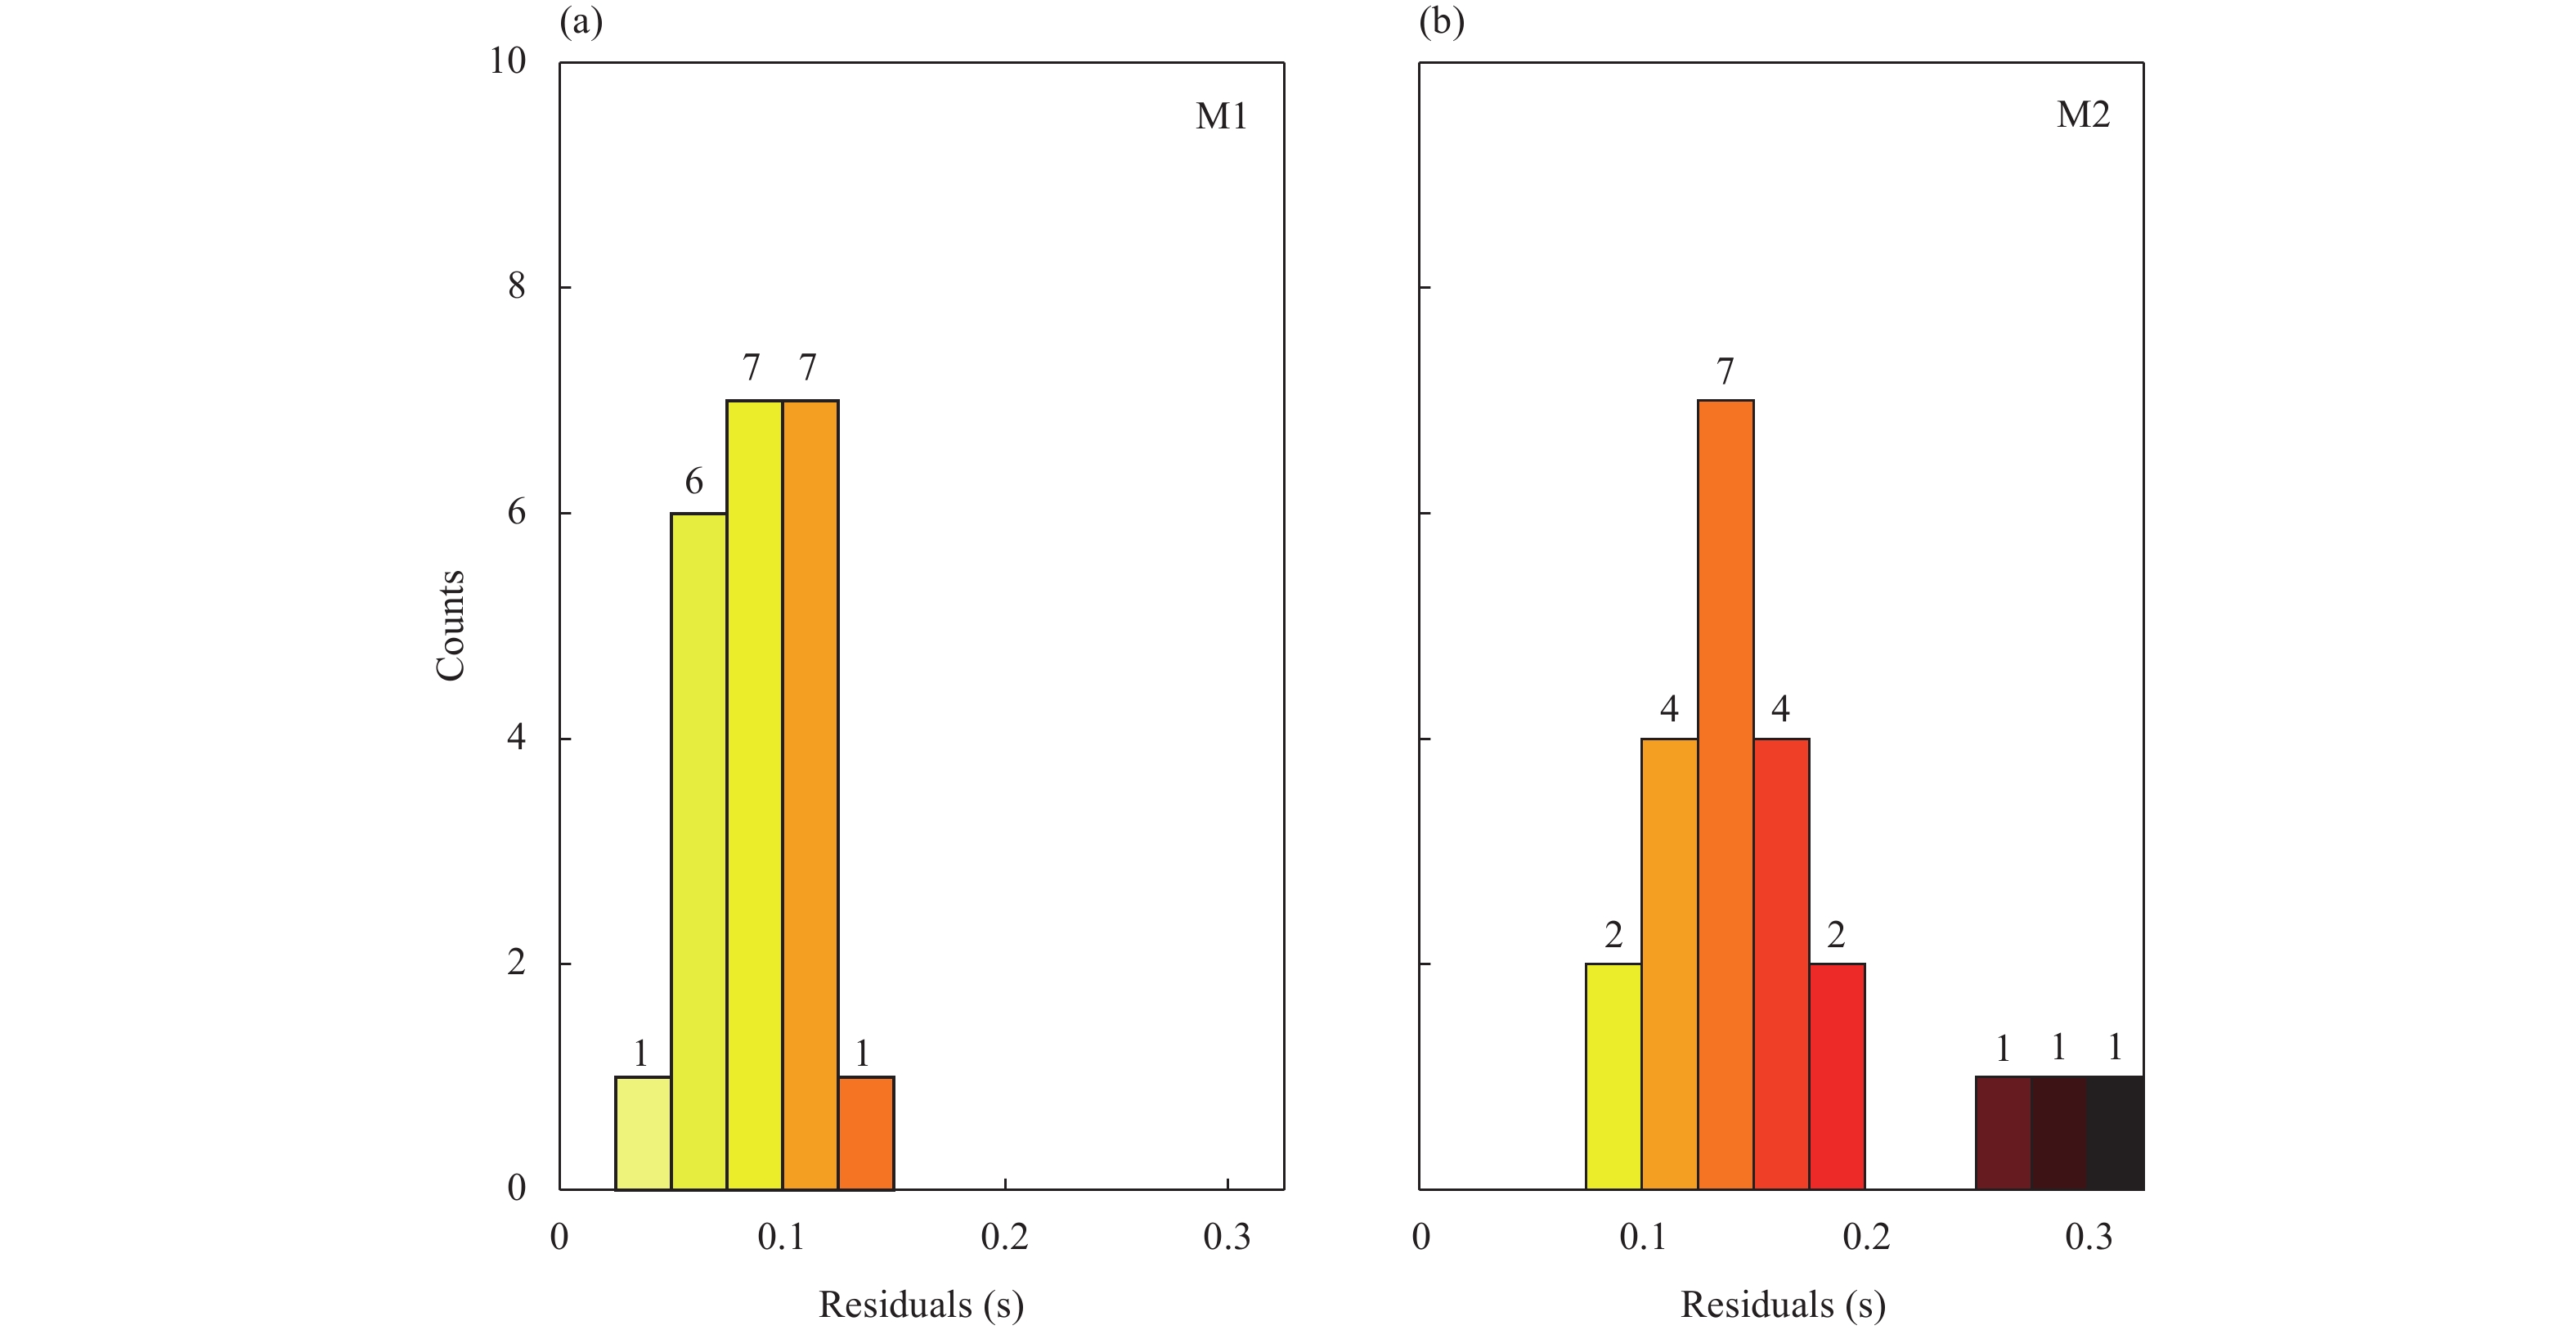
![]() Residuals of traveltime differences to investigate the influence of source uncertainties. We choose a total of 22 teleseismic events to calculate the residuals. For each event, the maximum absolute value of the traveltime difference anomaly among all the station pairs (or stations) is considered as the residual for the corresponding event. The number of events for each column is shown atop the column. Plots (a) and (b) are for M1 and M2, respectively.
Residuals of traveltime differences to investigate the influence of source uncertainties. We choose a total of 22 teleseismic events to calculate the residuals. For each event, the maximum absolute value of the traveltime difference anomaly among all the station pairs (or stations) is considered as the residual for the corresponding event. The number of events for each column is shown atop the column. Plots (a) and (b) are for M1 and M2, respectively.
-
![]() Imaging results from a two-step inversion. The general velocity structures are first inverted by M2 (Figure 4). Then, the inverted velocity structures from M2 are treated as the initial model for the inversion by using M1. (a)–(d) are the horizontal slices of the inversion results at different depths. Depths is shown at the right-lower corner of each plot. (e) The synthetic input model. The numbers with circles represent the blocks of the input model. The black, blue and red lines in (a)–(d) mark the contours of blocks 1, 3, 4 of the input model, respectively. The inverted triangles in plot (e) denote seismic stations.
Imaging results from a two-step inversion. The general velocity structures are first inverted by M2 (Figure 4). Then, the inverted velocity structures from M2 are treated as the initial model for the inversion by using M1. (a)–(d) are the horizontal slices of the inversion results at different depths. Depths is shown at the right-lower corner of each plot. (e) The synthetic input model. The numbers with circles represent the blocks of the input model. The black, blue and red lines in (a)–(d) mark the contours of blocks 1, 3, 4 of the input model, respectively. The inverted triangles in plot (e) denote seismic stations.
-
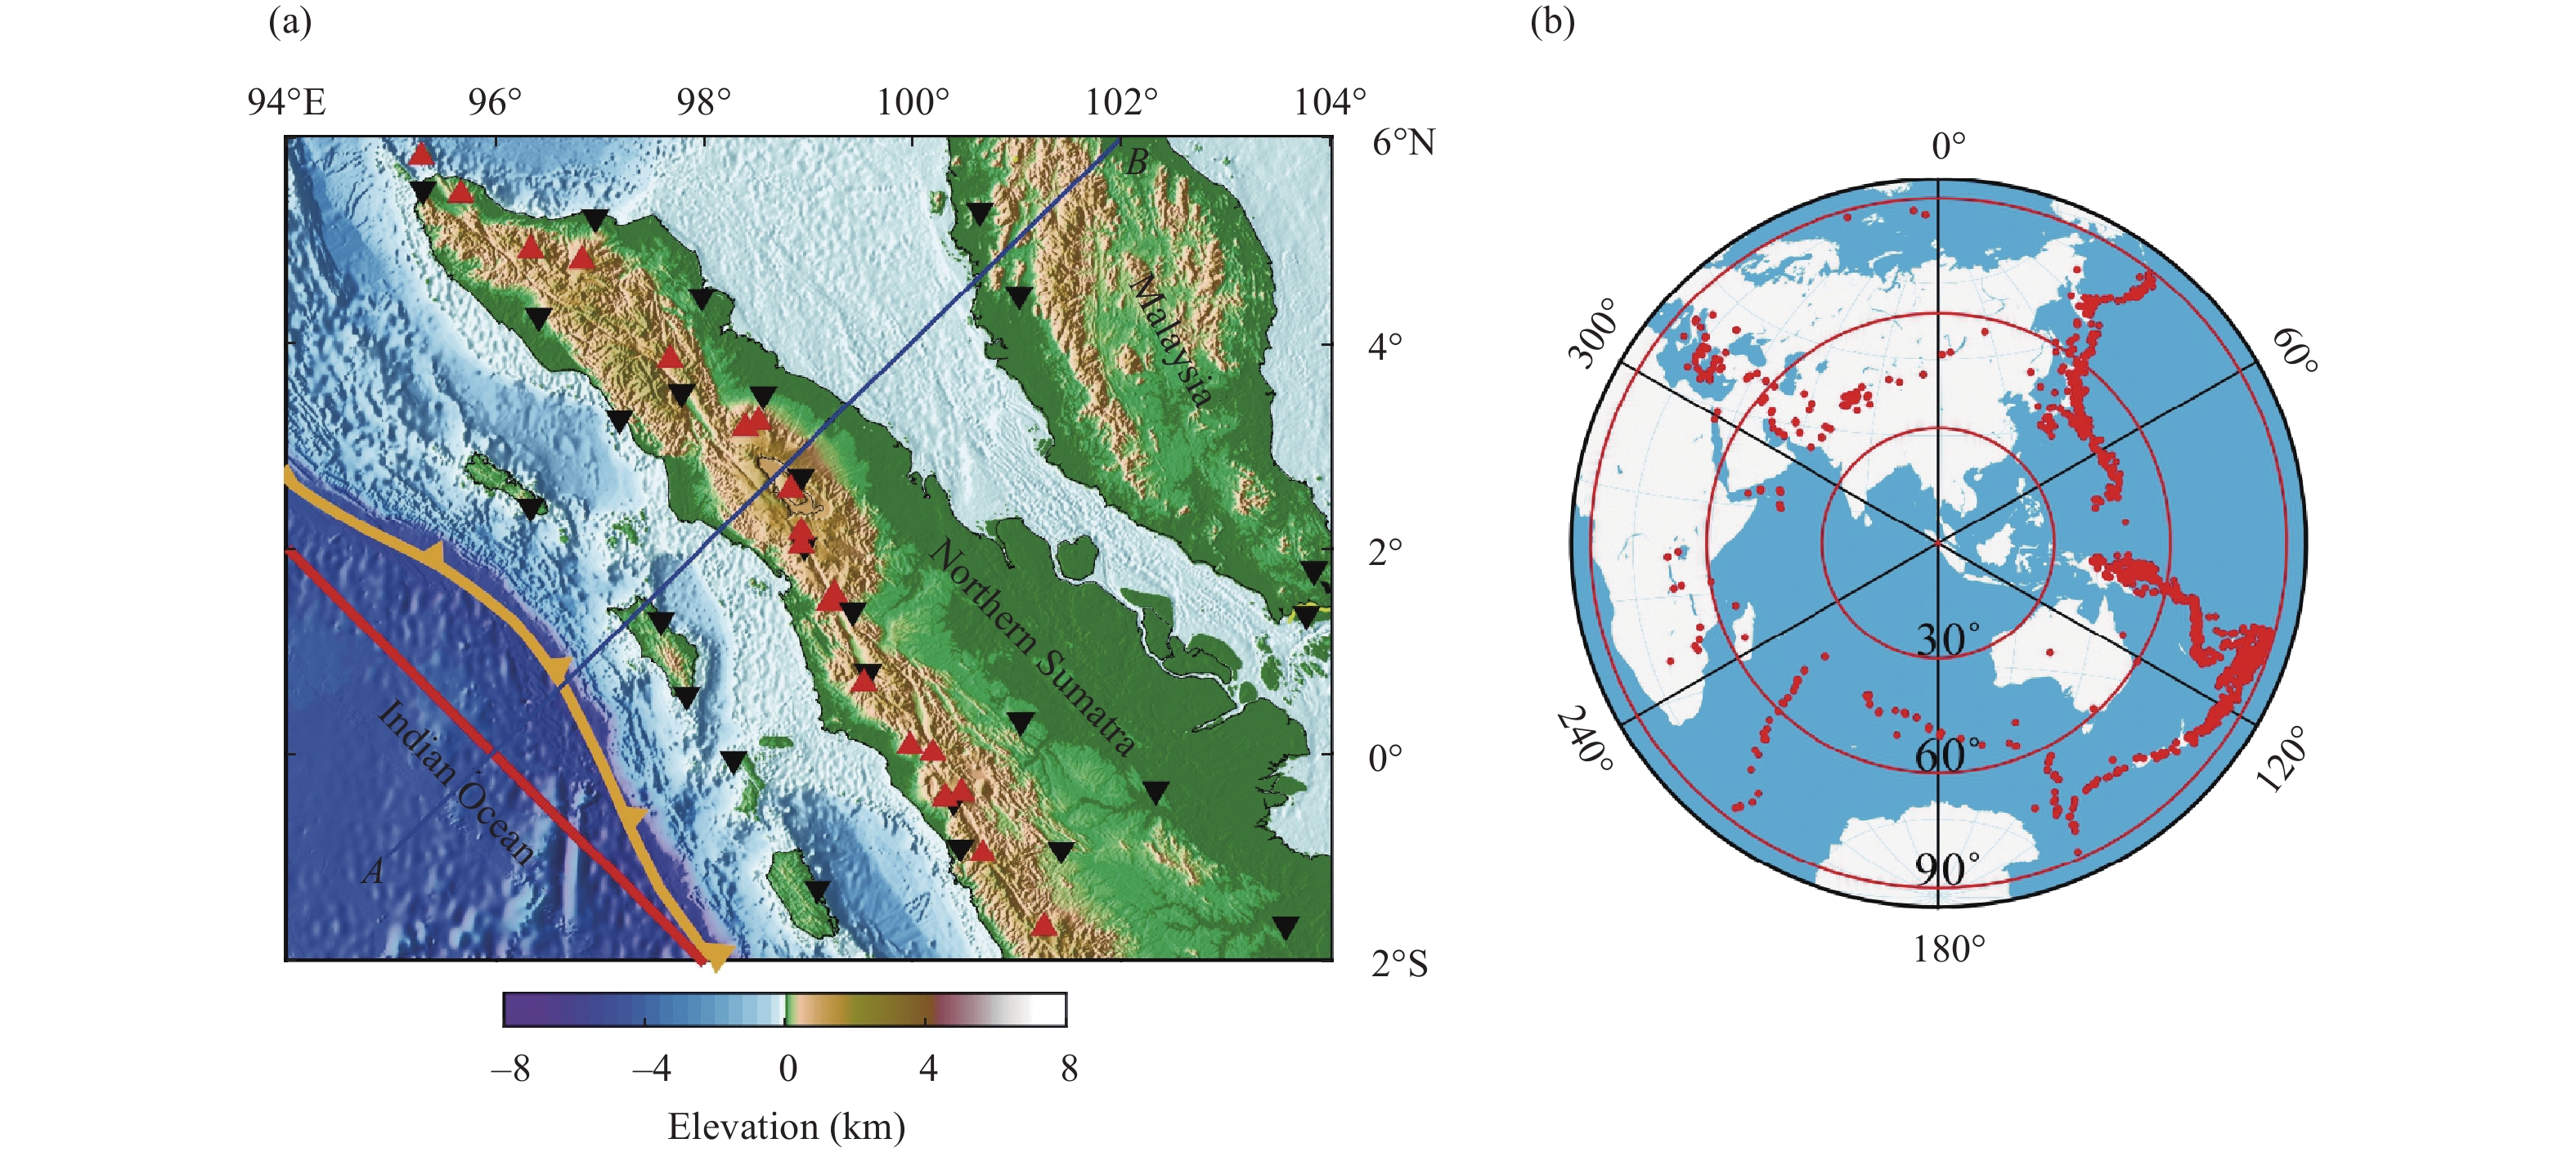
![]() (a) Stations (black inverted triangles) in northern Sumatra. (b) Teleseismic events selected for the synthetic test. The barbed orange curve denotes the Sunda Trench. The red triangles are volcanoes. The red line shows the strike of the synthetic subducted slab shown in Figures S3, S8 and S10. The line AB denotes the location of the vertical profiles in Figures S3, S8 and S10.
(a) Stations (black inverted triangles) in northern Sumatra. (b) Teleseismic events selected for the synthetic test. The barbed orange curve denotes the Sunda Trench. The red triangles are volcanoes. The red line shows the strike of the synthetic subducted slab shown in Figures S3, S8 and S10. The line AB denotes the location of the vertical profiles in Figures S3, S8 and S10.
-
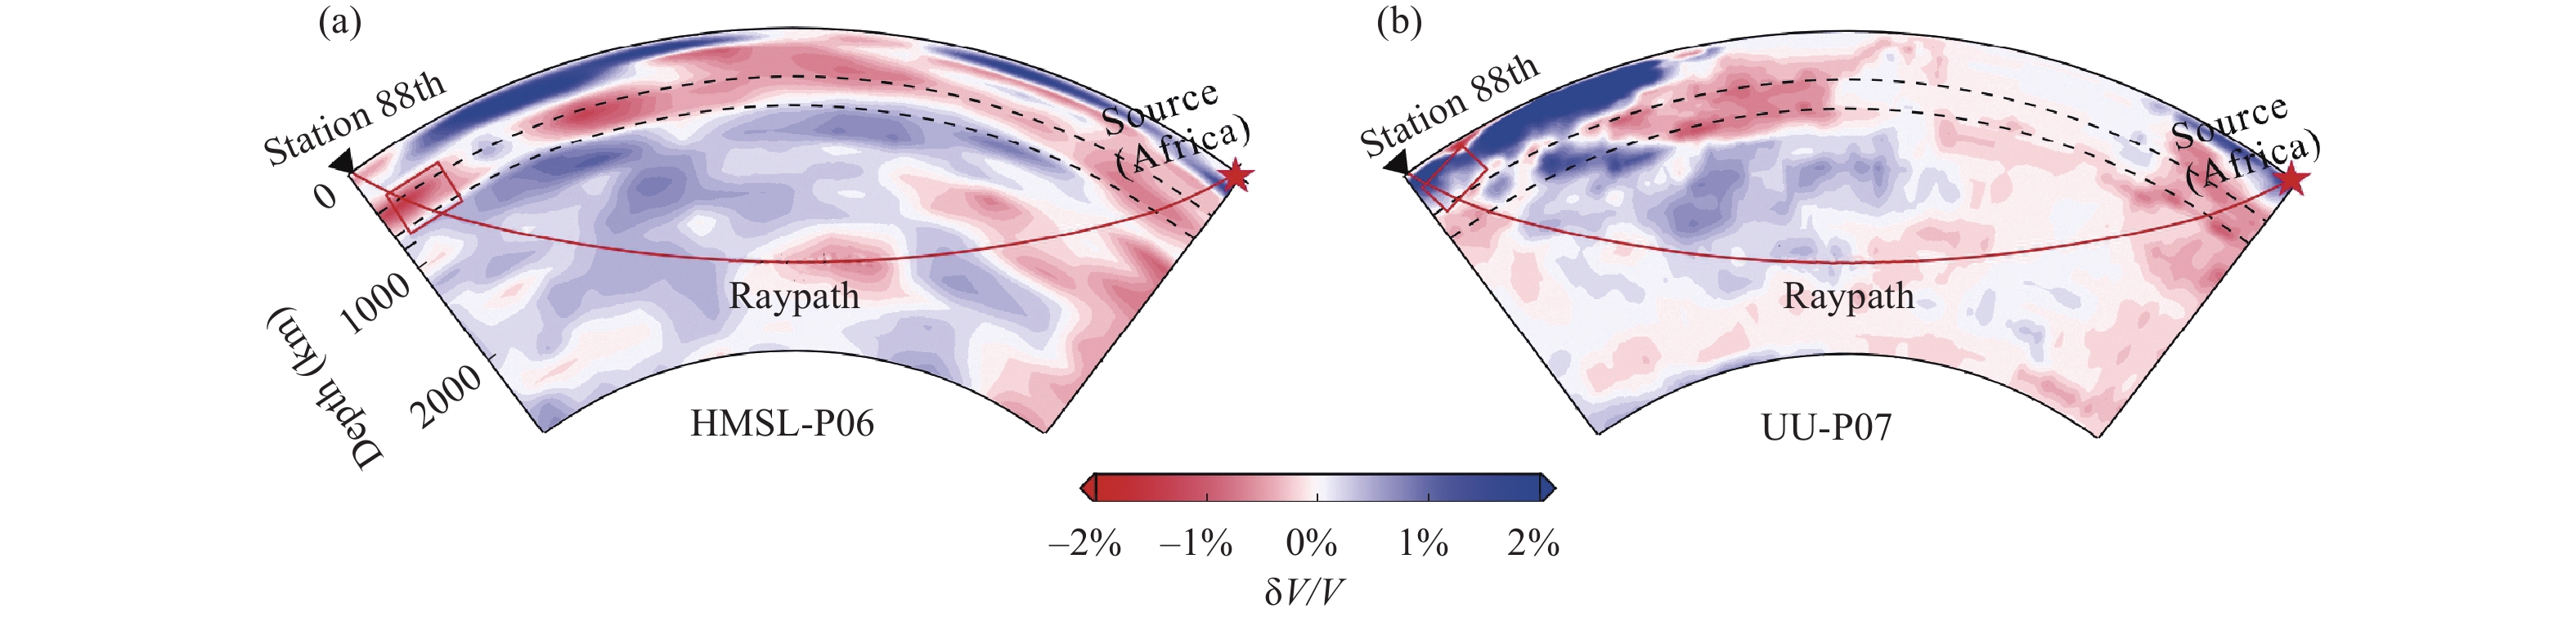
![]() Ray paths and velocity perturbations on cross sections. The red and blue colors show low- and high-velocity perturbations, respectively. The perturbation scale is shown on the bottom. The red star shows earthquake that occurred in East Africa. The red line denotes the ray from the source to the 88th station.
Ray paths and velocity perturbations on cross sections. The red and blue colors show low- and high-velocity perturbations, respectively. The perturbation scale is shown on the bottom. The red star shows earthquake that occurred in East Africa. The red line denotes the ray from the source to the 88th station.
-
![]() Results of a synthetic tomography test. (a) Result from M1. (b) Result of M2. (c) Synthetic slab model. The dashed line in (a) depicts the contour of the slab from M1. The dashed line from (a) is also added in (b) for comparison purposes. The red lines in plots (a)–(c) depict the contour of the input slab model.
Results of a synthetic tomography test. (a) Result from M1. (b) Result of M2. (c) Synthetic slab model. The dashed line in (a) depicts the contour of the slab from M1. The dashed line from (a) is also added in (b) for comparison purposes. The red lines in plots (a)–(c) depict the contour of the input slab model.
-
![]() Residual anomalies of M1 for the source in the Kuril Trench. Residual anomalies in (a)–(d) are calculated in the global models GyPSuM, TX2019slab, UU-P07, and HMSL-P06, respectively. The length of columns represents the percentage; the color of the columns denotes the residual anomaly.
Residual anomalies of M1 for the source in the Kuril Trench. Residual anomalies in (a)–(d) are calculated in the global models GyPSuM, TX2019slab, UU-P07, and HMSL-P06, respectively. The length of columns represents the percentage; the color of the columns denotes the residual anomaly.
-
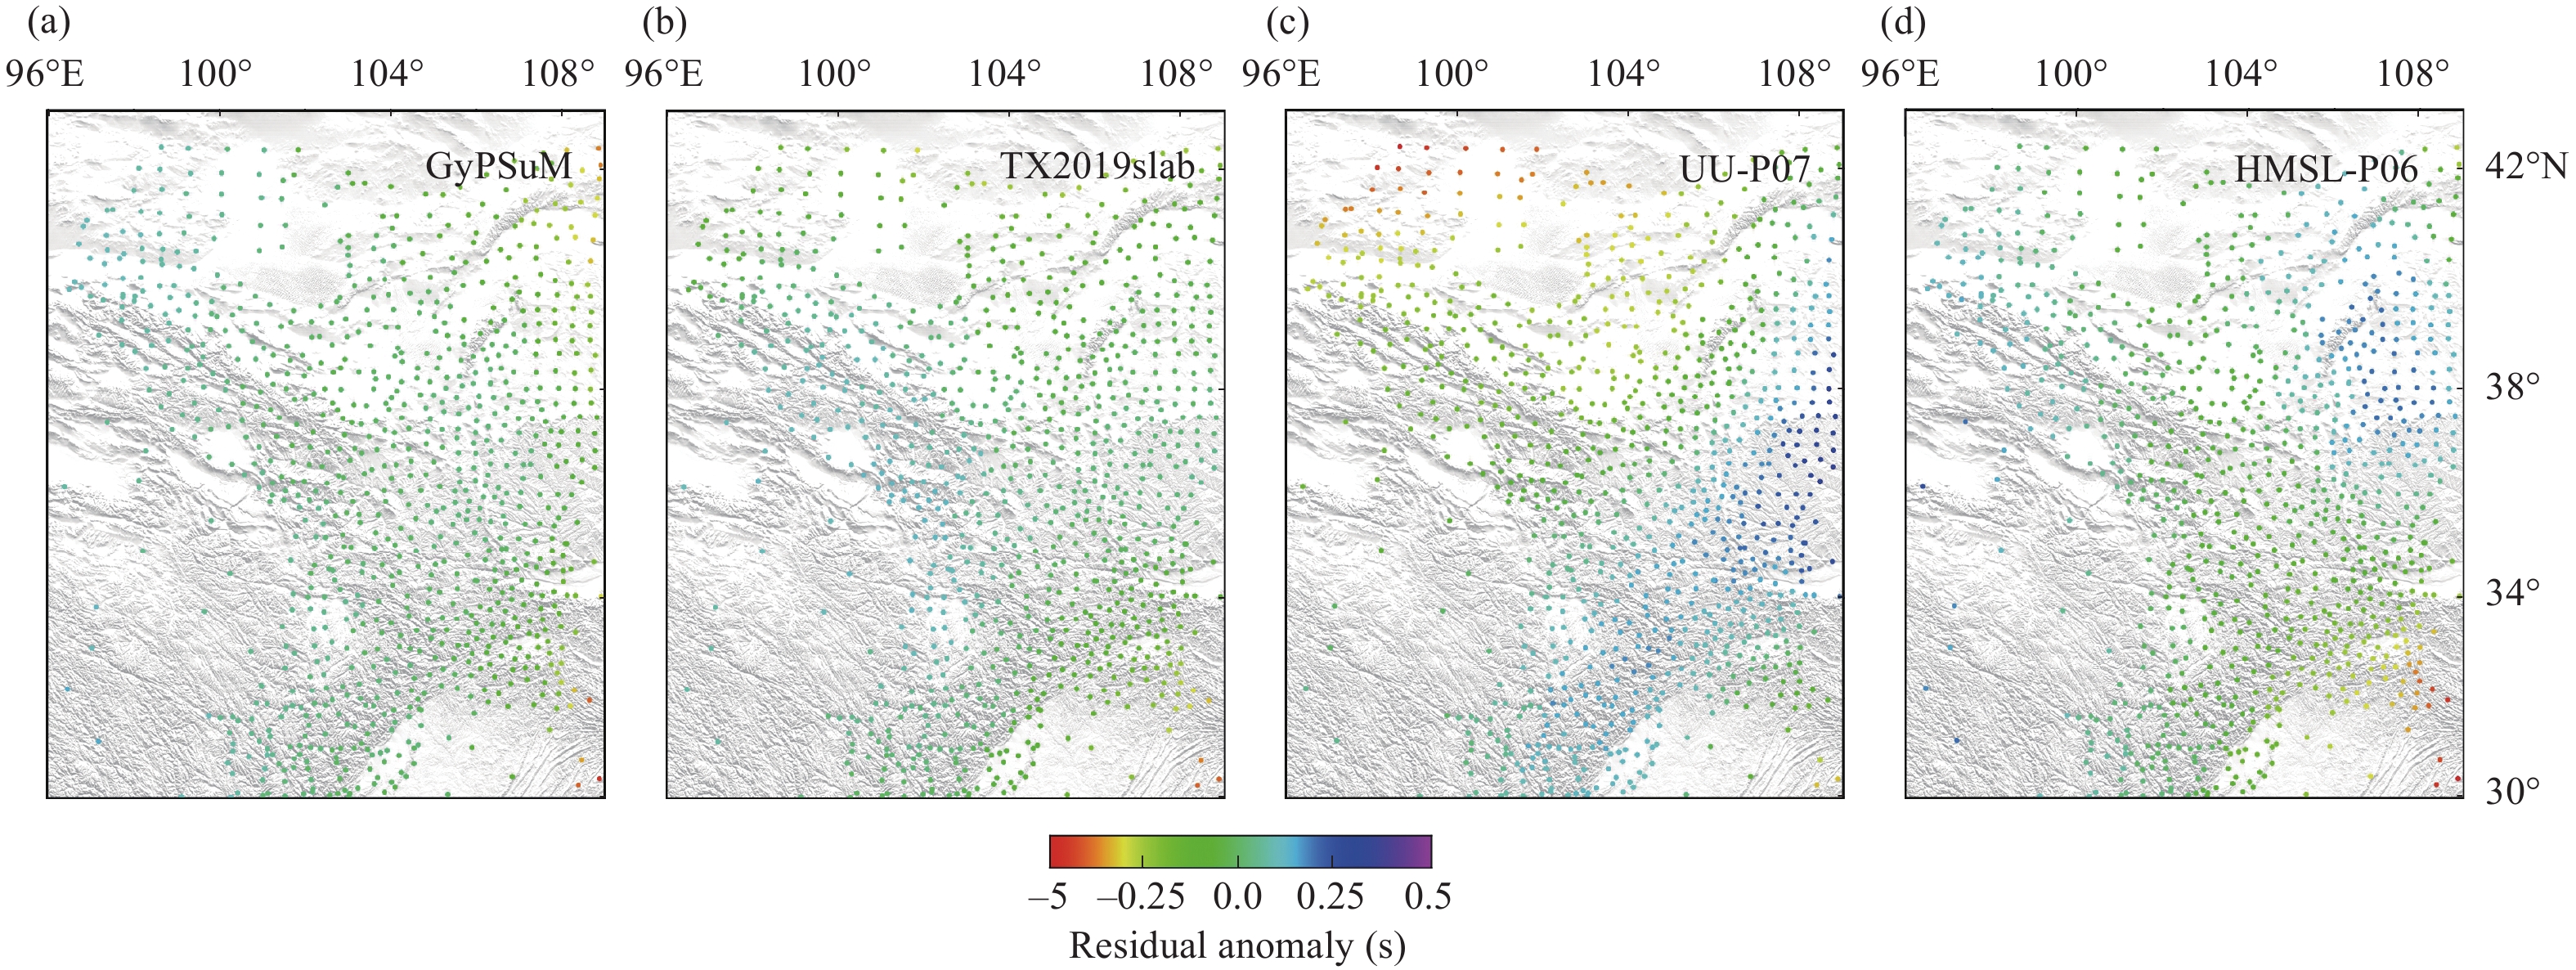
![]() Residual anomalies of M2 for the source in the Kuril Trench. Residual anomalies in (a)–(d) are calculated in the global models GyPSuM, TX2019slab, UU-P07, and HMSL-P06, respectively. The dots represent the locations of the stations shown in Figure 1. The color of the dots denotes the value of the residual anomaly.
Residual anomalies of M2 for the source in the Kuril Trench. Residual anomalies in (a)–(d) are calculated in the global models GyPSuM, TX2019slab, UU-P07, and HMSL-P06, respectively. The dots represent the locations of the stations shown in Figure 1. The color of the dots denotes the value of the residual anomaly.
-
![]() Residual anomalies of M1 for the source in Sumatra. Residual anomalies in (a)–(d) are calculated in the global models GyPSuM, TX2019slab, UU-P07, and HMSL-P06, respectively. The length of columns represents the percentage; the color of the columns denotes the residual anomaly.
Residual anomalies of M1 for the source in Sumatra. Residual anomalies in (a)–(d) are calculated in the global models GyPSuM, TX2019slab, UU-P07, and HMSL-P06, respectively. The length of columns represents the percentage; the color of the columns denotes the residual anomaly.
-
![]() Residual anomalies of M2 for the source in Sumatra. Residual anomalies in (a)–(d) are calculated in the global models GyPSuM, TX2019slab, UU-P07, and HMSL-P06, respectively. The dots represent the locations of the stations shown in Figure 1. The color of the dots denotes the value of the residual anomaly.
Residual anomalies of M2 for the source in Sumatra. Residual anomalies in (a)–(d) are calculated in the global models GyPSuM, TX2019slab, UU-P07, and HMSL-P06, respectively. The dots represent the locations of the stations shown in Figure 1. The color of the dots denotes the value of the residual anomaly.
-
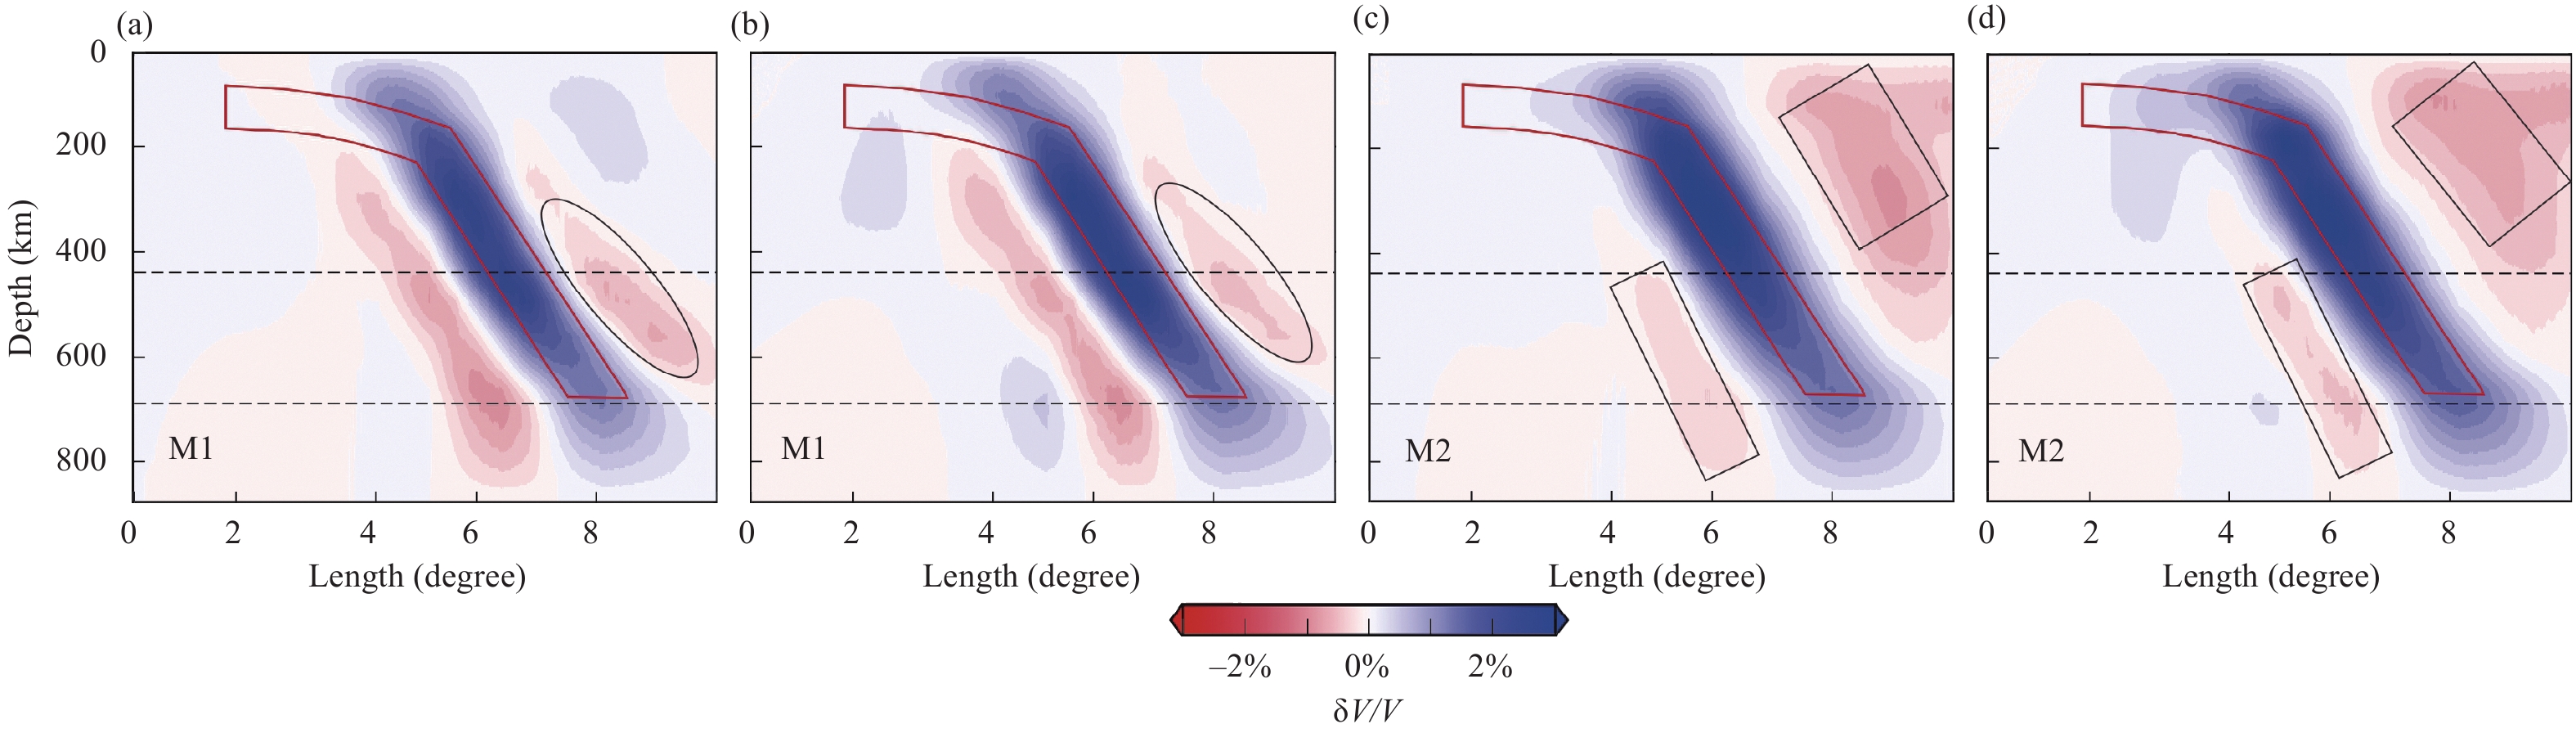
![]() Results of synthetic tomography tests for investigating the influence of global mantle heterogeneities. (a) and (b) are the imaging results from M1. (c) and (d) are the imaging results from M2. (a) and (c) are the tomographic results obtained by incorporating the influence of global mantle heterogeneities outside the imaging domain. (b) and (d) are the tomographic results obtained by removing the mantle heterogeneities outside the imaging domain. The ellipsoids and rectangles in the plots indicate artifacts. The red lines in plots (a)–(d) represent the contour of the input slab model.
Results of synthetic tomography tests for investigating the influence of global mantle heterogeneities. (a) and (b) are the imaging results from M1. (c) and (d) are the imaging results from M2. (a) and (c) are the tomographic results obtained by incorporating the influence of global mantle heterogeneities outside the imaging domain. (b) and (d) are the tomographic results obtained by removing the mantle heterogeneities outside the imaging domain. The ellipsoids and rectangles in the plots indicate artifacts. The red lines in plots (a)–(d) represent the contour of the input slab model.
-
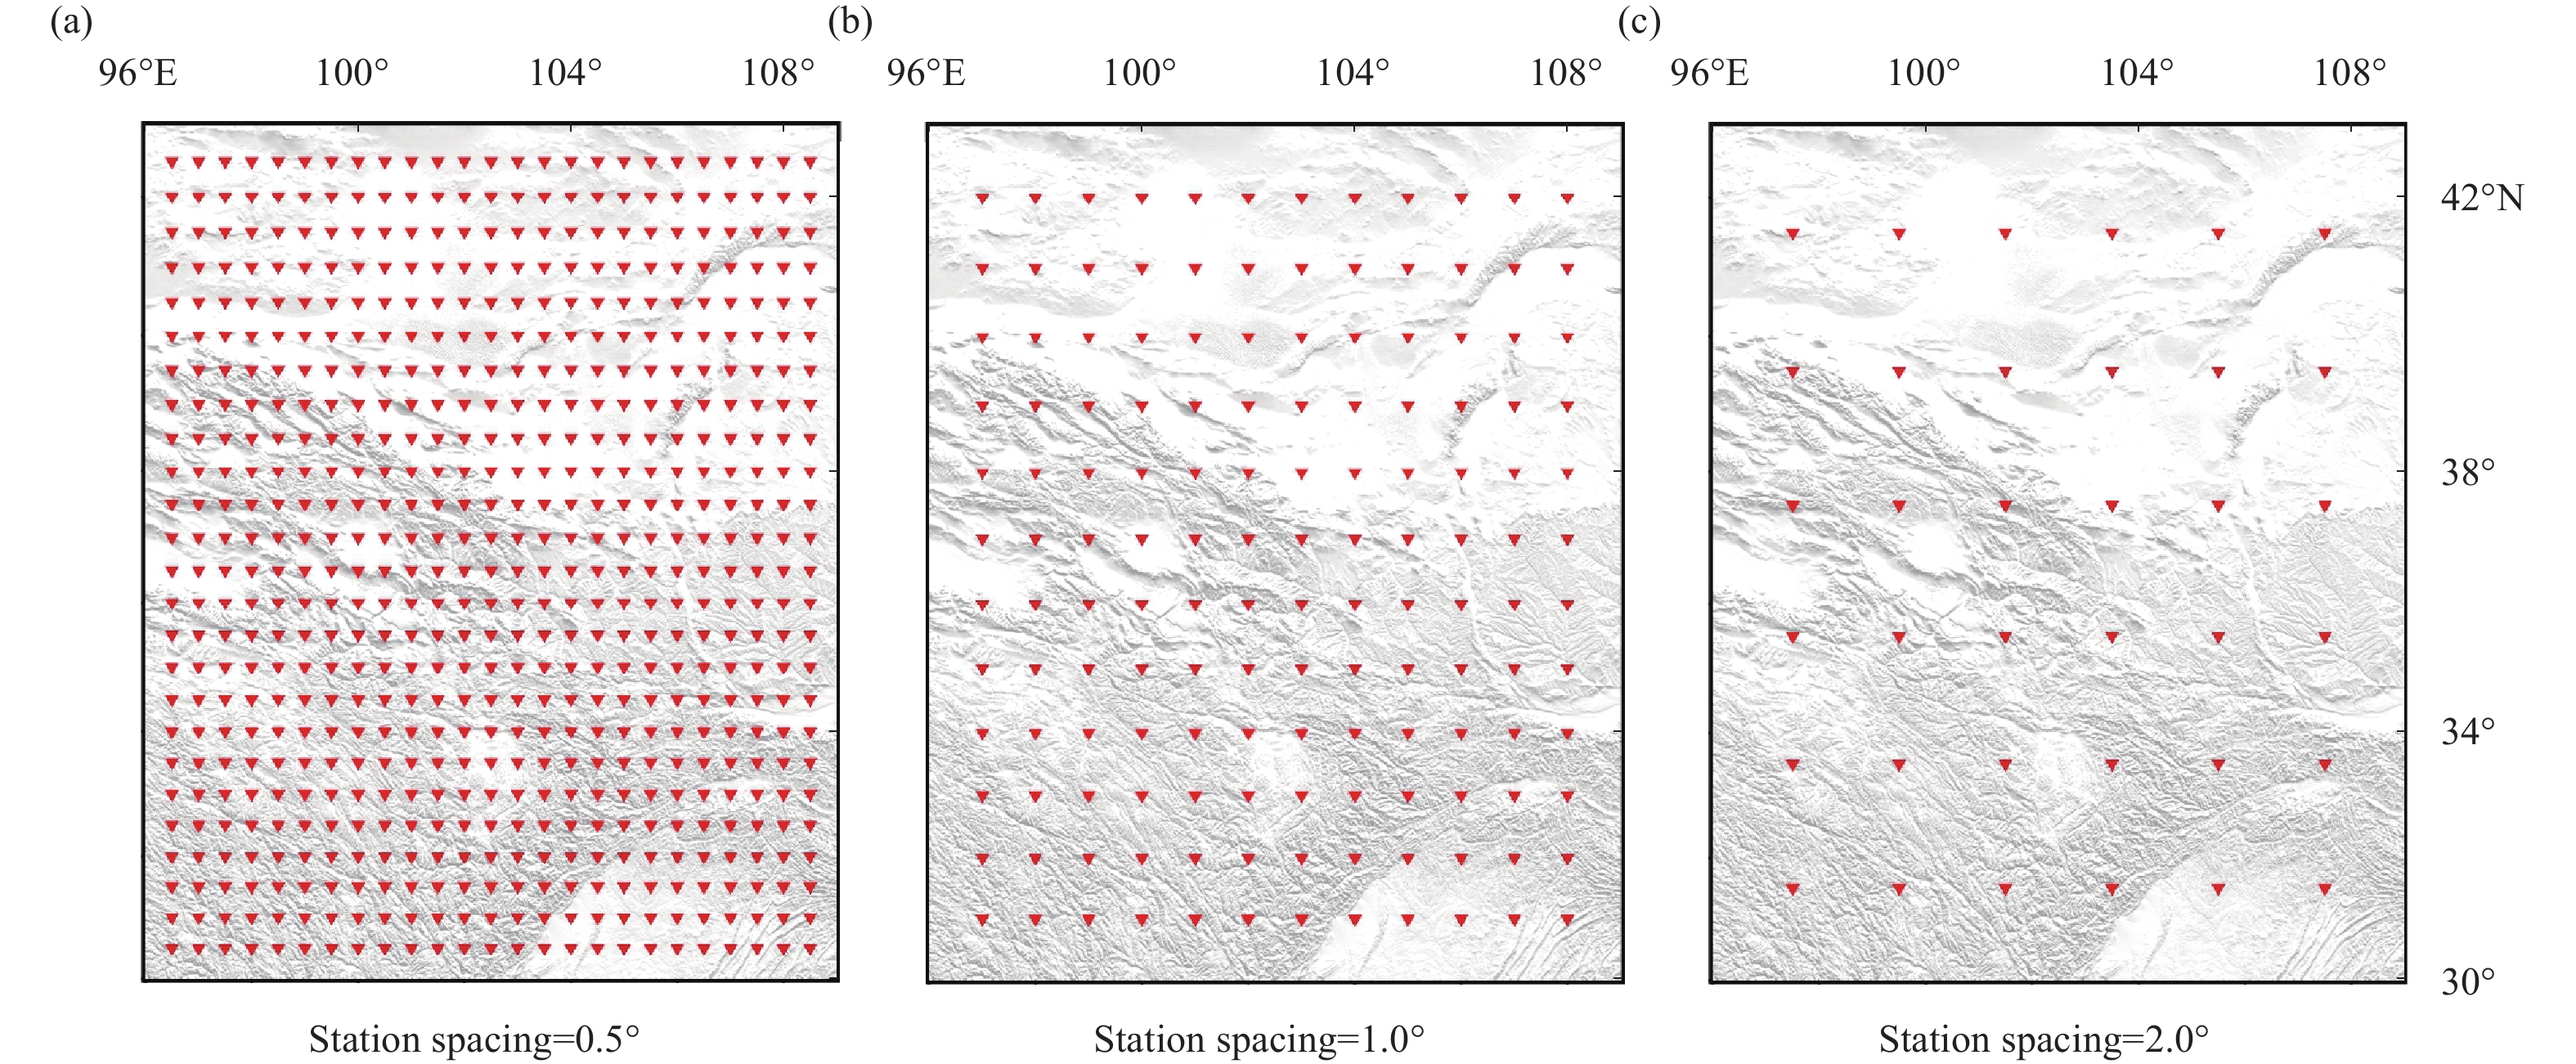
![]() Illustration of artificial station arrays with different station spacing. The red inverted triangles represent seismic stations.
Illustration of artificial station arrays with different station spacing. The red inverted triangles represent seismic stations.
-
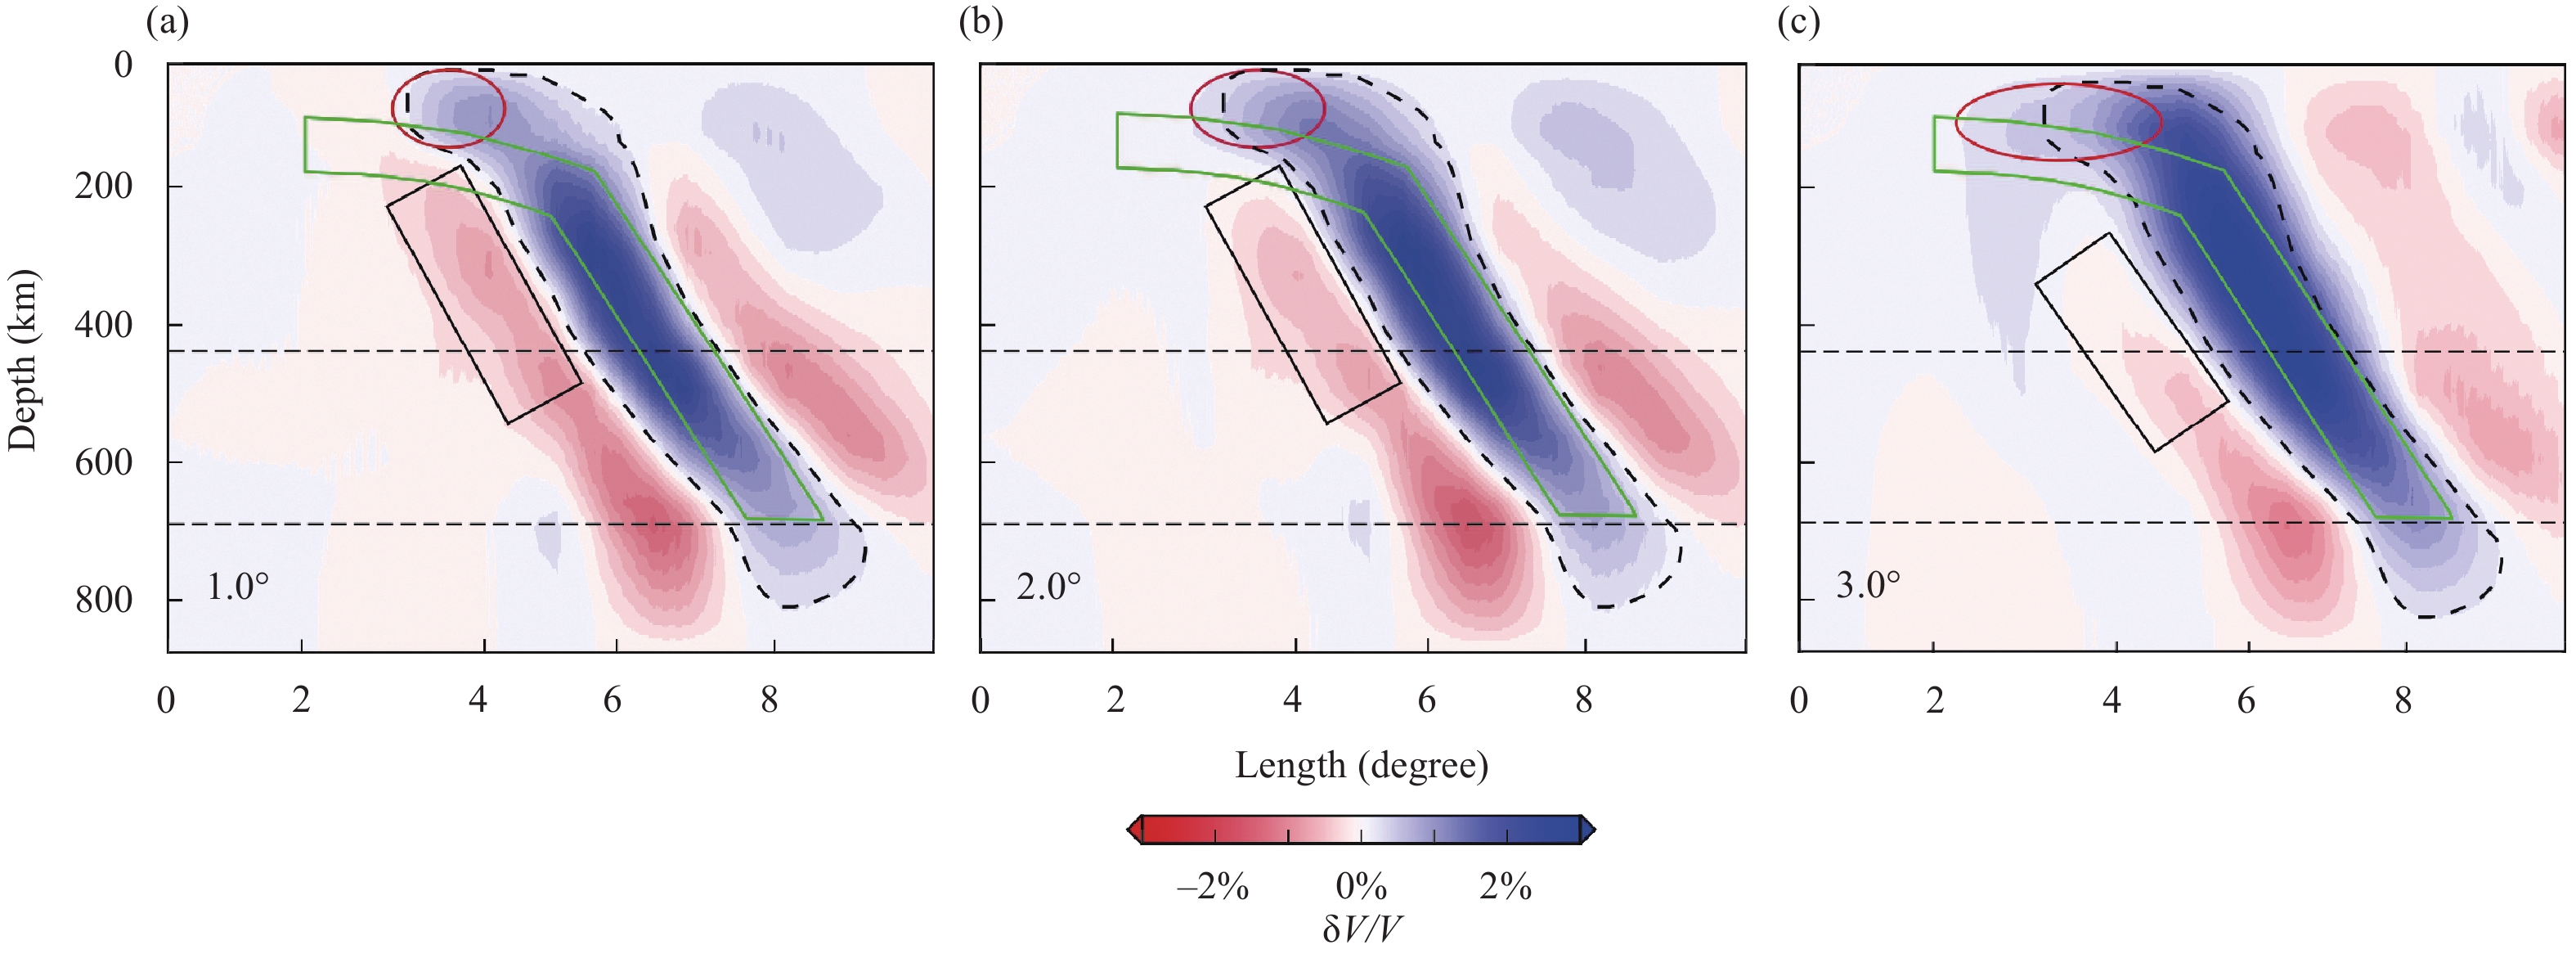
![]() Imaging results of synthetic tomography tests with different station spacings. The image results in plots (a), (b) and (c) are obtained with station spacings of 1°, 2° and 3°, respectively. The black rectangles in the plots indicate artifacts. The red ellipsoids mark the horizontal portions of the imaged slabs. The dashed lines in (a) depict the contour of the slab. The dashed line from (a) is also added in (b) and (c) for comparison purposes. The green lines represent the contour of the input slab model.
Imaging results of synthetic tomography tests with different station spacings. The image results in plots (a), (b) and (c) are obtained with station spacings of 1°, 2° and 3°, respectively. The black rectangles in the plots indicate artifacts. The red ellipsoids mark the horizontal portions of the imaged slabs. The dashed lines in (a) depict the contour of the slab. The dashed line from (a) is also added in (b) and (c) for comparison purposes. The green lines represent the contour of the input slab model.
-
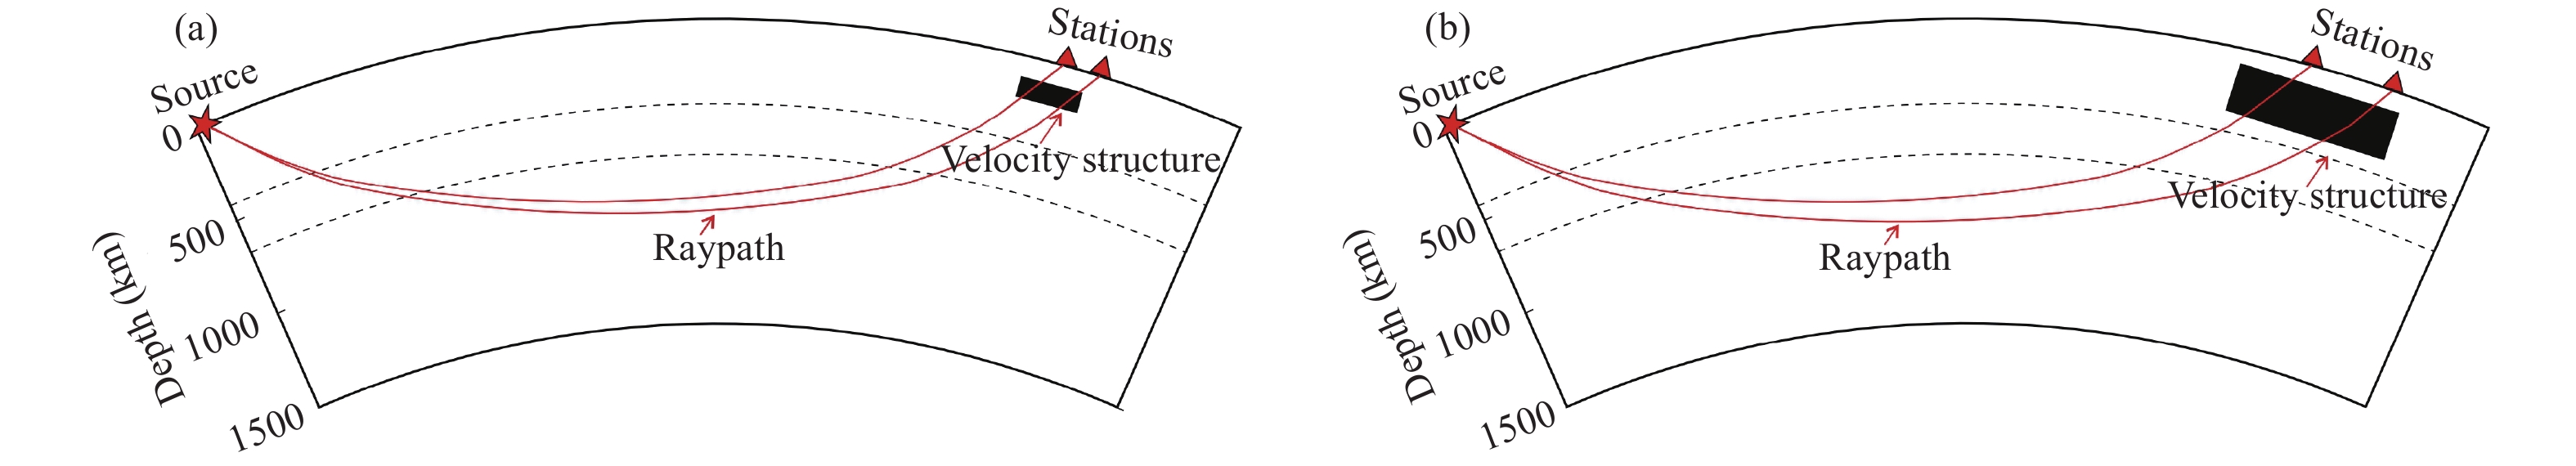
![]() Illustration of imaging resolution. (a) The raypaths for a station pair with a small distance can well sample a small subsurface structure (black rectangle). (b) The raypaths for a station pair with a large distance can well sample the relatively large structure (black rectangle).
Illustration of imaging resolution. (a) The raypaths for a station pair with a small distance can well sample a small subsurface structure (black rectangle). (b) The raypaths for a station pair with a large distance can well sample the relatively large structure (black rectangle).
-
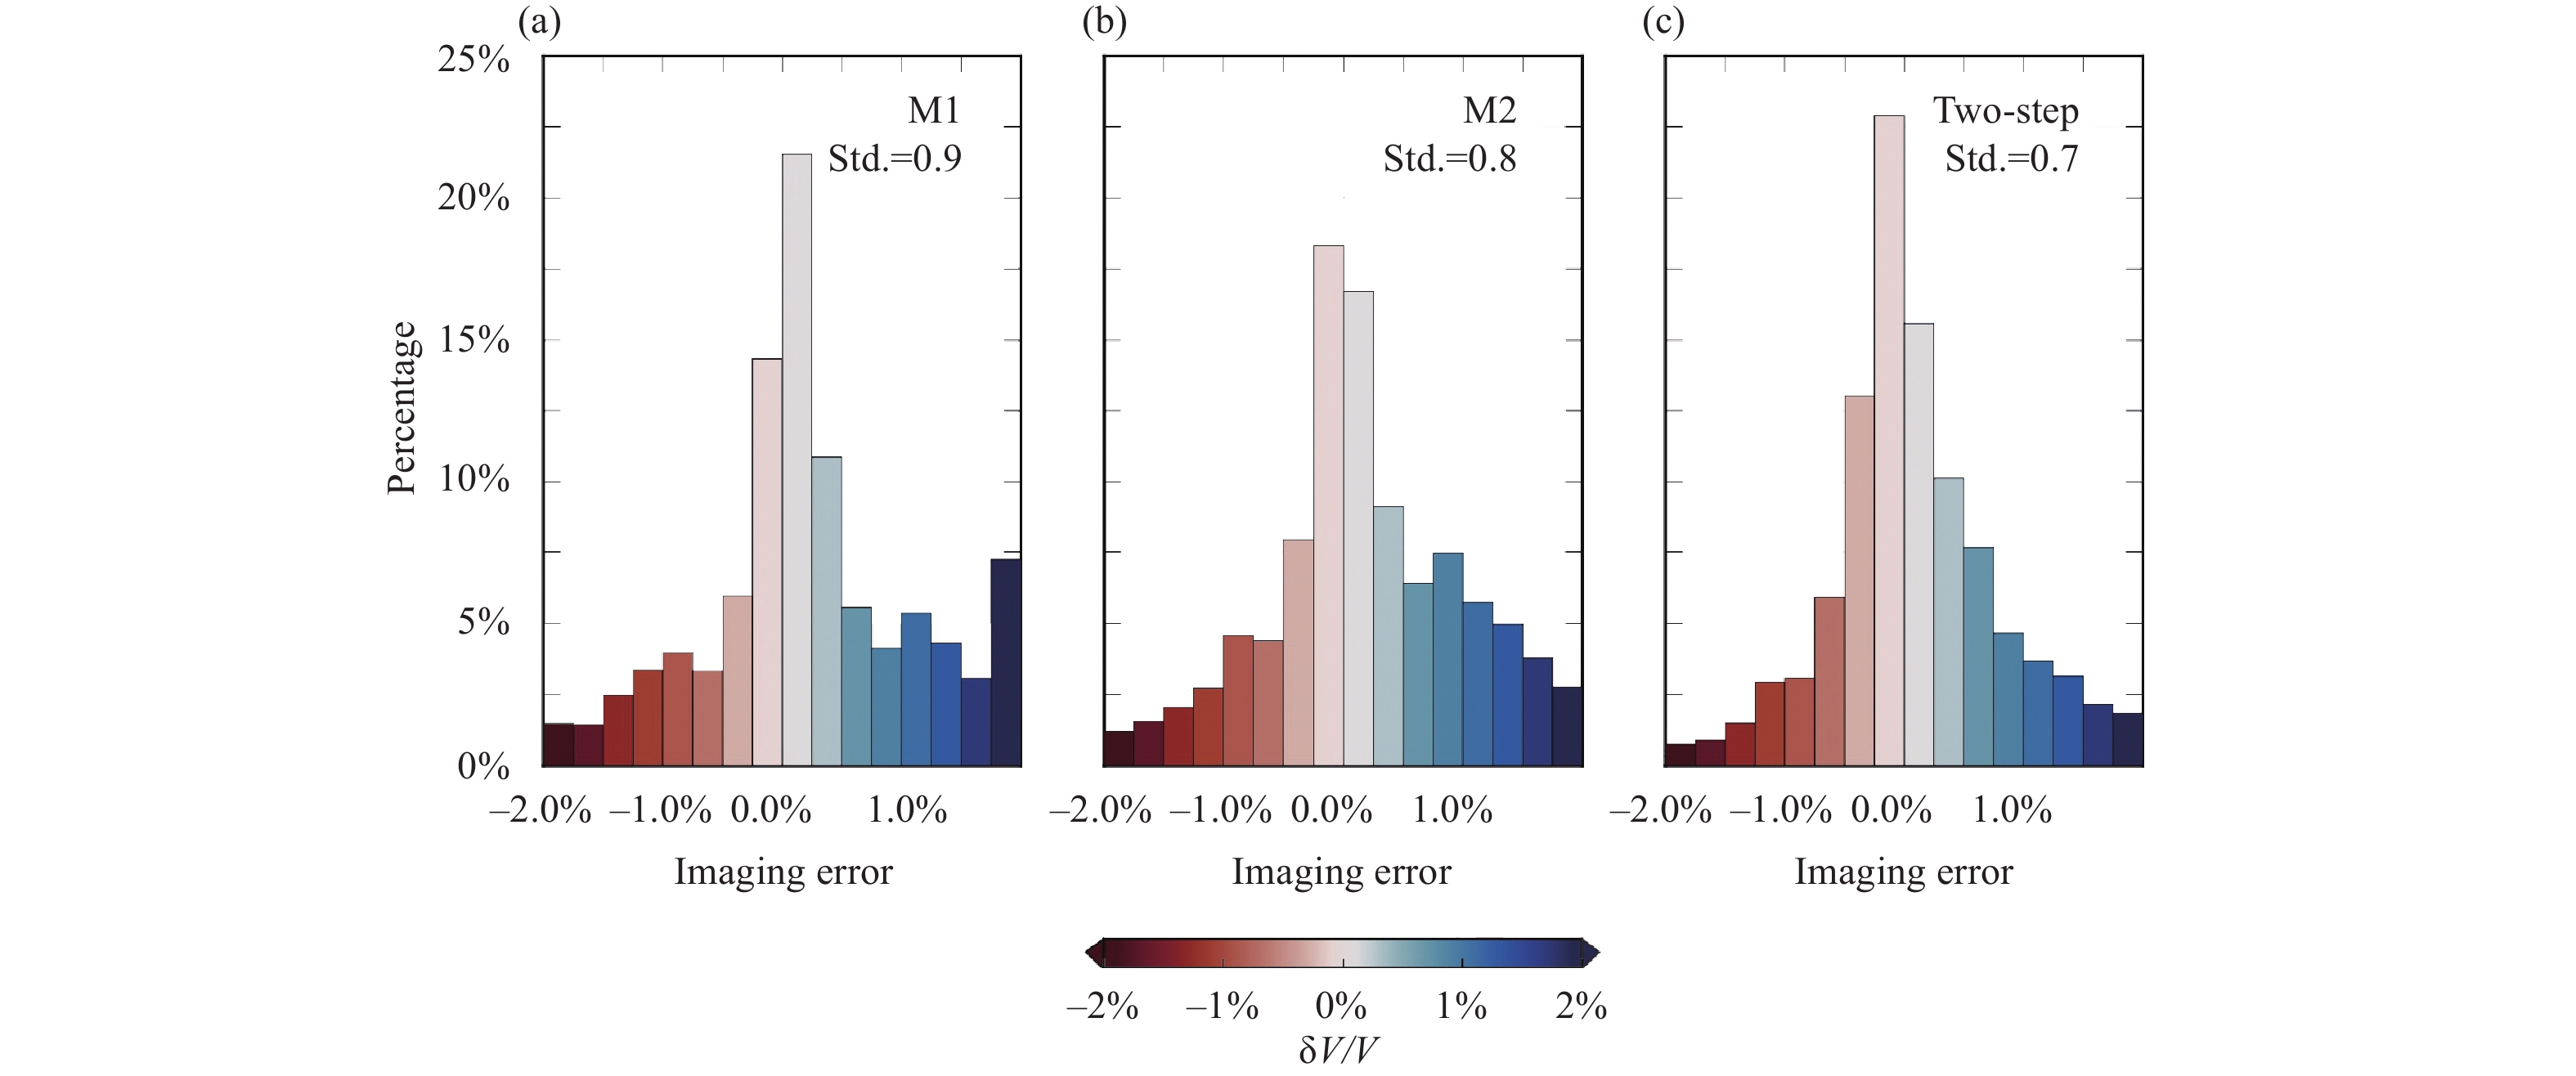
![]() Comparison of imaging errors from one- and two-step inversions. The errors are evaluated by subtracting the input model from the inverted models by using the M1 (a), M2 (b) and two-step inversion (c). Std. stands for standard deviation.
Comparison of imaging errors from one- and two-step inversions. The errors are evaluated by subtracting the input model from the inverted models by using the M1 (a), M2 (b) and two-step inversion (c). Std. stands for standard deviation.
-
![]() Influence of Gaussian noise. Plots (a) and (b) show the tomographic images from the inversion of synthetic traveltimes without noise. Plots (c)–(d), (e)–(f), (g)–(h) and (i)–(g) show the tomographic images obtained by the inversion of synthetic traveltimes containing Gaussian noise with standard deviations of 0.2 s, 0.8 s, 1.5 s and 2.0 s, respectively. The black rectangles mark the imaging differences caused by random noise.
Influence of Gaussian noise. Plots (a) and (b) show the tomographic images from the inversion of synthetic traveltimes without noise. Plots (c)–(d), (e)–(f), (g)–(h) and (i)–(g) show the tomographic images obtained by the inversion of synthetic traveltimes containing Gaussian noise with standard deviations of 0.2 s, 0.8 s, 1.5 s and 2.0 s, respectively. The black rectangles mark the imaging differences caused by random noise.
-
![]() Imaging results from the joint inversion of relative traveltime differences from M1 and M2. Plots (a)–(d) are the horizontal slices of the inversion results at different depths. Depths is shown at the right-lower corner of each plot. (e) The synthetic input model. The blue and red rectangles in (a)–(d) depict the contours of blocks 1 and 4 in the input model. The black rectangle in (b) marks the difference of imaging results between this figure and Figure 3. The inverted triangles in plot (e) denote seismic stations.
Imaging results from the joint inversion of relative traveltime differences from M1 and M2. Plots (a)–(d) are the horizontal slices of the inversion results at different depths. Depths is shown at the right-lower corner of each plot. (e) The synthetic input model. The blue and red rectangles in (a)–(d) depict the contours of blocks 1 and 4 in the input model. The black rectangle in (b) marks the difference of imaging results between this figure and Figure 3. The inverted triangles in plot (e) denote seismic stations.