Pilipenko VA, Martines-Bedenko VA, Yoshikawa A and Girgis KM (2024). Critical analysis of the ULF power depression as a possible Tohoku earthquake precursor. Earthq Sci 37(5): 407–414. DOI: 10.1016/j.eqs.2024.06.003
Citation:
Pilipenko VA, Martines-Bedenko VA, Yoshikawa A and Girgis KM (2024). Critical analysis of the ULF power depression as a possible Tohoku earthquake precursor. Earthq Sci 37(5): 407–414. DOI: 10.1016/j.eqs.2024.06.003
Pilipenko VA, Martines-Bedenko VA, Yoshikawa A and Girgis KM (2024). Critical analysis of the ULF power depression as a possible Tohoku earthquake precursor. Earthq Sci 37(5): 407–414. DOI: 10.1016/j.eqs.2024.06.003
Citation:
Pilipenko VA, Martines-Bedenko VA, Yoshikawa A and Girgis KM (2024). Critical analysis of the ULF power depression as a possible Tohoku earthquake precursor. Earthq Sci 37(5): 407–414. DOI: 10.1016/j.eqs.2024.06.003
• The effect of a nighttime geomagnetic ultra-low frequency (ULF) power depression for 0.03–0.05 Hz several days before the Tohoku 2011 earthquake was verified using extended data from all available fluxgate and search coil magnetometers.
• The depression of ULF power occurred not only near but also distant from epicenter stations and was due to low global geomagnetic activity, as evidenced by the SME index.
• The depression of ULF power cannot be considered a reliable short-term earthquake precursor.
Abstract
Among electromagnetic methods of short-term earthquake prediction, an approach is being actively developed based on the phenomenon of magnetic ultra-low-frequency (ULF) power depression occurring a few days before an earthquake. In particular, a nighttime geomagnetic power depression in the band 0.03–0.05 Hz was observed approximately 5 days before the catastrophic Tohoku 2011 earthquake. To verify the reliability of this method, we performed an extended analysis using data from magnetometer arrays JMA, MAGDAS, PWING, and INTERMAGNET. The selected stations included sites close to the epicenter (<300 km) and remote points (~10000 km). The band-integrated spectral power of nighttime magnetic noise decreased significantly from March 6–9, several days before the earthquake. However, such variations occur simultaneously not only at nearby stations but also at distant stations. During this event, the ULF power depression was caused by low global geomagnetic activity, as evidenced by the planetary index SME. Thus, the depression of geomagnetic ULF noise cannot be considered a reliable short-term precursor.
An "eternal" problem in modern geophysics is the feasibility of short-term earthquake predictions. In addition to traditional seismic methods, anomalies of other geophysical fields are suggested to behave as precursors during the final phase of seismic event preparation including ground fluid level, gas release, acoustic noise, and meteorological and ionospheric parameters. Particular attention has been given to the search for anomalous electromagnetic phenomena. Most research has focused on detecting the ultra-low-frequency (ULF) emissions caused by mechano-electromagnetic transducers in the crust (Bleier et al., 2009; Petraki et al., 2015; Yao XY et al., 2022; Chowdhury et al., 2022). The polarization of anomalous ULF radiation may be promising for locating the epicenters of future earthquakes (Schekotov et al., 2008).
If this geomagnetic ULF depression is associated with the processes of seismic event preparation, then the same effect should be absent in observatories remote from the epicenter. To test this assumption, we used data from a network of search-coil (SC) and fluxgate (FG) magnetometers in the Far East. For verification, we chose the M9.0 Tohoku mega-earthquake on March 11, 2011. For this earthquake, a ULF power depression was identified and claimed as a precursor (Ohta et al., 2013; Hayakawa et al., 2015; Contoyiannis et al., 2016; Potirakis et al., 2017).
2.
Data and analysis
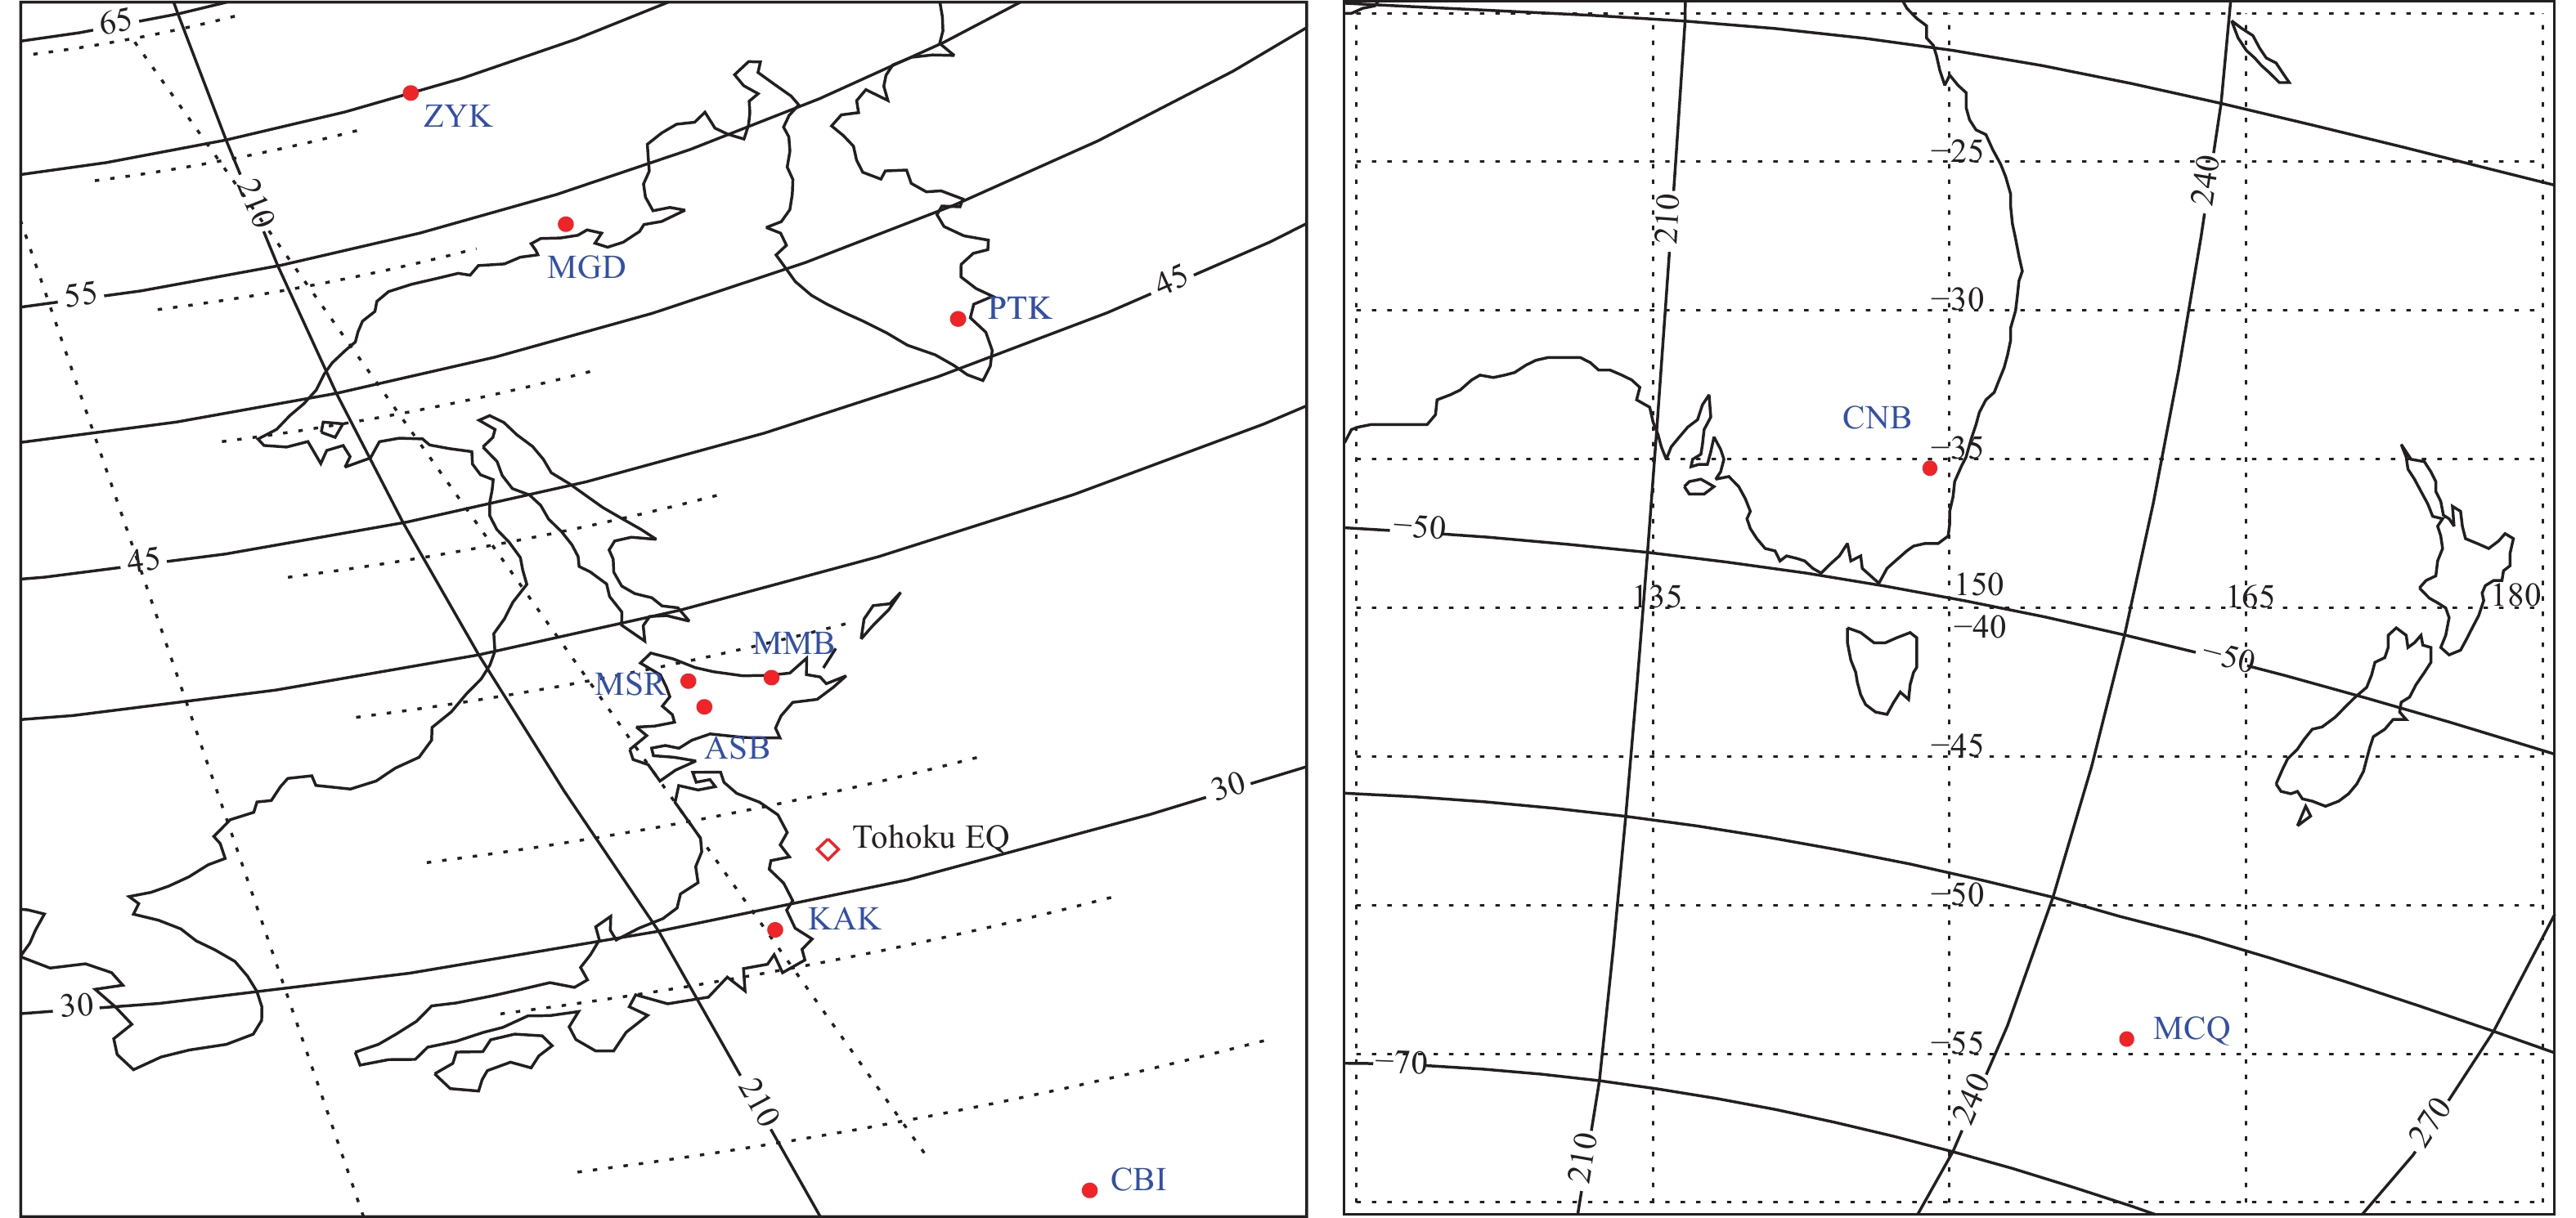
We compiled data from all available magnetic stations equipped with FG or SC magnetometers extending along the 210 magnetic meridians, consisting of Japan, Kamchatka, Eastern Russia, Australia, and Antarctica. The geographical coordinates of the stations and their distances from the earthquake epicenter are listed in Table 1. Figure 1 shows a map of the locations of the stations and epicenter of the earthquake in the Northern (left-hand panel) and Southern (right-hand panel) hemispheres. We compiled data from the following arrays (see Table 1):
Figure
1.
Map of the Far East region. The positions of the magnetic stations (red dots) and the epicenter of the March 11, 2011, earthquake (red diamond) are shown for the Northern Hemisphere in the left-hand panel and for the Southern Hemisphere in the right-hand panel. Solid lines denote geomagnetic coordinates, and dotted lines show geographic coordinates.
1) 1-Hz FG magnetic observatories from the Japan Meteorological Agency (JMA). The same data were used by Hayakawa et al. (2015);
2) 1-Hz FG magnetometer data from the Magnetic Data Acquisition System (MAGDAS) array. This array was deployed by Kyushu University in collaboration with approximately 30 international organizations along the 210° magnetic meridians and equator (Yumoto et al., 2006);
3) 64-Hz SC magnetometers from the PWING (Study of Dynamical Variation of Particles and Waves in the Inner Magnetosphere Using Ground-Based Network Observations) project (Shiokawa et al., 2017). SC magnetometers have a sampling frequency of 64 Hz, but different sensitivities;
4) 1-Hz FG magnetometers in the Southern Hemisphere from the INTERMAGNET array.
The vertical component (z) of most magnetometers is noisy; therefore, it was not analyzed. Only horizontal components were considered. Magnetospheric pulsations in the frequency band under consideration, such as dayside Pc3 or nighttime Pi2, are most pronounced in the north-south (x) component; therefore, the east-west (y) component is less influenced by magnetospheric waves and noise, as in previous studies (e.g., Hayakawa et al., 2013a, b; 2015). The frequency response of the SC magnetometer was linear (~dB/dt) to frequencies of ~1–5 Hz. FG magnetometers have a flat frequency response; therefore, their data are pre-whitened, i.e., time-differentiated.
We applied the same data analysis technique as in Hayakawa et al. (2013a, b). We considered only night periods: LT=1–5 AM (UT=LT–9) from 16 to 20 UT. During these night-time hours, the influence of industrial interference was minimal. However, sporadic transients such as magnetospheric Pi2 pulsations may occur during auroral activation.
The ULF power variations were further analyzed in the frequency interval 0.03–0.05 Hz. In a running 1-hour time window, the band-integrated power of the ULF variations, Wy, was calculated for the horizontal y component. Because the absolute values of the geomagnetic disturbances were not important in this consideration, the ULF power variations at each station were normalized to their maximal values.
Depression parameter S=1/Wy, which is the inverse power of the horizontal magnetic field component, was introduced (Hayakawa et al., 2012, 2013a, b; Schekotov et al., 2013) to highlight the possible depression of the ULF wave power. Special attention was given to the significant and conspicuous peak of S on March 6, which was common to all JMA observatories. The maximal depression was observed at station KAK, which was closest to the epicenter of the earthquake. This enhancement of parameter S was suggested as a precursor to the Tohoku earthquake.
Table
1.
Far East magnetic stations
Station
Code
Lat.
Long.
Type
R (km)
Agency
Memambetsu
MMB
43.91°N
144.18°E
FG-1Hz
642
JMA
Kakioka
KAK
36.23°N
140.18°E
FG-1Hz
303
JMA
Chichijima
CBI
27.15 °N
142.30°E
FG-1Hz
1245
JMA
Magadan
MGD
60.05°N
150.73°E
SC-64Hz FG-1Hz
2482
PWING MAGDAS
Paratunka
PTK
52.97°N
158.25°E
SC-64Hz FG-1s
2034
PWING MAGDAS
Moshiri
MSR
44.37°N
142.27°E
SC-64Hz
676
PWING
Zyryanka
ZYK
65.70°N
150.78°E
FG-1Hz
3076
MAGDAS
Ashibetu
ASB
43.46°N
142.17°E
FG-1Hz
574
MAGDAS
Macquarie Islands
MCQ
54.50°S
158.95°E
FG-1Hz
9354
INTERMAGNET
Canberra
CNB
35.32°S
149.36
FG-1Hz
7696
INTERMAGNET
Note: The earthquake location is at 142.37°E, 38.32°N.
3.
Nighttime ULF power variations before the Tohoku earthquake
This catastrophic earthquake occurred on March 11, 2011, at 05:46:18 UT and a depth of ~20 km. Several anomalous geophysical phenomena were observed several days before the mainshock, including a rapid increase in emitted infrared radiation from the region near the epicenter, an increase in total electron content derived from global positioning system (GPS) data, growth of electron concentration recorded by ground-based ionosondes, and tectonomagnetic variations (Ouzounov et al., 2011; Takla et al., 2013).
The search for anomalies in the ULF emissions before this earthquake was performed using mid-latitude magnetic observatories near the epicenter. Thus, the ULF power depression was observed. Here, we examined not only mid-latitude stations but also the ULF activity along a wide array of stations, including those at sub-auroral latitudes. For the interstation analysis, we selected the period from March 02 to March 12. On March 01, a moderate geomagnetic storm occurred that obscured any other possible effects.
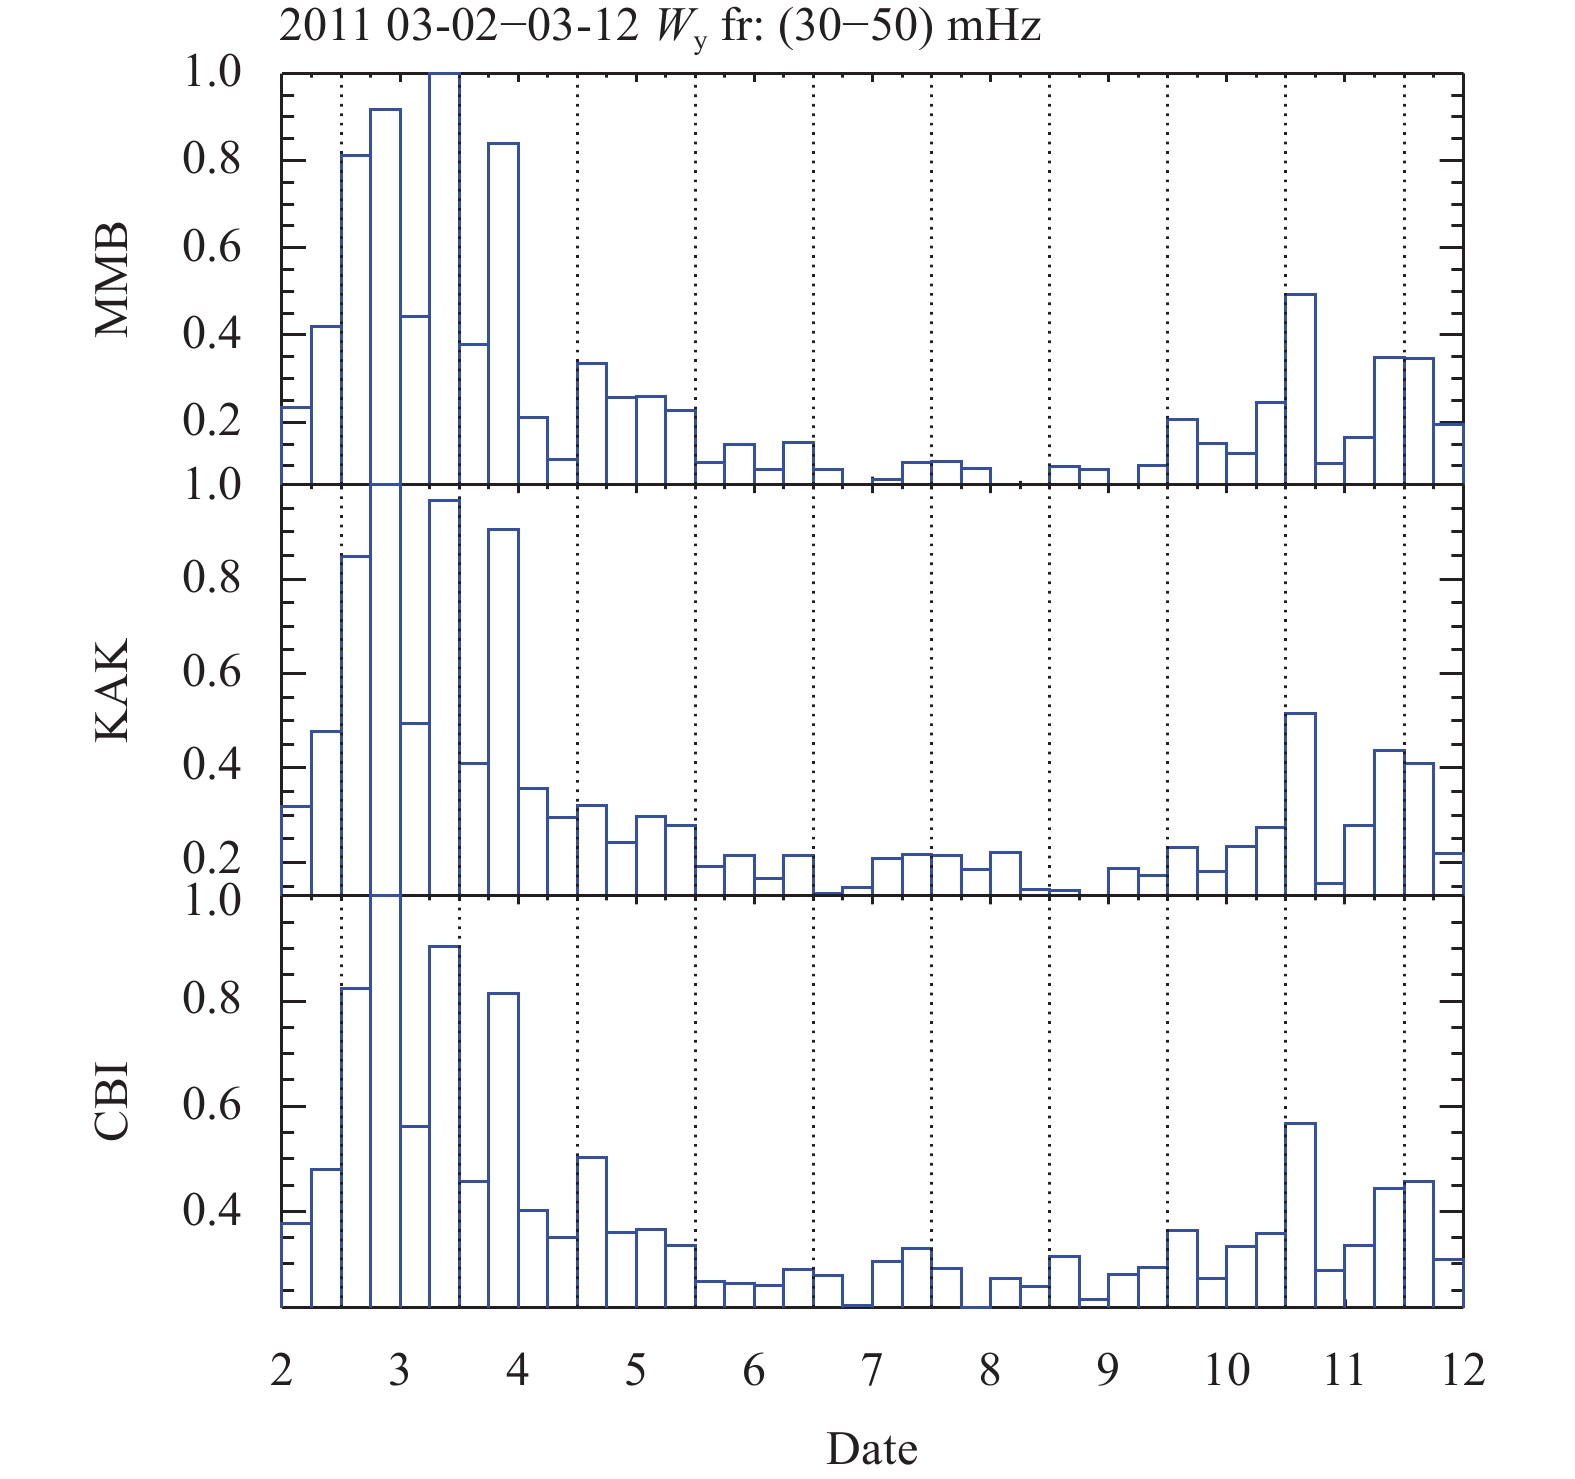
First, we analyzed the Wy variations along the JMA profile at stations MMB, KAK, and CBI (Figure 2). At all stations, a significant depression in the ULF power was observed on March 6–9. Hayakawa et al. (2013a, b; 2015) claimed that this depression was a precursor to the Tohoku earthquake.
Figure
2.
Variations in ULF power along JMA array at stations MMB, KAK, and CBI. The normalized variations in the hourly band-integrated (30–50 mHz) spectral power Wy during the night hours from 03-02–03-12 before the Tohoku earthquake are shown. The vertical dotted lines indicate the boundaries between the nighttime intervals.
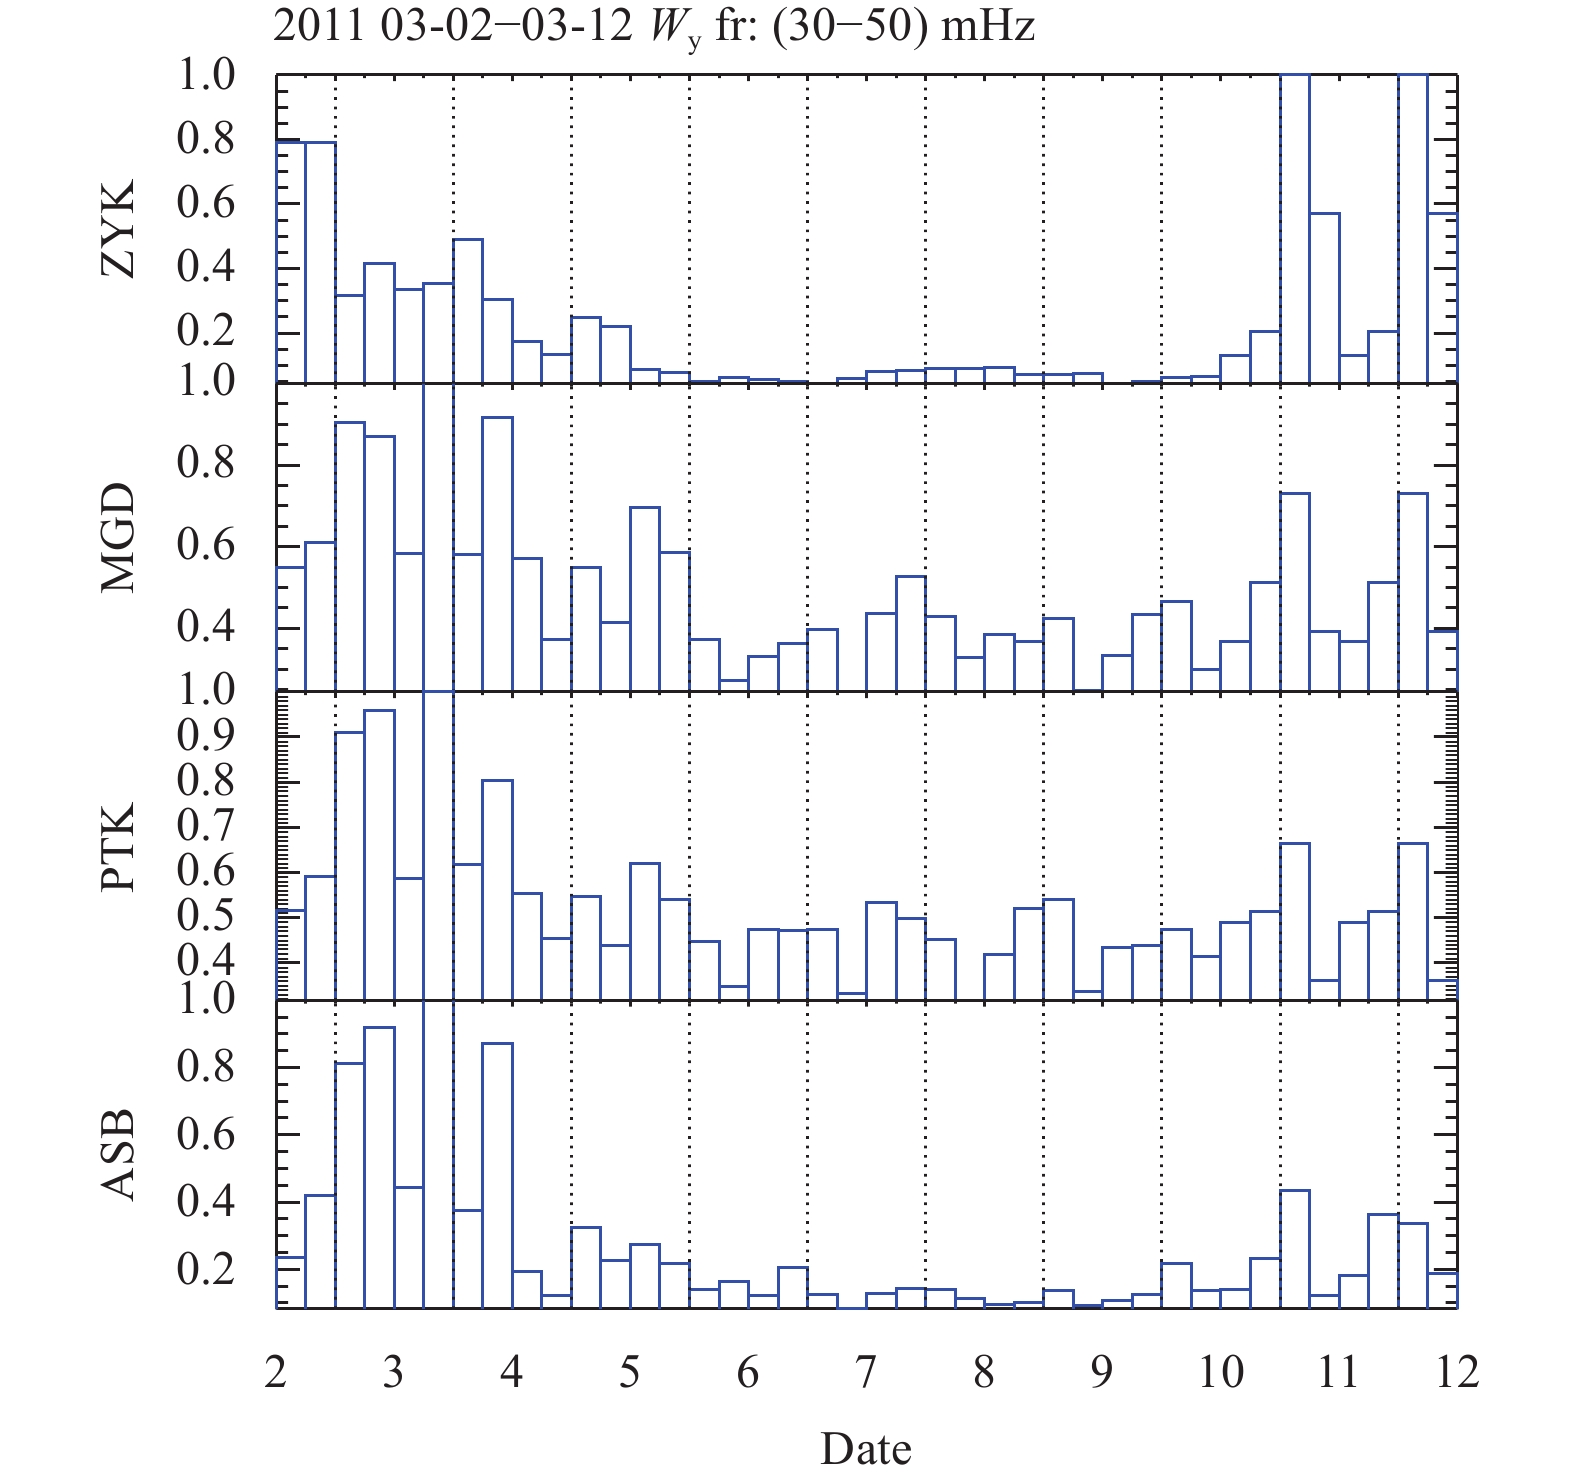
We then applied the same technique to distant stations from the MAGDAS array, ZYK, MGD, PTK, and ASB (Figure 3). This profile goes to sub-auroral latitudes, i.e., geomagnetic latitude ~60o (ZYK). The northern site of this profile is separated from the epicenter by ~3 × 10³ km (Table 1). Nonetheless, all these stations also demonstrated a ULF power depression on the same nights, March 6–9.
Figure
3.
Variations in ULF power along MAGDAS array at stations ZYK, MGD, PTK and ASB. The normalized variations of the band-integrated (30–50 mHz) spectral power Wy during the night 4-hours interval from March 2–12, 2011 are shown. The vertical dotted lines indicate the boundaries between the nighttime intervals.
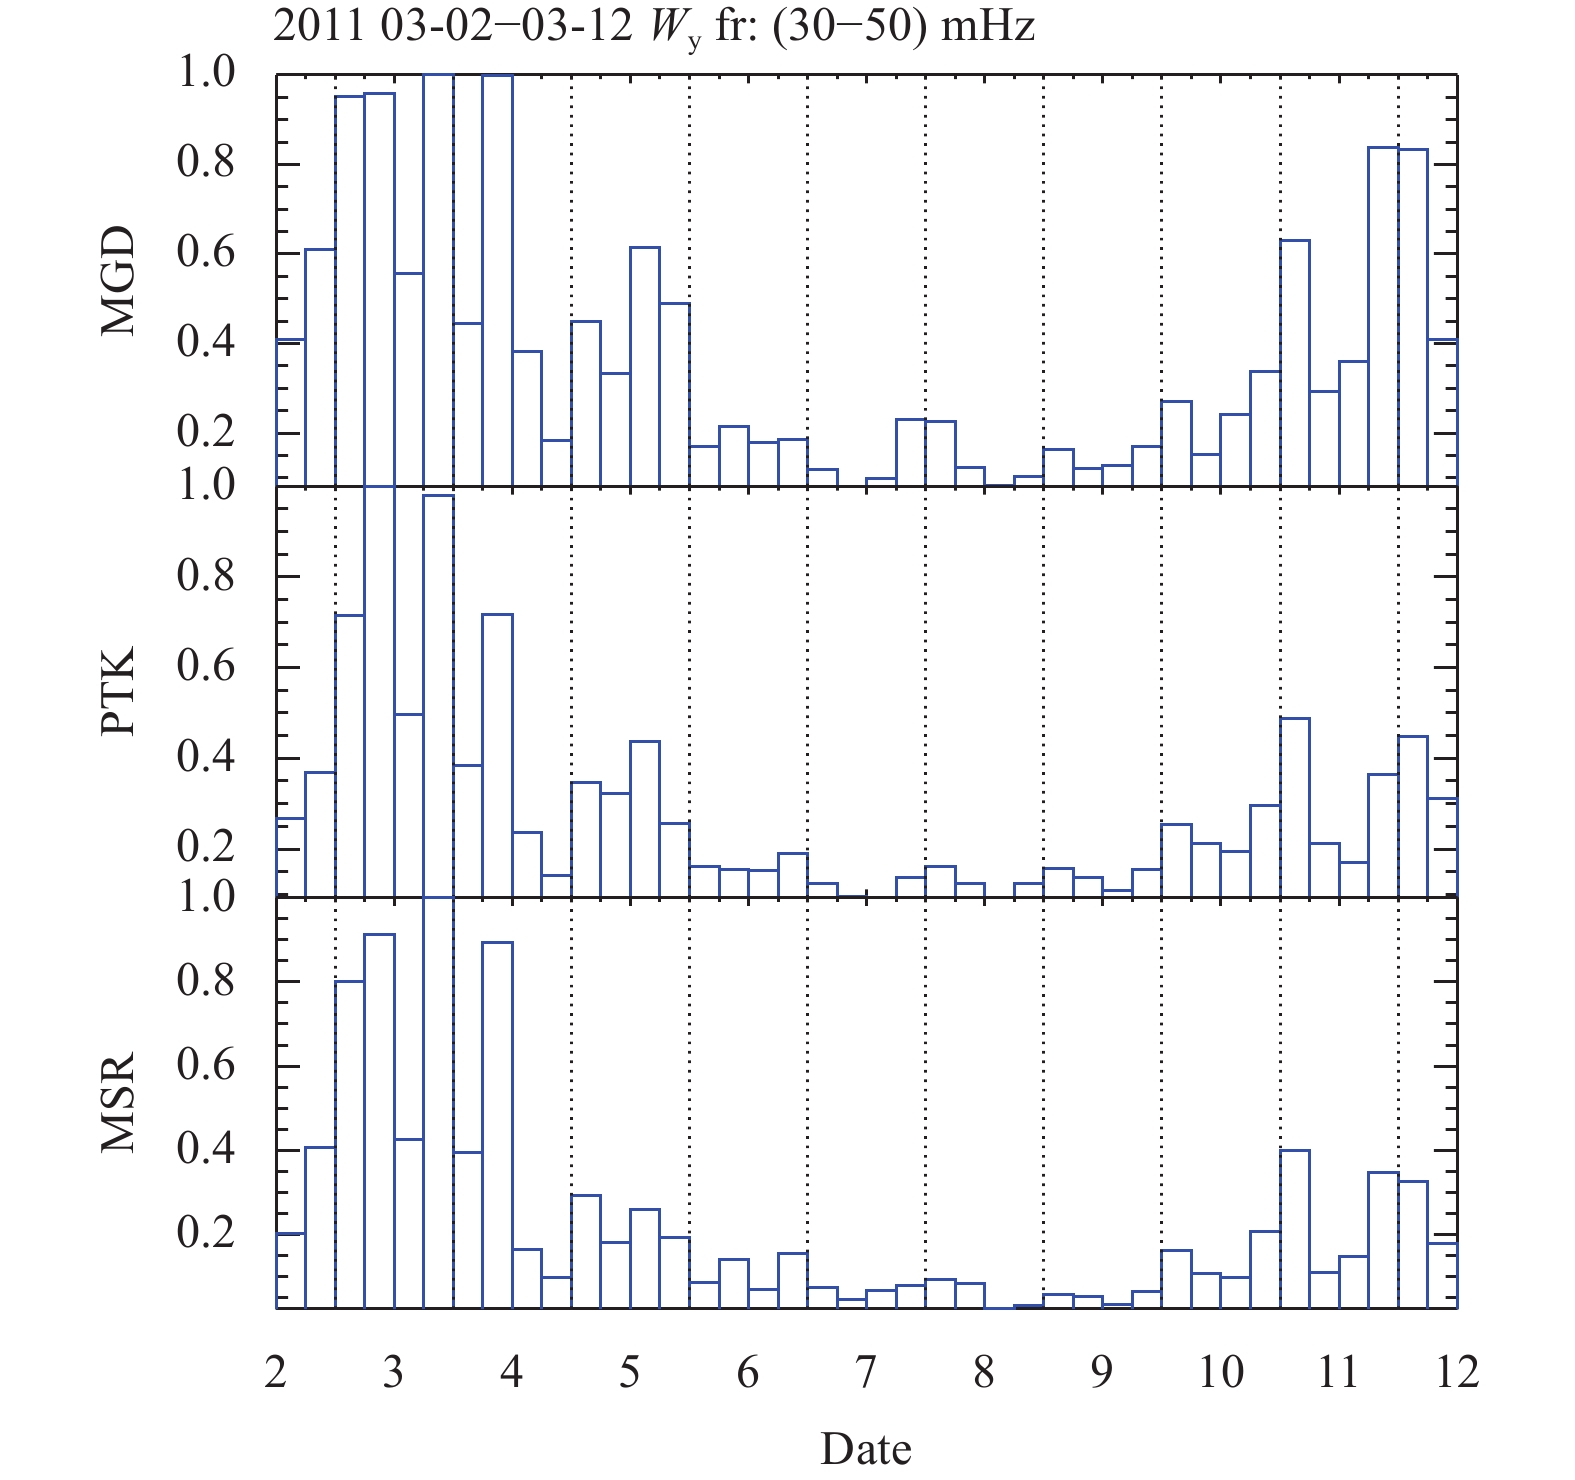
Finally, we performed a similar analysis of the SC magnetometer data from stations MGD, PTK, and MSR in the PWING array (Figure 4). The SC magnetometers also demonstrated ULF power depression at all stations.
Figure
4.
Variations in ULF power along latitudinal profile of PWING SC magnetometer MGD, PTK, and MSR. Variations in the normalized band-integrated (30–50 mHz) spectral power Wy during night hours recorded on March 2–12, 2011.
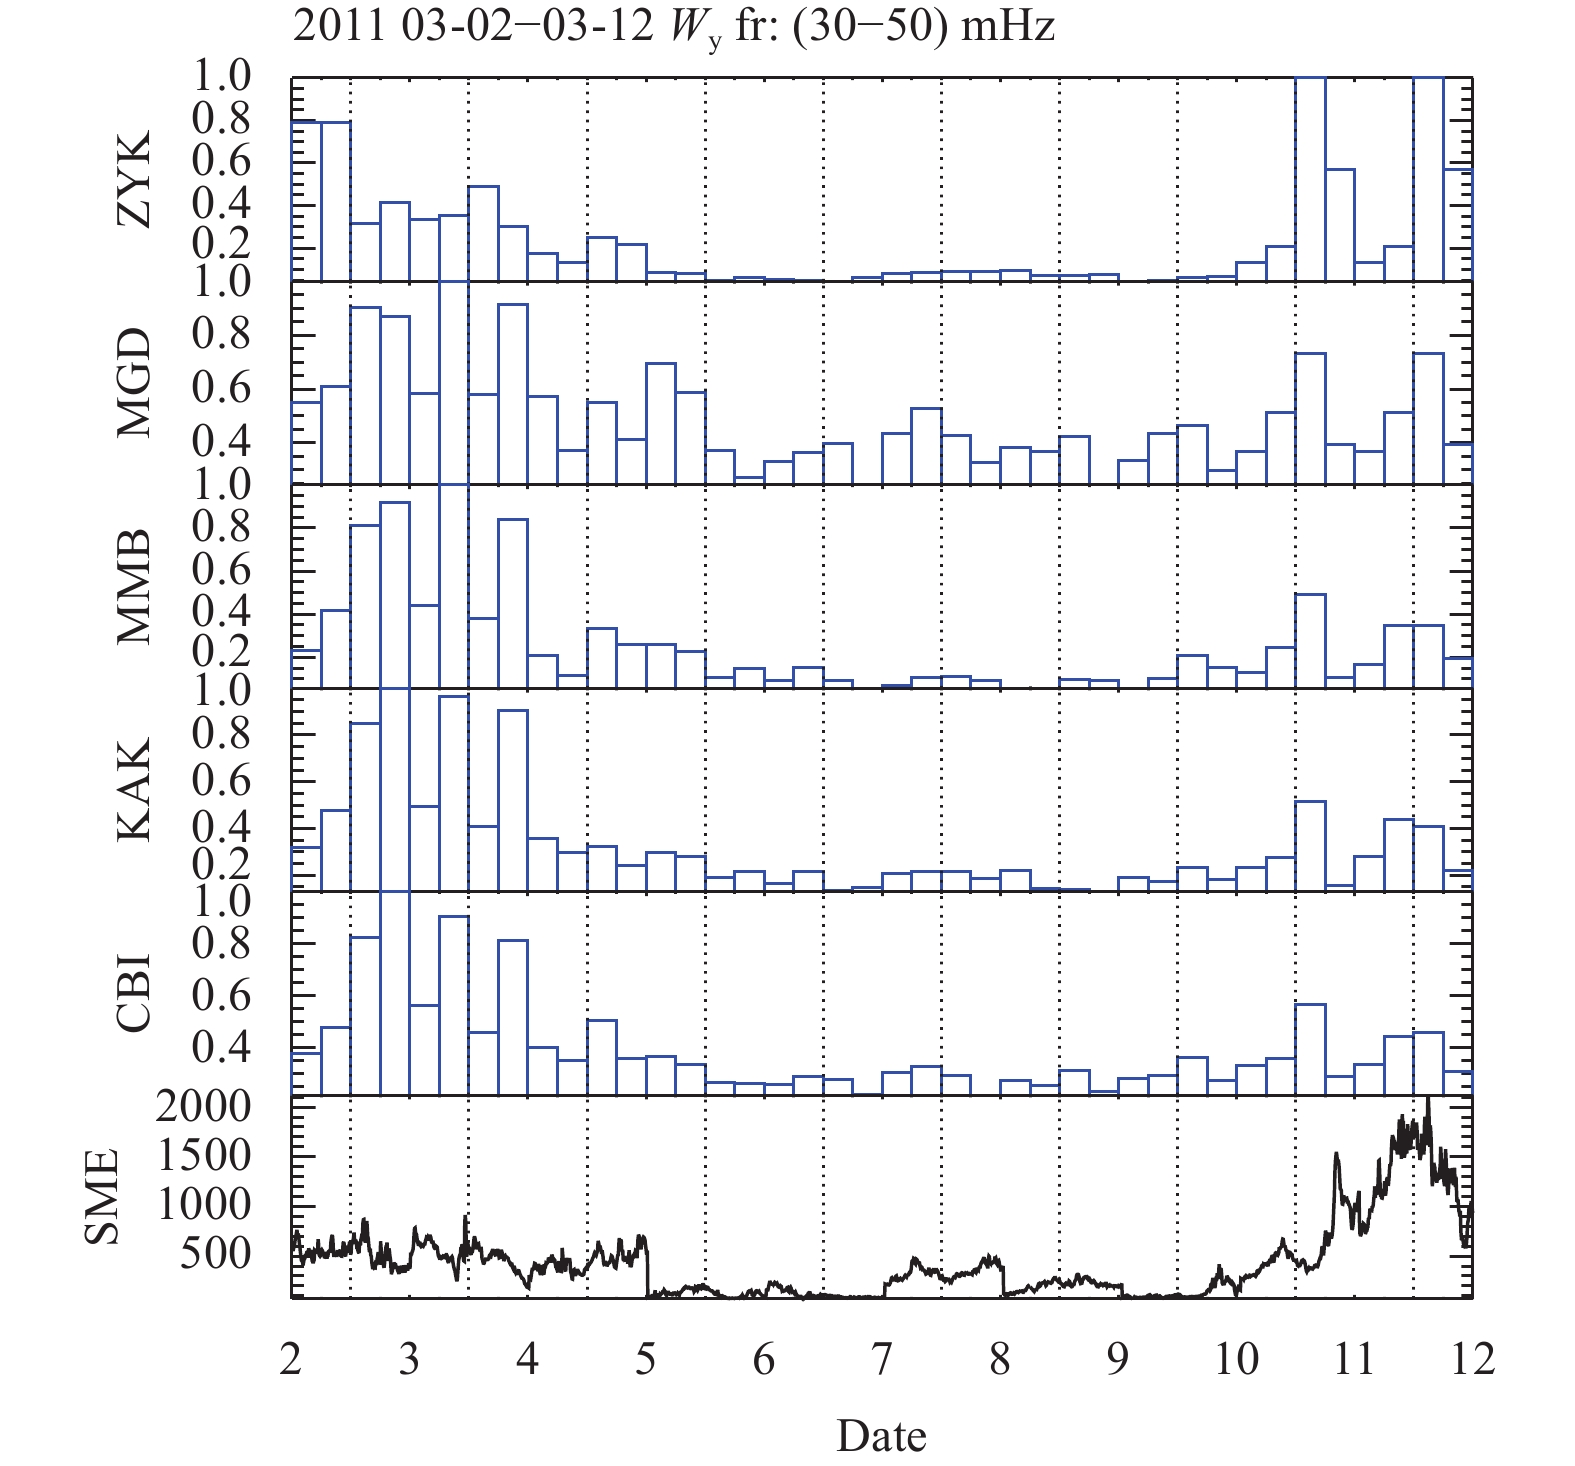
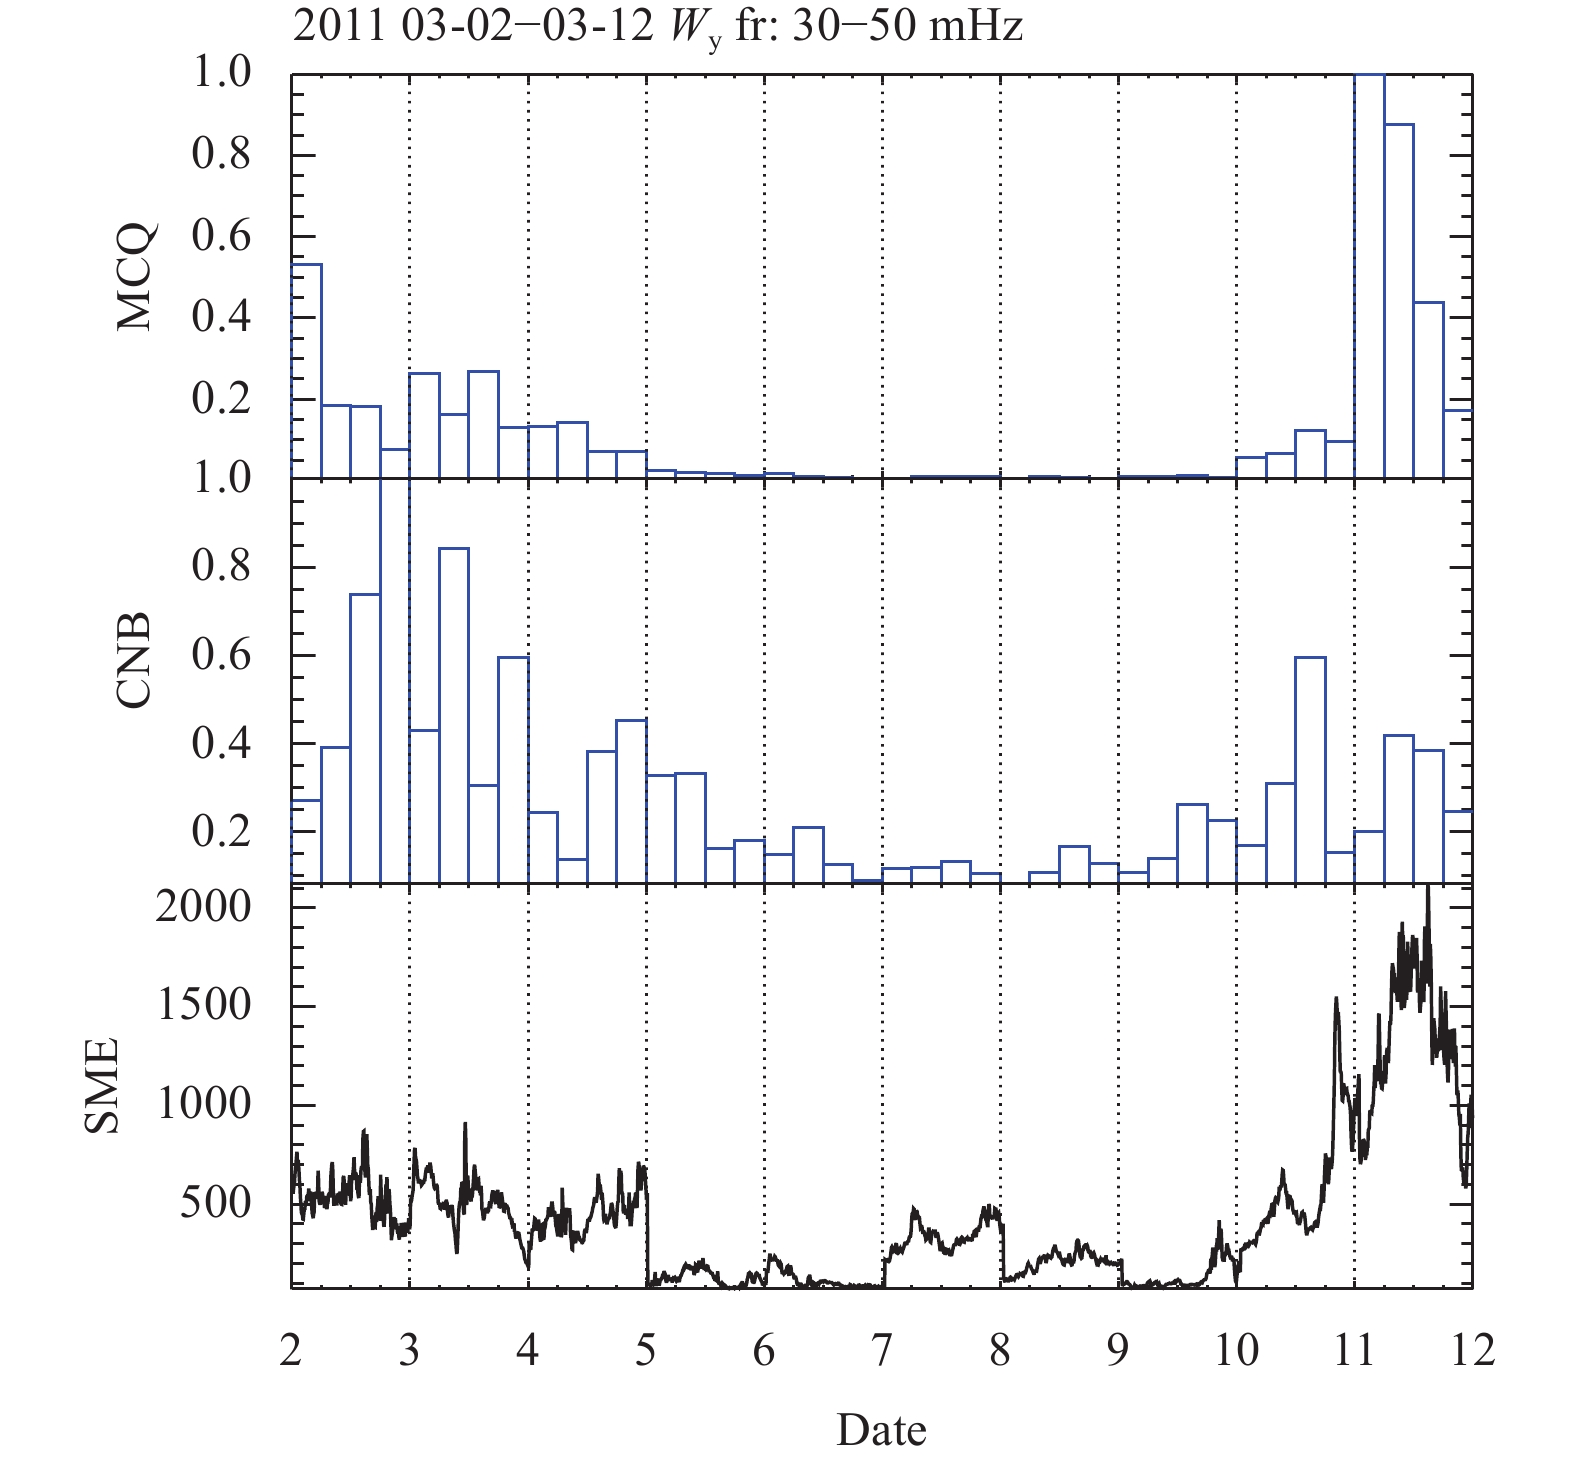
Thus, the ULF depression reported in previous studies is not a local effect around the earthquake epicenter but a regional effect. The physical cause of the global ULF depression is shown in Figure 5, where the diurnal variations in the ULF nighttime power from selected stations ZYK, MGD, MMB, KAK, and CBI along the 210 magnetic meridian were compared with the auroral SME index. The most intense geomagnetic activity, as well as ULF activity, was excited at auroral latitudes. The excited ULF disturbances then propagated deep inside the magnetosphere, and the ground image of this activity was observed at mid- and low latitudes. A comparison of the ULF power at a wide range of geomagnetic latitudes, from 20° to 60°, with the auroral SME index proves that ULF power depression is associated with the planetary suppression of magnetospheric magnetic activity. A high correlation between ULF power at middle latitudes and geomagnetic activity at auroral latitudes (characterized by AE or SME indices) is a well-known fact (e.g., Rae et al., 2011).
Figure
5.
Variations in the ULF power along the 210° magnetic meridian. The nighttime variations in the band-integrated (30–50 mHz) spectral power Wy recorded at the selected stations ZYK, MGD, MMB, KAK, and CBI are shown. The bottom panel shows the variations in planetary index SME. The vertical dotted lines indicate the boundaries between the nighttime intervals.
The concept of an earthquake precursor zone, characterized by the Dobrovolsky radius derived from the solution of a mechanical problem (Dobrovolsky et al., 1979), cannot be applied to electromagnetic precursory phenomena. Indeed, most reported ULF precursors have been discovered at distances of less than 200 km from the epicenter (Hattori, 2004). For the Tohoku mega-earthquake, the radius of the earthquake preparation zone was approximately 7500 km. Thus, although certain stations were located at high latitudes, they were still situated in the earthquake preparation zone. To avoid any ambiguity caused by the ULF power depression, we applied the same analysis to stations in the same MLT sector as Japan but in the Southern Hemisphere, MCQ, and CNB (Figure 1, right-hand panel). The distances between the Tohoku epicenter and these stations were well beyond the radius of the earthquake preparation zone, that is, the Dobrovolsky radius Table 1. The same analysis for March 2–11 for these stations (Figure 6) provides exactly the same behavior as that in Figure 2. From the viewpoint of space physics, this result is not surprising, because variations in magnetospheric activity occur simultaneously in geomagnetically conjugate regions.
Figure
6.
Variations in ULF power in the Southern Hemisphere. The band-integrated (30–50 mHz) spectral power Wy during the night hours recorded at station MCQ and CNB is shown. The bottom panel shows the variation in the planetary index (SME).
When a rock is strained, its evolution toward final rupture is characterized by the nucleation and coalescence of microcracks before the final rupture. The most indicative of the microfracturing process in the focal zone are supposedly ULF electromagnetic emissions and acoustic impulses. Although there have recently been many studies on electromagnetic emissions in a wide frequency range, from DC (<1 mHz) to VHF (30–300 MHz), associated with earthquakes, the main tool for monitoring such microfractures before the final rupture is the recording of ULF emissions (10 mHz to 10 Hz) (e.g., Hayakawa et al., 2011; Li Q et al., 2011). The efficiency of mechano-electromagnetic converters likely increases with frequency, but simultaneously, the absorption in the conducting crust also increases. The optimal frequency range for searching for predictive phenomena has not yet been determined, but attempts have been made to reveal it in the range of a few millihertz to the Schumann resonance of ~8 Hz (Hayakawa et al., 2012).
Among the possible seismo-electromagnetic phenomena, special attention has been given to the effect of ULF electromagnetic noise depression several days before a strong nearby earthquake (Schekotov and Hayakawa, 2015). This effect has been observed before many seismic events and seems promising for the development of an electromagnetic earthquake-prediction system. However, all existing reports describe ULF depression observations at only one station at low/middle latitudes. Intuitively, anomalies in electromagnetic noise variations should be observed only at stations close to the epicenter, and this effect should be absent at remote stations. Indeed, Hattori (2004) noted that all ULF precursory anomalies were detected before strong earthquakes at sites separated by no more than 200 km from the epicenter. We attempted to validate the depression effect before the March 11, 2011, earthquake at a wider network of stations along the geomagnetic meridian. We found that the ULF power depression has a regional character and is associated with planetary suppression of magnetospheric magnetic activity. Additional verification of all reported depressive effects is required using an extended regional network of magnetometers.
In general, seismogenic ULF emissions/impulses are weak, and more advanced methods of data analysis are necessary to detect signals below natural electromagnetic noise. Thus, it is advisable to monitor not only the integral characteristics of electromagnetic noise, but also to use the "fine" characteristics of time series-amplitude-phase gradients between nearby stations (Kopytenko et al., 2012), polarization structure (Hayakawa et al., 1996), fractal analysis (Contoyiannis et al., 2016), flicker noise spectroscopy (Ida et al., 2007), critical fluctuations method (Potirakis et al., 2019), and principal component analysis (Serita et al., 2005). Naturally, an isolated prediction method cannot provide a reliable, fully fledged forecast. Thus the study of the physical mechanisms of seismo-electromagnetic phenomena should be expanded using multi-instrument observations, such as groundwater dynamics, underground gas emanations, seismo-electric signals, very low frequency radio monitoring of the Earth-ionosphere waveguide, remote sensing of the ionosphere and near-surface atmosphere with satellites, and high-frequency acoustic and seismic noise.
5.
Conclusions
The widely reported effect of nighttime ULF power depression approximately five days before the catastrophic Tohoku 2011 earthquake has been validated. To test the reliability of this effect, we performed an extended analysis using data from the JMA, MAGDAS, PWING, and INTERMAGNET magnetometer arrays for the same LT sector. The band-integrated spectral power of the nighttime magnetic noise decreased significantly from March 6 to 9 at sites close to the earthquake epicenter (~300 km). However, such variations occur at distant stations (up to ~3000 km) in the Northern Hemisphere and even at stations (up to ~10000 km) in the Southern Hemisphere. A comparison with the planetary index SME showed that the ULF power depression was due to extremely low global geomagnetic activity. Thus, for this earthquake, the depression of geomagnetic ULF power cannot be considered a local short-term precursor. However, we do not claim that the Tohoku earthquake was preceded by ULF electromagnetic precursors. In addition to the ULF power depression, there may have been other ULF anomalies before the Tohoku earthquake that were caused by seismic-related processes, but this question needs further examination. In our opinion, the ongoing search for anomalous ULF signals remains a promising approach to find reliable electromagnetic methods for earthquake prediction.
Acknowledgements
This study was partly supported by Grant 22-17-00125 from the Russian Science Foundation. We appreciate the useful comments of E Takla (NRIAG, Egypt), the provision of the PWING data by K Shiokawa (ISEE, Japan), and the constructive comments and suggestions from both reviewers.
Conflict of interest
The authors affirm that they have no financial and personal relationships with any individuals or organization that could have potentially influenced the work presented in this paper.
Bleier T, Dunson C, Maniscalco M, Bryant N, Bambery R and Freund F (2009). Investigation of ULF magnetic pulsations, air conductivity changes and infra red signatures associated with the 30 October Alum Rock M5.4 earthquake. Nat Hazards Earth Syst Sci 9(2): 585 – 603 . https://doi.org/10.5194/nhess-9-585-2009.
Chowdhury S, Kundu S, Ghosh S, Hayakawa M, Schekotov A, Potirakis SM, Chakrabarti SK and Sasmal S (2022). Direct and indirect evidence of pre-seismic electromagnetic emissions associated with two large earthquakes in Japan. Nat Hazards 112(3): 2403 – 2432 . https://doi.org/10.1007/s11069-022-05271-5.
Contoyiannis Y, Potirakis SM, Eftaxias K, Hayakawa M and Schekotov A (2016). Intermittent criticality revealed in ULF magnetic fields prior to the 11 March 2011 Tohoku earthquake ( MW=9). Physica A 452: 19 – 28 . https://doi.org/10.1016/j.physa.2016.01.065.
Dobrovolsky IP, Zubkov SI and Miachkin VI (1979). Estimation of the size of earthquake preparation zones. PAGEOPH 117(5): 1025 – 1044 . https://doi.org/10.1007/BF00876083.
Hayakawa M, Kawate R and Molchanov OA (1996). Ultra-low-frequency signatures of the Guam earthquake on 8 August 1993 and their implication. J Atmos Electr 16(3): 193 – 198 . https://doi.org/10.1541/jae.16.193.
Hayakawa M, Hobara Y, Ohta K and Hattori K (2011). The ultra-low-frequency magnetic disturbances associated with earthquakes. Earthq Sci 24(6): 523 – 534 . https://doi.org/10.1007/s11589-011-0814-2.
Hayakawa M, Schekotov A, Molchanov O and Hobara Y (2012). Estimation of the efficiency of combined characteristics of ULF-ELF fields as a precursor to earthquakes based on the observations in February-March 2007 in Moshiri. J Atmos Electr 32(1): 35 – 40 . https://doi.org/10.1541/jae.32.35.
Hayakawa M, Schekotov A, Fedorov E and Hobara Y (2013a). On the ultra-low-frequency magnetic field depression for three huge oceanic earthquakes in Japan and in the Kurile Islands. Earth Sci Res 2(1): 33 – 42 . https://doi.org/10.5539/esr.v2n1p33.
Hayakawa M, Rozhnoi A, Solovieva M, Hobara Y, Ohta K, Schekotov A and Fedorov E (2013b). The lower ionospheric perturbation as a precursor to the 11 March 2011 Japan earthquake. Geomat Nat Haz Risk 4(3): 275 – 287 . https://doi.org/10.1080/19475705.2012.751938.
Hayakawa M, Schekotov A, Potirakis S and Eftaxias K (2015). Criticality features in ULF magnetic fields prior to the 2011 Tohoku earthquake. Proc Jpn Acad, Ser B 91(1): 25 – 30 . https://doi.org/10.2183/pjab.91.25.
Ida Y, Hayakawa M and Timashev S (2007). Application of different signal analysis methods to the ULF data for the 1993 Guam earthquake. Nat Hazards Earth Syst Sci 7(4): 479 – 484 . https://doi.org/10.5194/nhess-7-479-2007.
Kopytenko YA, Ismaguilov VS, Hattori K and Hayakawa M (2012). Anomaly disturbances of the magnetic fields before the strong earthquake in Japan on March 11, 2011. Ann Geophys 55(1): 101 – 107 . https://doi.org/10.4401/ag-5260.
Li Q, Zhu PY, Mamatemin A and Xu XG (2011). Detection of ULF electromagnetic emissions as a precursor to two earthquakes in China. Earthq Sci 24(6): 601 – 607 . https://doi.org/10.1007/s11589-011-0822-2.
Li Q, Schekotov A, Asano T and Hayakawa M (2015). On the anomalies in ULF magnetic field variations prior to the 2008 Sichuan earthquake. Open J Earthq Res 4(2): 55 – 64 . https://doi.org/10.4236/ojer.2015.42005.
Molchanov OA, Schekotov AY, Fedorov E, Belyaev GG, Solovieva MS and Hayakawa M (2004). Preseismic ULF effect and possible interpretation. Ann Geophys 47(1): 119 – 131 . https://doi.org/10.4401/ag-3265.
Ohta K, Izutsu J, Schekotov A and Hayakawa M (2013). The ULF/ELF electromagnetic radiation before the 11 March 2011 Japanese earthquake. Radio Sci 48(5): 589 – 596 . https://doi.org/10.1002/rds.20064.
Ouzounov D, Pulinets S, Romanov A, Romanov A, Tsybulya K, Davidenko D, Kafatos M and Taylor P (2011). Atmosphere-ionosphere response to the M9 Tohoku earthquake revealed by multi-instrument space-borne and ground observations: Preliminary results. Earthq Sci 24(6): 557 – 564 . https://doi.org/10.1007/s11589-011-0817-z.
Petraki E, Nikolopoulos D, Nomicos C, Stonham J, Cantzos D, Yannakopoulos P and Kottou S (2015). Electromagnetic pre-earthquake precursors: mechanisms, data and models - A review. J Earth Sci Clim Change 6(1): 250 . https://doi.org/10.4172/2157-7617.1000250.
Potirakis SM, Hayakawa M and Schekotov A (2017). Fractal analysis of the ground-recorded ULF magnetic fields prior to the 11 March 2011 Tohoku earthquake ( MW=9): discriminating possible earthquake precursors from space-sourced disturbances. Nat Hazards 85(1): 59 – 86 . https://doi.org/10.1007/s11069-016-2558-8.
Potirakis SM, Contoyiannis Y, Schekotov A, Asano T and Hayakawa M (2019). Analysis of the ultra-low frequency magnetic field fluctuations prior to the 2016 Kumamoto (Japan) earthquakes in terms of the method of critical fluctuations. Physica A 514: 563 – 572 . https://doi.org/10.1016/j.physa.2018.09.070.
Rae IJ, Murphy KR, Watt CEJ and Mann IR (2011). On the nature of ULF wave power during nightside auroral activations and substorms: 2. Temporal evolution. J Geophys Res: Space Phys 116(A5): A00I22 . https://doi.org/10.1029/2010JA015762.
Schekotov A, Molchanov O, Hattori K, Fedorov E, Gladyshev VA, Belyaev GG, Chebrov V, Sinitsin V, Gordeev E and Hayakawa M (2006). Seismo-ionospheric depression of the ULF geomagnetic fluctuations at Kamchatka and Japan. Phys Chem Earth 31(4-9): 313 – 318 . https://doi.org/10.1016/j.pce.2006.02.043.
Schekotov AY, Molchanov OA, Hayakawa M, Fedorov EN, Chebrov VN, Sinitsin VI, Gordeev EE, Belyaev GG and Yagova NV (2007). ULF/ELF magnetic field variations from atmosphere induced by seismicity. Radio Sci 42(6): RS6S90 . https://doi.org/10.1029/2005RS003441.
Schekotov AY, Molchanov OA, Hayakawa M, Fedorov EN, Chebrov VN, Sinitsin VI, Gordeev EE andreevsky SE, Belyaev GG, Yagova NV, Gladishev VA and Baransky LN (2008). About possibility to locate an EQ epicenter using parameters of ELF/ULF preseismic emission. Nat Hazards Earth Syst Sci 8(6): 1237 – 1242 . https://doi.org/10.5194/nhess-8-1237-2008.
Schekotov A, Fedorov E, Hobara Y and Hayakawa M (2013). ULF magnetic field depression as a possible precursor to the 2013/3.11 Japan earthquake. J Atmos Electr 33(1): 41 – 51 . https://doi.org/10.1541/jae.33.41.
Schekotov A and Hayakawa M (2015). Seismo-meteo-electromagnetic phenomena observed during a 5-year interval around the 2011 Tohoku earthquake. Phys Chem Earth 85–86 : 167–173.https://doi.org/10.1016/j.pce.2015.01.010.
Schekotov A and Hayakawa M (2017). ULF/ELF Electromagnetic Phenomena for Short-Term Earthquake Prediction. LAP LAMBERT Academic Publishing, Beau Bassin, pp 102.
Schekotov A, Chebrov D, Hayakawa M, Belyaev G and Berseneva N (2020). Short-term earthquake prediction in Kamchatka using low-frequency magnetic fields. Nat Hazards 100(2): 735 – 755 . https://doi.org/10.1007/s11069-019-03839-2.
Serita A, Hattori K, Yoshino C, Hayakawa M and Isezaki N (2005). Principal component analysis and singular spectrum analysis of ULF geomagnetic data associated with earthquakes. Nat Hazards Earth Syst Sci 5(5): 685 – 689 . https://doi.org/10.5194/nhess-5-685-2005.
Shiokawa K, Katoh Y, Hamaguchi Y, Yamamoto Y, Adachi T, Ozaki M, Oyama SI, Nosé M, Nagatsuma T, Tanaka Y, Otsuka Y, Miyoshi Y, Kataoka R, Takagi Y, Takeshita Y, Shinbori A, Kurita S, Hori T, Nishitani N, Shinohara I, Tsuchiya F, Obana Y, Suzuki S, Takahashi N, Seki K, Kadokura A, Hosokawa K, Ogawa Y, Connors M, Michael Ruohoniemi J, Engebretson M, Turunen E, Ulich T, Manninen J, Raita T, Kero A, Oksanen A, Back M, Kauristie K, Mattanen J, Baishev D, Kurkin V, Oinats A, Pashinin A, Vasilyev R, Rakhmatulin R, Bristow W and Karjala M (2017). Ground-based instruments of the PWING project to investigate dynamics of the inner magnetosphere at subauroral latitudes as a part of the ERG-ground coordinated observation network. Earth Planets Space 69: 160 . https://doi.org/10.1186/s40623-017-0745-9.
Sorokin VM, Fedorov EN, Schekotov AY, Molchanov OA and Hayakawa M (2004). Depression of the ULF geomagnetic pulsation related to ionospheric irregularities. Ann Geophys 47(1): 191 – 198 . https://doi.org/10.4401/ag-3271.
Takla EM, Yumoto K, Okano S, Uozumi T and Abe S (2013). The signature of the 2011 Tohoku mega earthquake on the geomagnetic field measurements in Japan. NRIAG J Astron Geophys 2(2): 185 – 195 . https://doi.org/10.1016/j.nrjag.2013.08.001.
Yao XY, Wang WQ and Teng YT (2022). Detection of geomagnetic signals as precursors to some earthquakes in China. Appl Sci 12(3): 1680 . https://doi.org/10.3390/app12031680.
Yumoto K and the MAGDAS Group (2006). MAGDAS project and its application for space weather. In: Gopalswamy N and Bhattacharyya A eds. Solar Influence on the Heliosphere and Earth's Environment: Recent Progress and Prospects. Quest Publications, Goa, pp 399–405.

 DownLoad: