 Download:
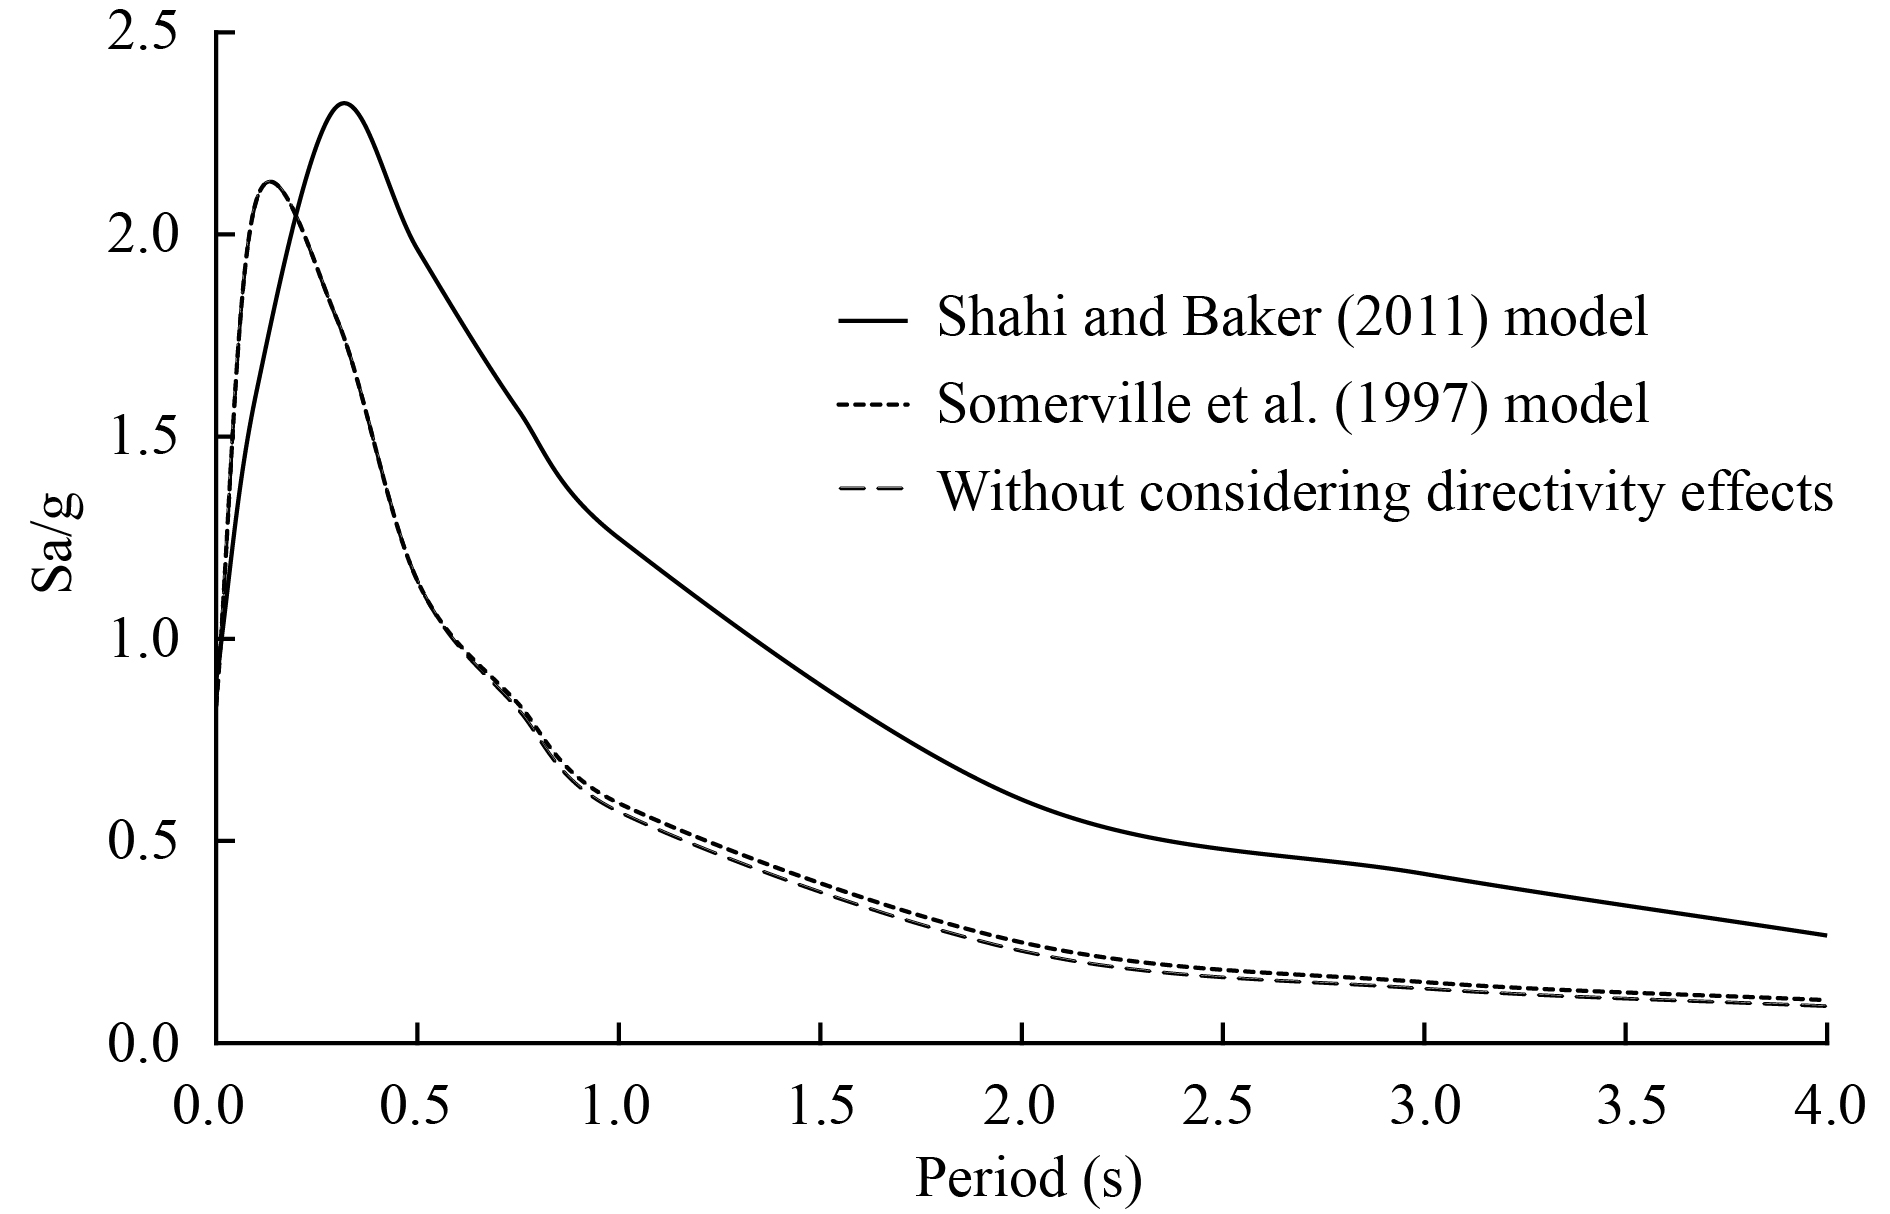
Response spectrum for the site of interest in Tehran in a 2475-year return period with and without considering rupture directivity effects
Figures of the Article
-
![]() Distribution of the faults and the earthquakes after 1900 with magnitudes greater than 5 in the investigation region (IIEES)
Distribution of the faults and the earthquakes after 1900 with magnitudes greater than 5 in the investigation region (IIEES)
-
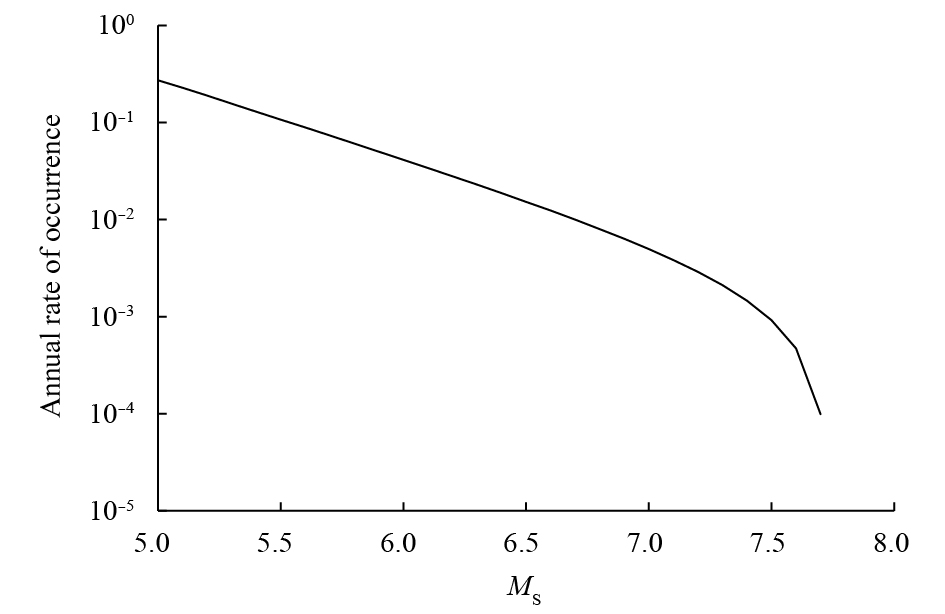
![]() Annual rate of occurrence estimated by Kijko (2000) method for Tehran and its vicinity
Annual rate of occurrence estimated by Kijko (2000) method for Tehran and its vicinity
-
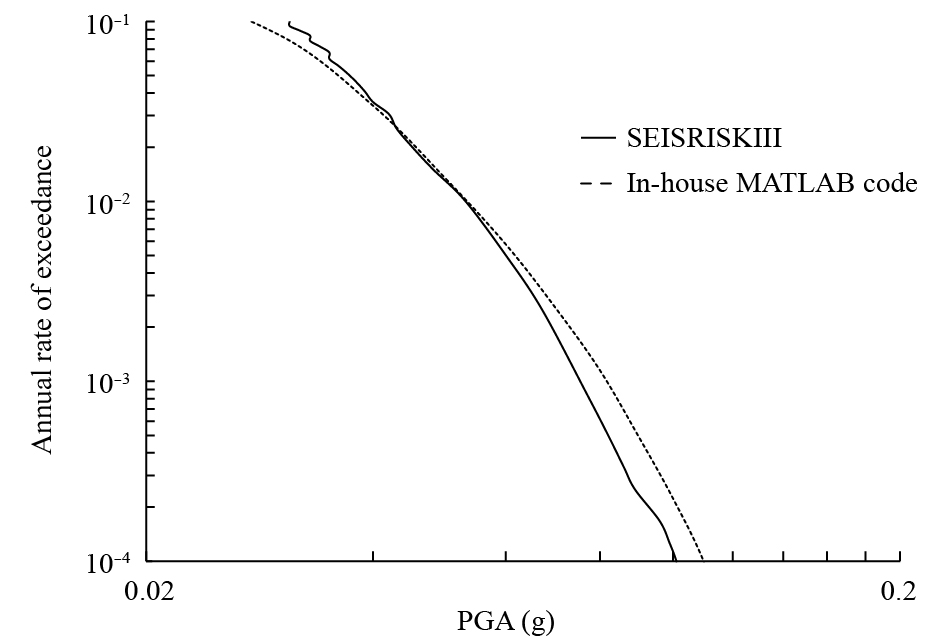
![]() Comparison of the resulted hazard curves for PGA using in-house MATLAB code and SEISRISKIII software, while the Mosha fault is considered as the only source of seismicity
Comparison of the resulted hazard curves for PGA using in-house MATLAB code and SEISRISKIII software, while the Mosha fault is considered as the only source of seismicity
-
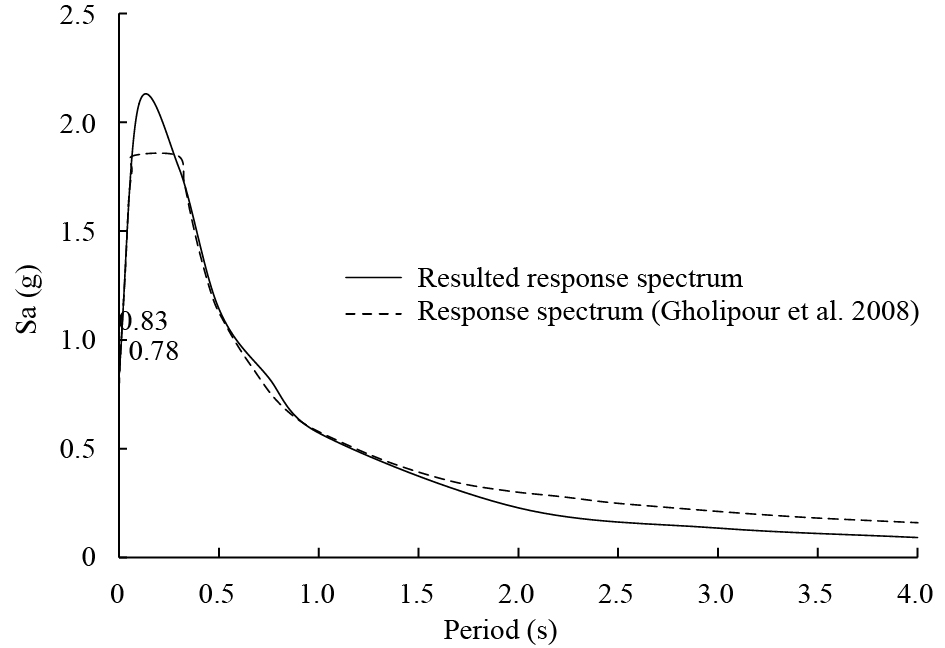
![]() Comparison of a 2475-year return period response spectrum resulted in this study with response spectrum presented in Gholipour et al. (2008) final PSHA reports for Tehran
Comparison of a 2475-year return period response spectrum resulted in this study with response spectrum presented in Gholipour et al. (2008) final PSHA reports for Tehran
-
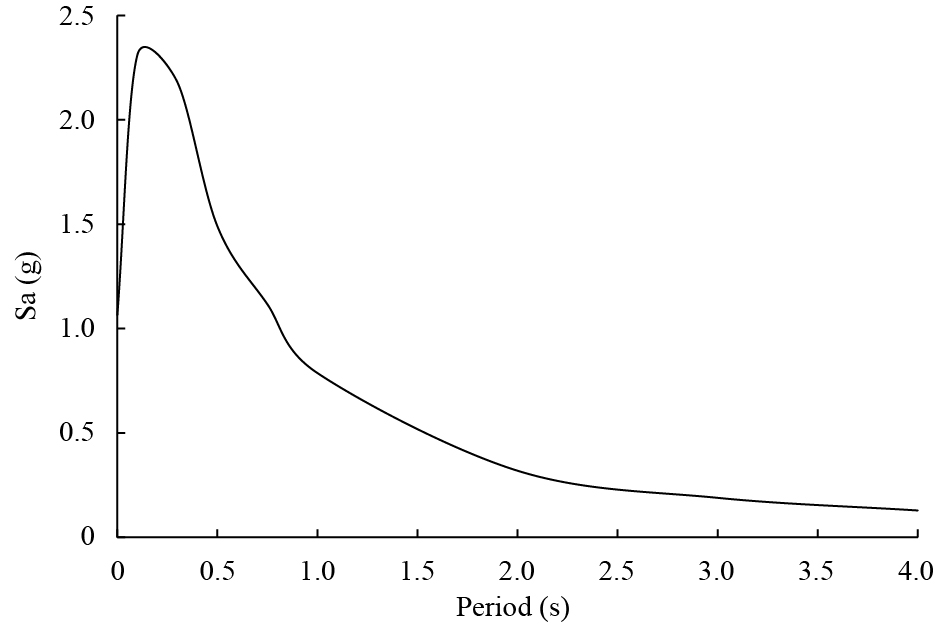
![]() Response spectrum for the bedrock of considered site in a 10000-year return period
Response spectrum for the bedrock of considered site in a 10000-year return period
-
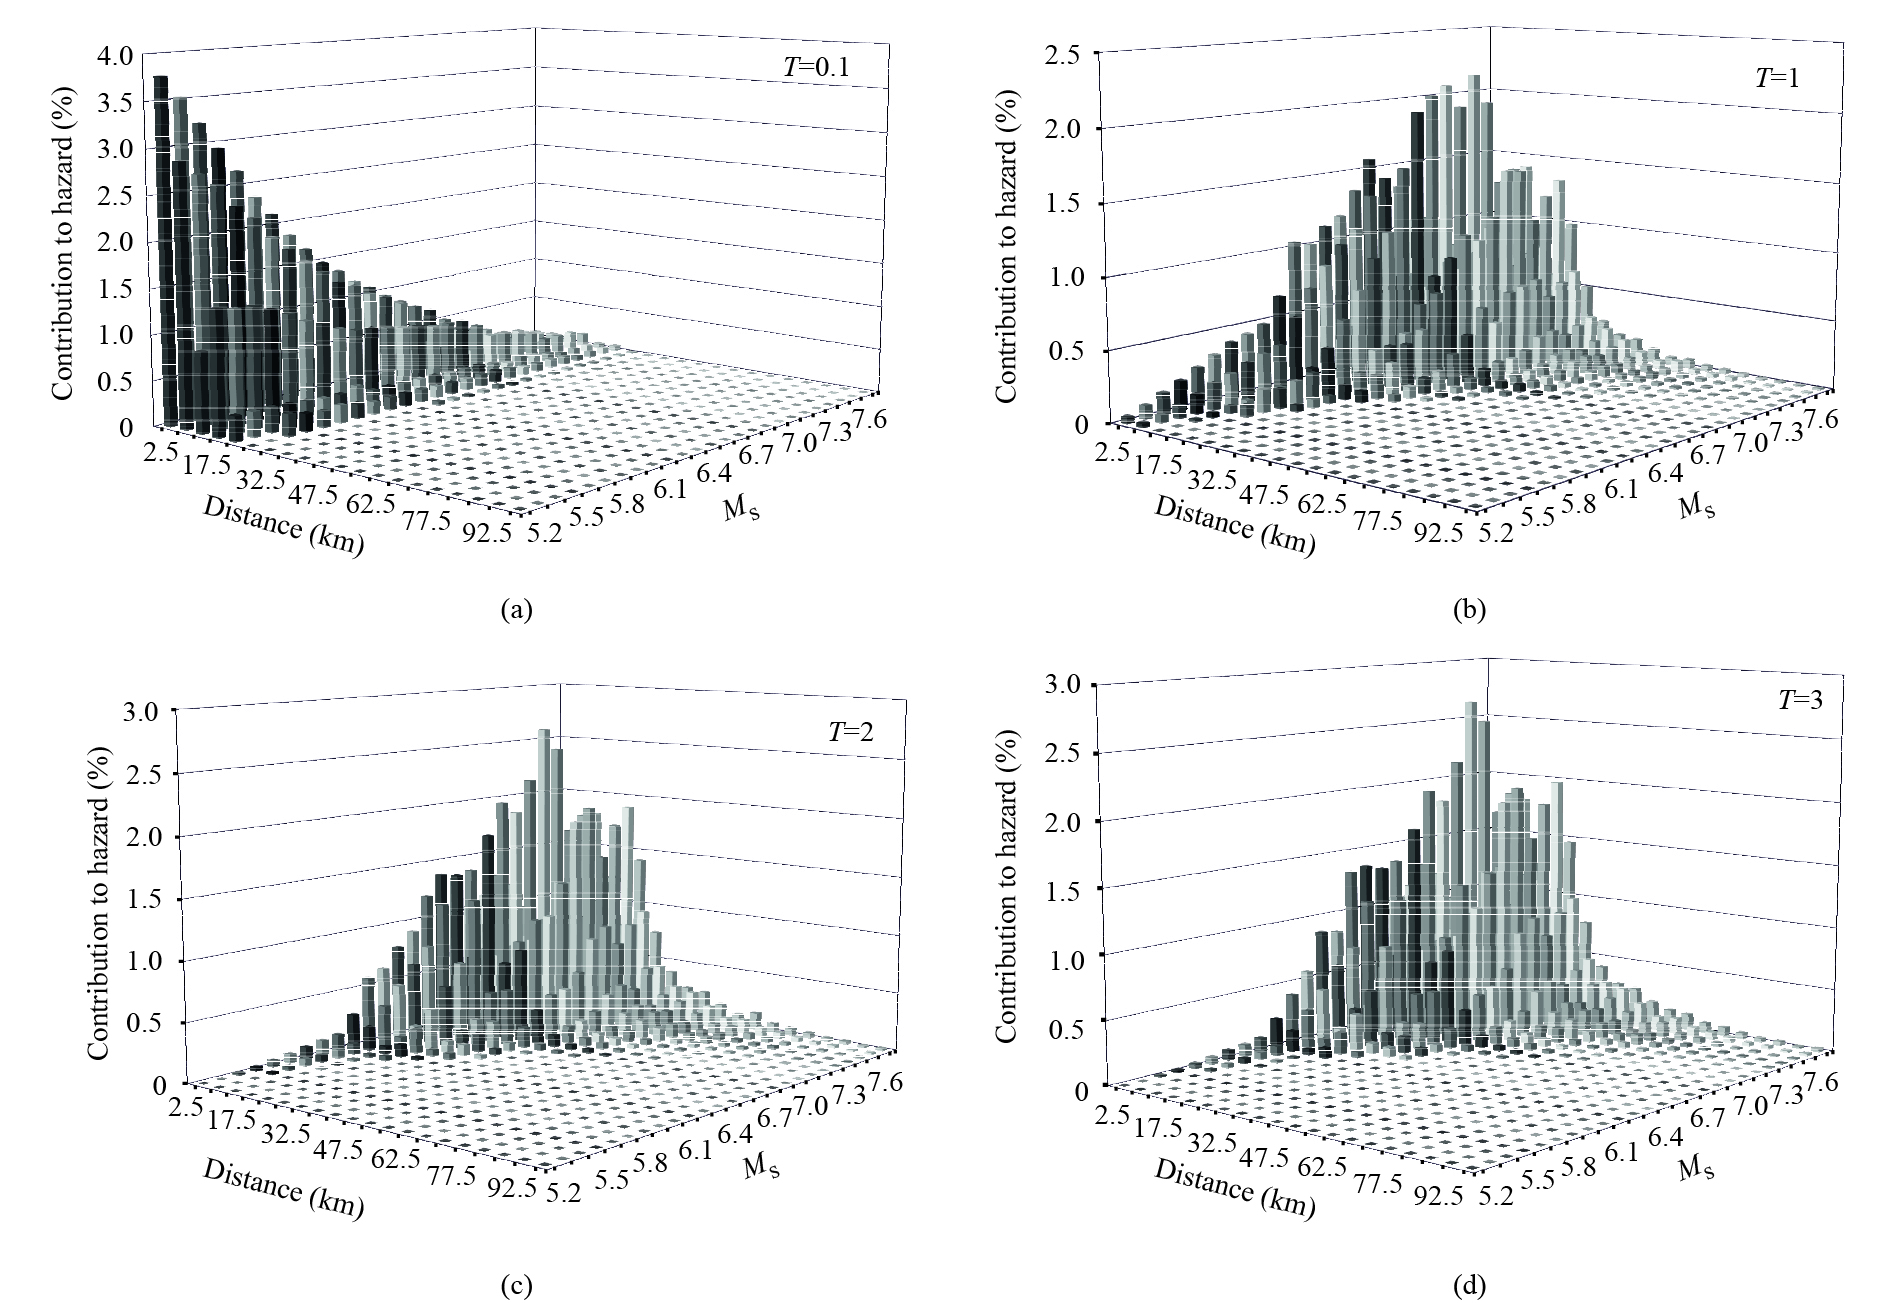
![]() Deaggregation of hazard for the site of interest in Tehran in a 10000-year return period for different vibration periods, T
Deaggregation of hazard for the site of interest in Tehran in a 10000-year return period for different vibration periods, T
-
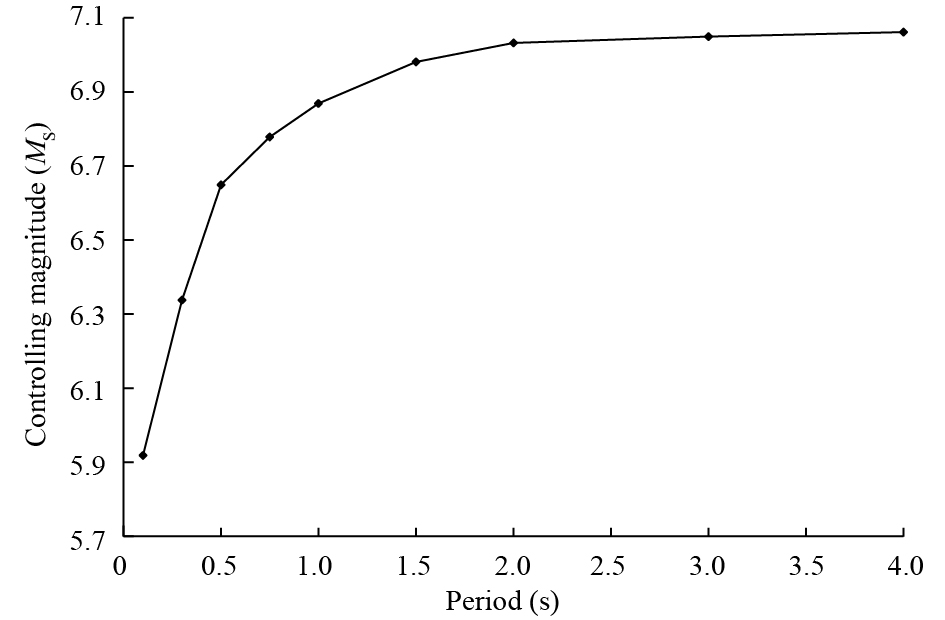
![]() Variation of controlling magnitude with period for the site of interest in a 10000-year return period
Variation of controlling magnitude with period for the site of interest in a 10000-year return period
-
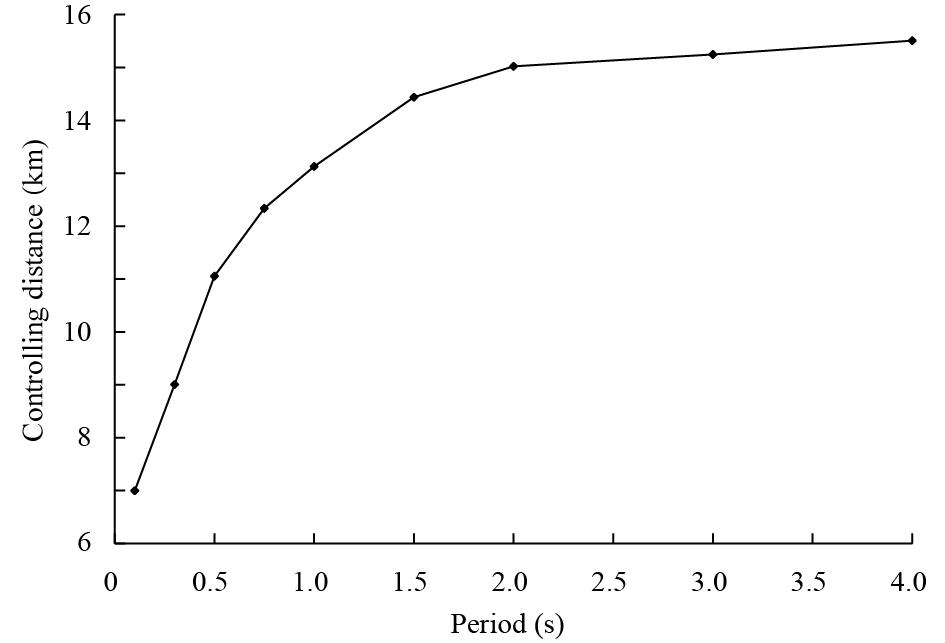
![]() Variation of controlling distance with period for the site of interest in a 10000-year return period
Variation of controlling distance with period for the site of interest in a 10000-year return period
-
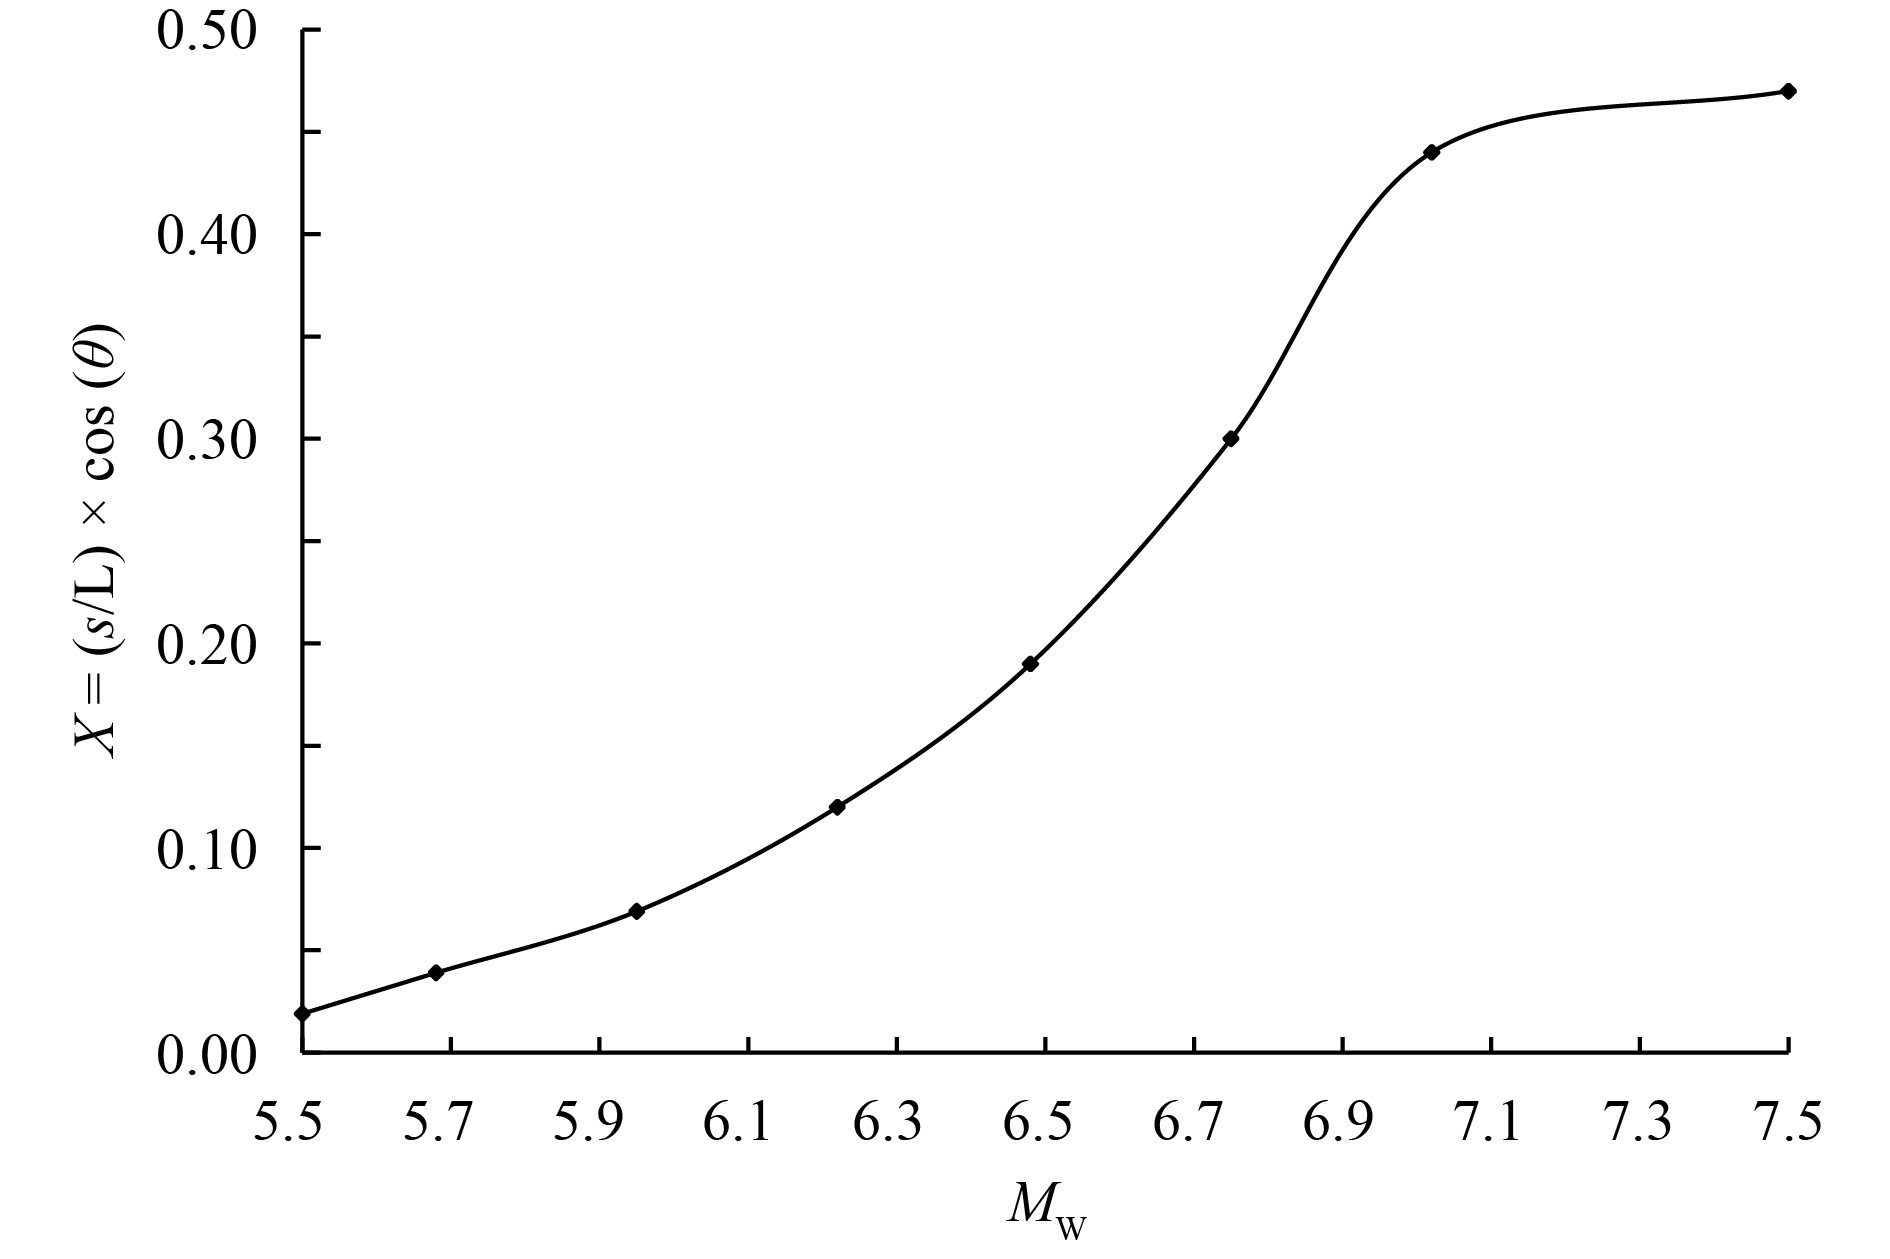
![]() Variation of values for X with magnitude for the site of interest at the worst scenario for the location of hypocenter
Variation of values for X with magnitude for the site of interest at the worst scenario for the location of hypocenter
-
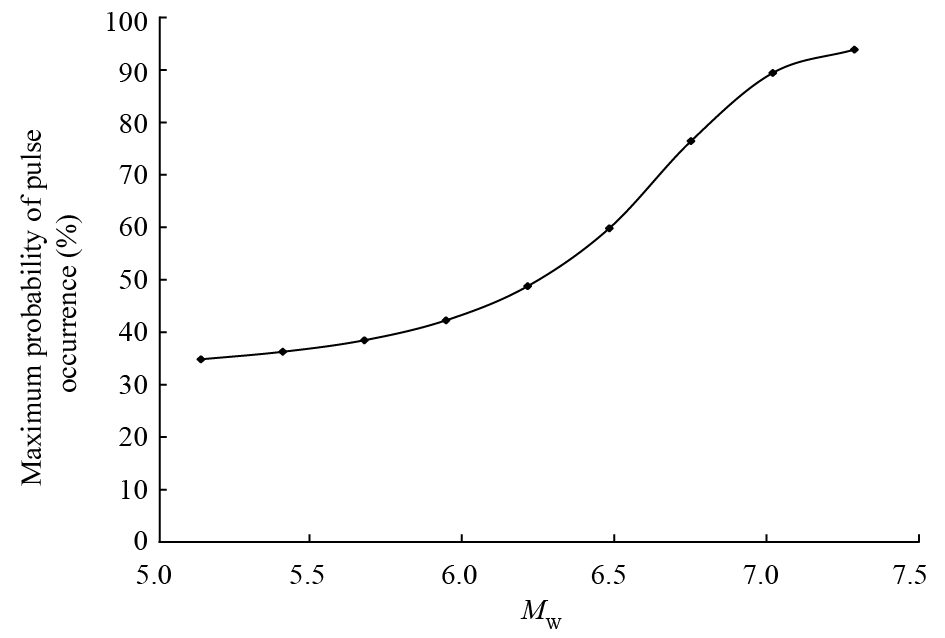
![]() Maximum probability of pulse occurrence at the site of interest in Tehran for earthquakes with different magnitudes on North Tehran fault
Maximum probability of pulse occurrence at the site of interest in Tehran for earthquakes with different magnitudes on North Tehran fault
-
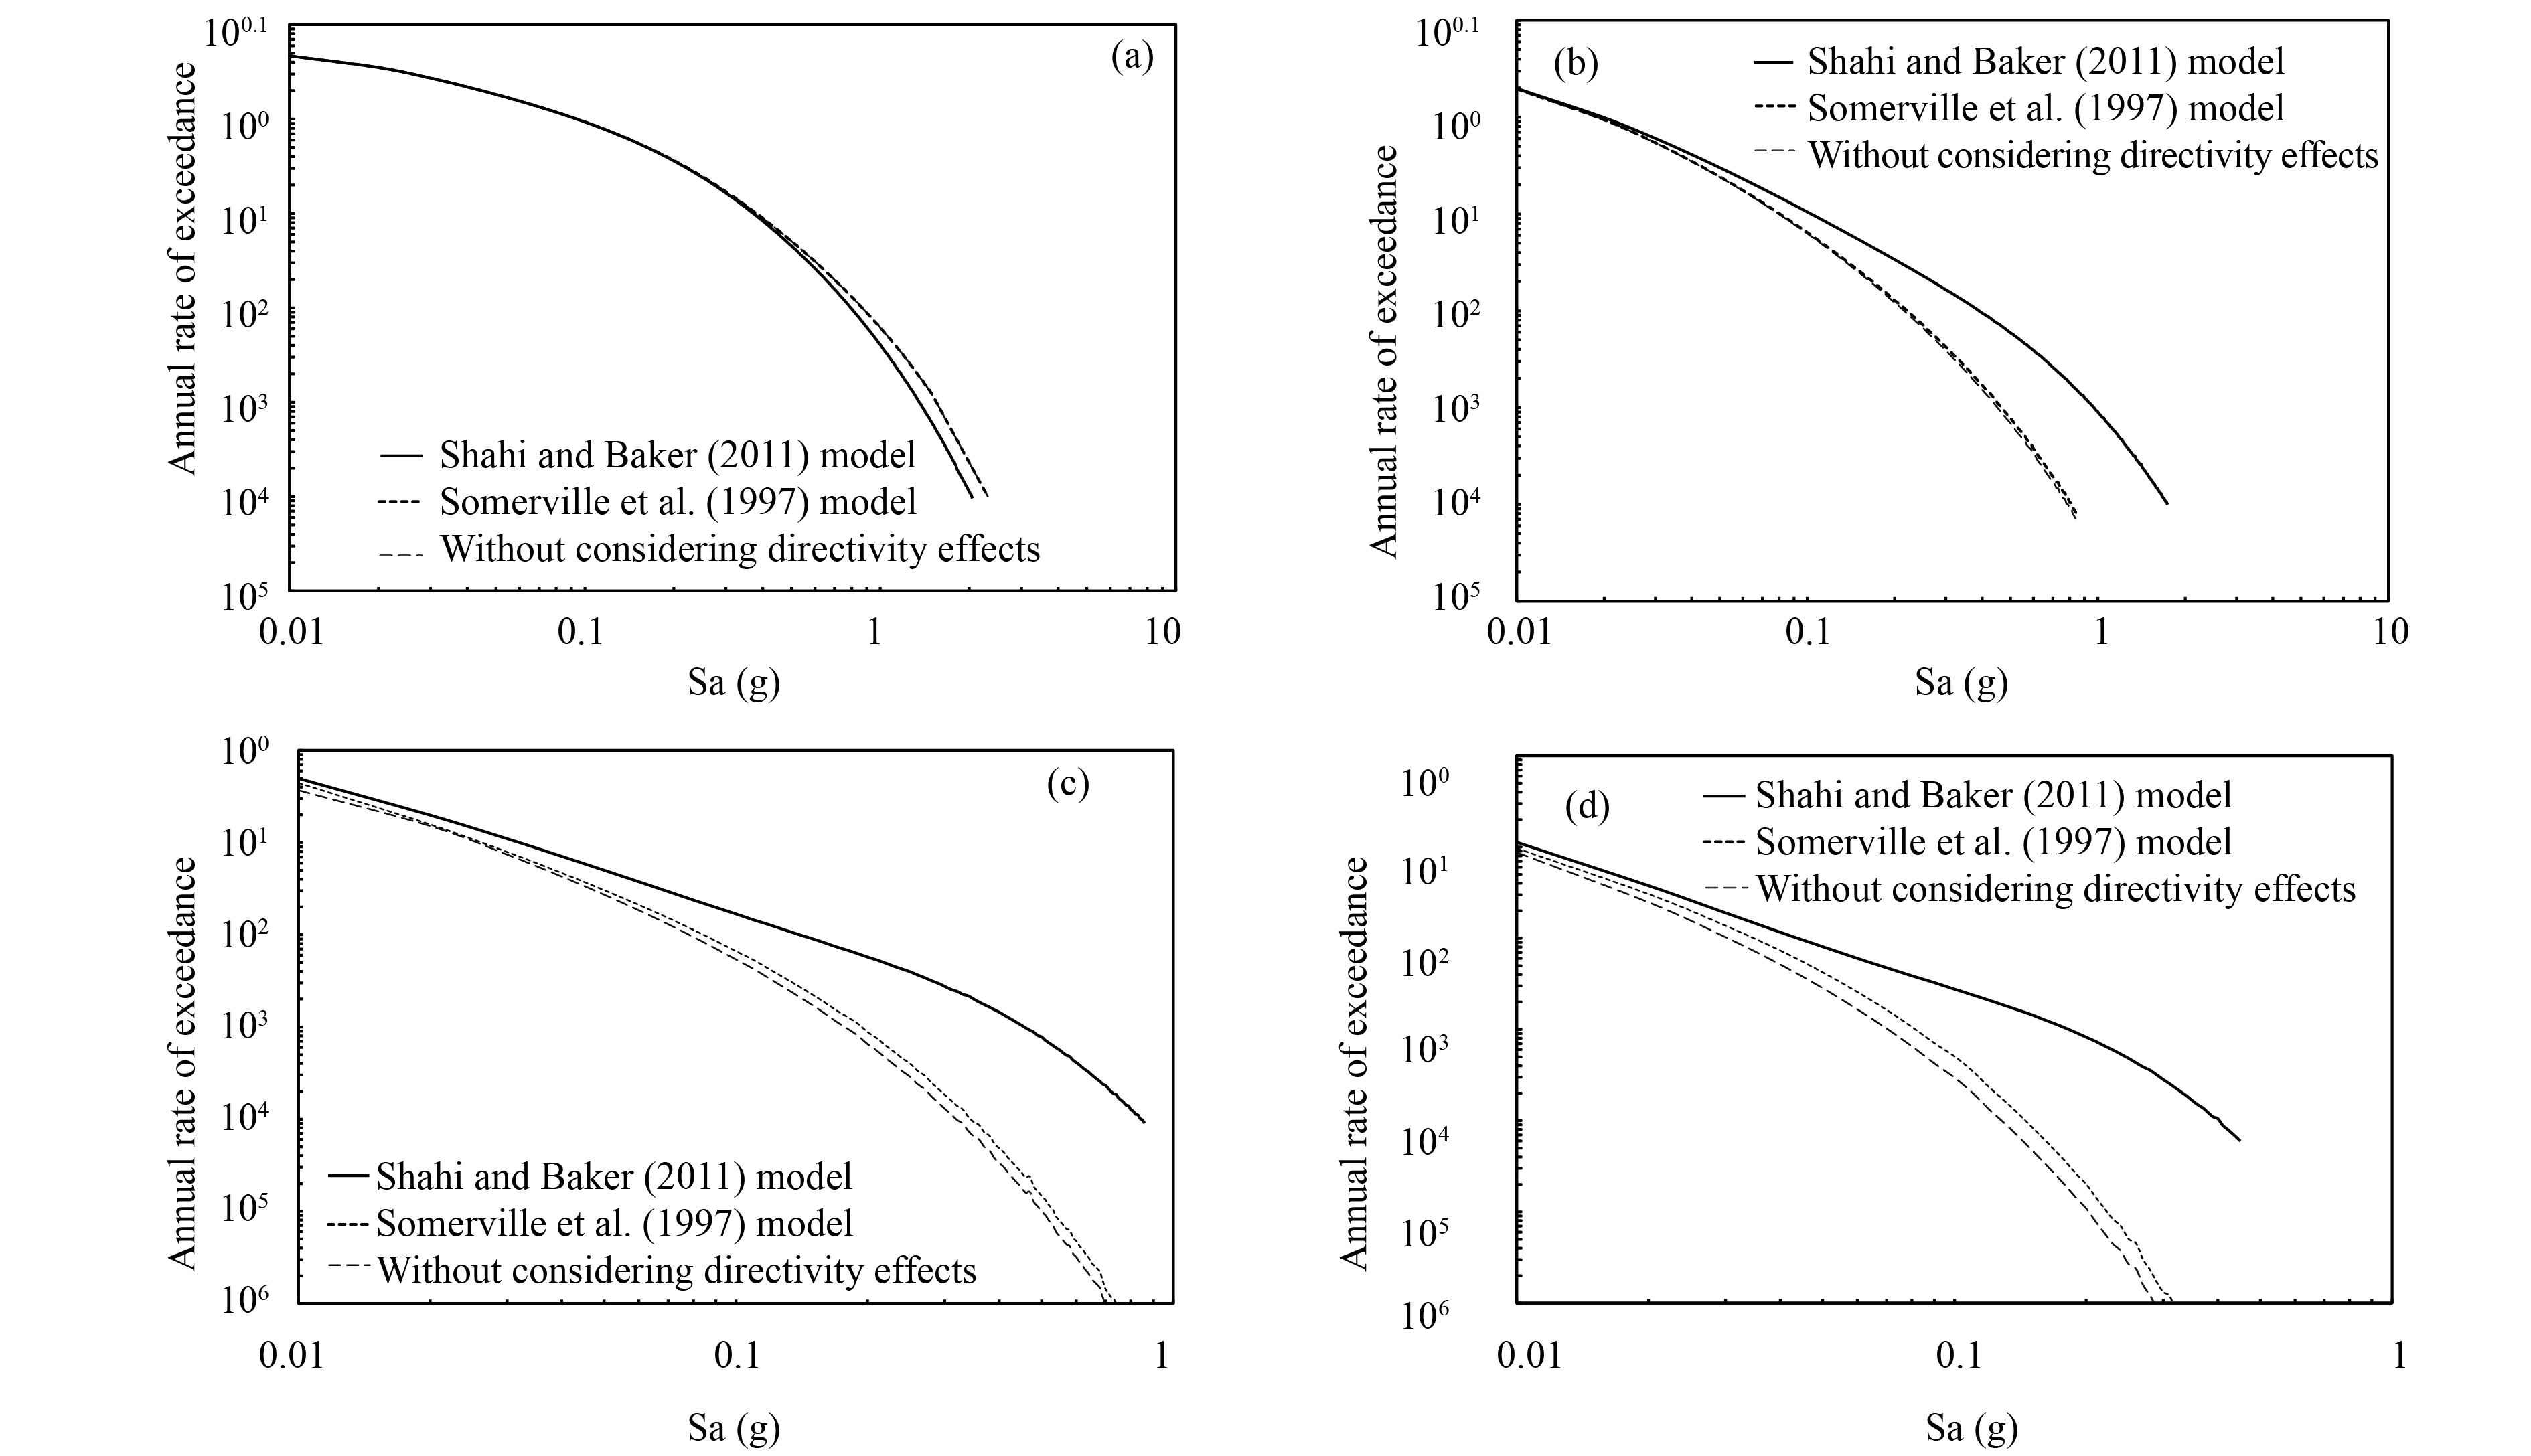
![]() Hazard curves for the site of interest in Tehran in a 10000-year return period for different vibration periods, (a) T=0.1 s (b) T=1 s (c) T=2 s (d) T=4 s
Hazard curves for the site of interest in Tehran in a 10000-year return period for different vibration periods, (a) T=0.1 s (b) T=1 s (c) T=2 s (d) T=4 s
-
![]() Response spectrum for the site of interest in Tehran in a 2475-year return period with and without considering rupture directivity effects
Response spectrum for the site of interest in Tehran in a 2475-year return period with and without considering rupture directivity effects
-
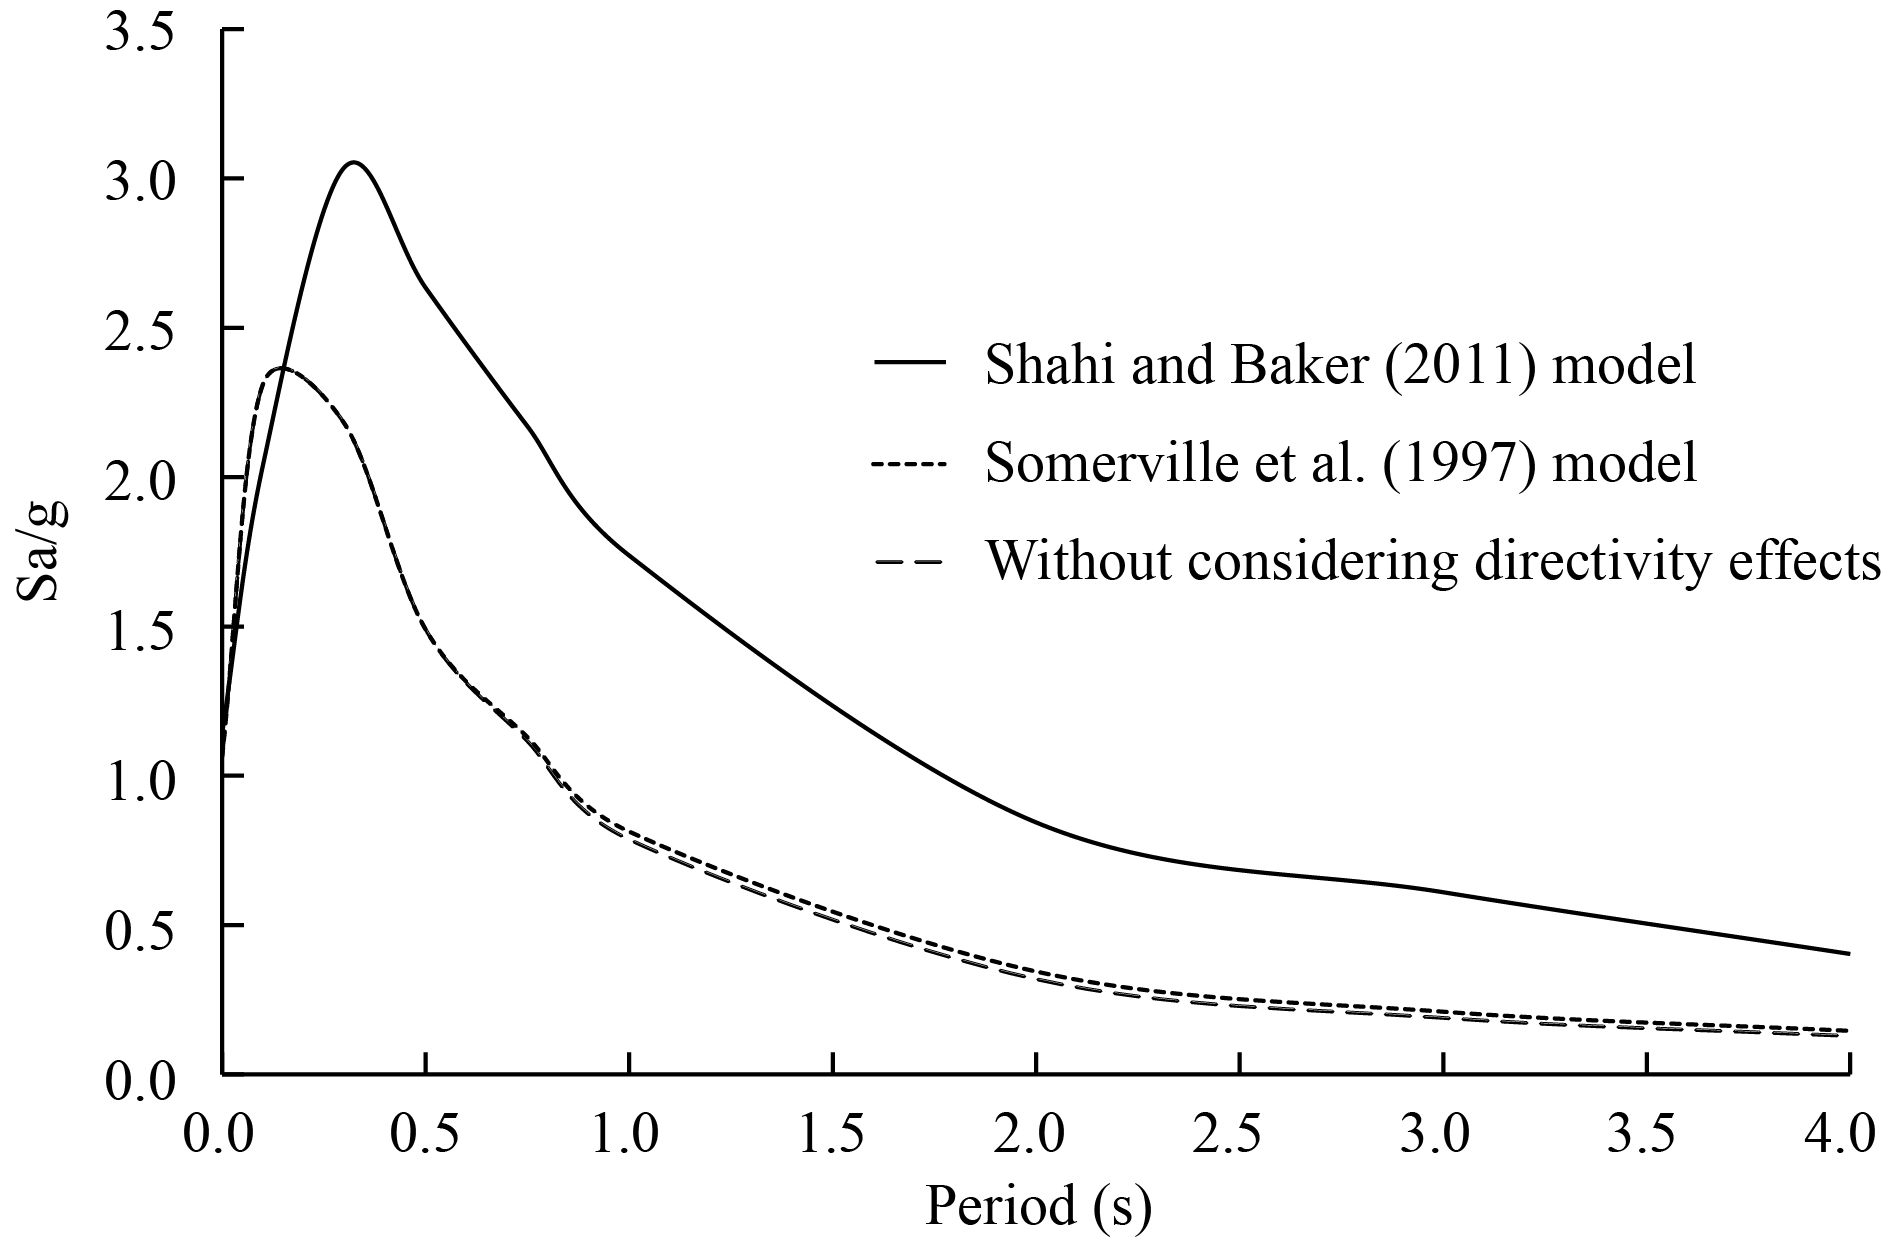
![]() Response spectrum for the site of interest in Tehran in a 10000-year return period with and without considering rupture directivity effects
Response spectrum for the site of interest in Tehran in a 10000-year return period with and without considering rupture directivity effects