Dandan Li, Gaochun Wang, Ruihua Lin, Kai Deng, Xiaobo Tian (2019). The shallow crustal S-velocity structure of the Longmenshan fault zone using ambient noise tomography of a seismic dense array. Earthq Sci 32(5-6): 197-206. DOI: 10.29382/eqs-2019-0197-02
Citation:
Dandan Li, Gaochun Wang, Ruihua Lin, Kai Deng, Xiaobo Tian (2019). The shallow crustal S-velocity structure of the Longmenshan fault zone using ambient noise tomography of a seismic dense array. Earthq Sci 32(5-6): 197-206. DOI: 10.29382/eqs-2019-0197-02
Dandan Li, Gaochun Wang, Ruihua Lin, Kai Deng, Xiaobo Tian (2019). The shallow crustal S-velocity structure of the Longmenshan fault zone using ambient noise tomography of a seismic dense array. Earthq Sci 32(5-6): 197-206. DOI: 10.29382/eqs-2019-0197-02
Citation:
Dandan Li, Gaochun Wang, Ruihua Lin, Kai Deng, Xiaobo Tian (2019). The shallow crustal S-velocity structure of the Longmenshan fault zone using ambient noise tomography of a seismic dense array. Earthq Sci 32(5-6): 197-206. DOI: 10.29382/eqs-2019-0197-02
The Longmenshan fault zone (LMSF), characterized by complex structures and strong seismicity, is located at the junction between the eastern margin of the Tibetan Plateau and the north-western Sichuan basin. Since the Wenchuan earthquake on May 12, 2008, abundant studies of the formation mechanism of earthquakes along the LMSF were performed. In this study, a short-period dense seismic array deployed across the LMSF was applied by ambient noise tomography. Fifty-two 3-D seismic instruments were used for data acquisition for 26 days. We calculated the empirical Green's functions (EGFs) between different station-pairs and extracted 776 Rayleigh-wave dispersion curves between 2 and 7 s. And then, we used the direct-inversion method to obtain the fine shallow crustal S-wave velocity structure within 6 km depth in the middle section of the Longmenshan fault zone and nearby areas. Our results show that the sedimentary layer (>5 km) exists in the northwest margin of Sichuan Basin with a low S-wave velocity (~1.5−2.5 km/s) which is much thicker than that beneath the Longmenshan fault zone and the Songpan-Garzê block. The high-velocity structures with clear boundaries below the middle of Longmenshan fault zone (~2−4 km) and the Songpan-Garzê block (~4.5−6 km) probably reveal the NW-SE distribution patterns of both the Pengguan complex and the high-density belt hidden in the northwest of the Pengguan complex. And the obviously high-velocity anomalies observed at the depth of ~1−2 km in the southeastern margin of the Songpan-Garzê block can be considered as the Laojungou granites. Our results provide a high-resolution shallow velocity structure for detailed studies of the Longmenshan fault zone.
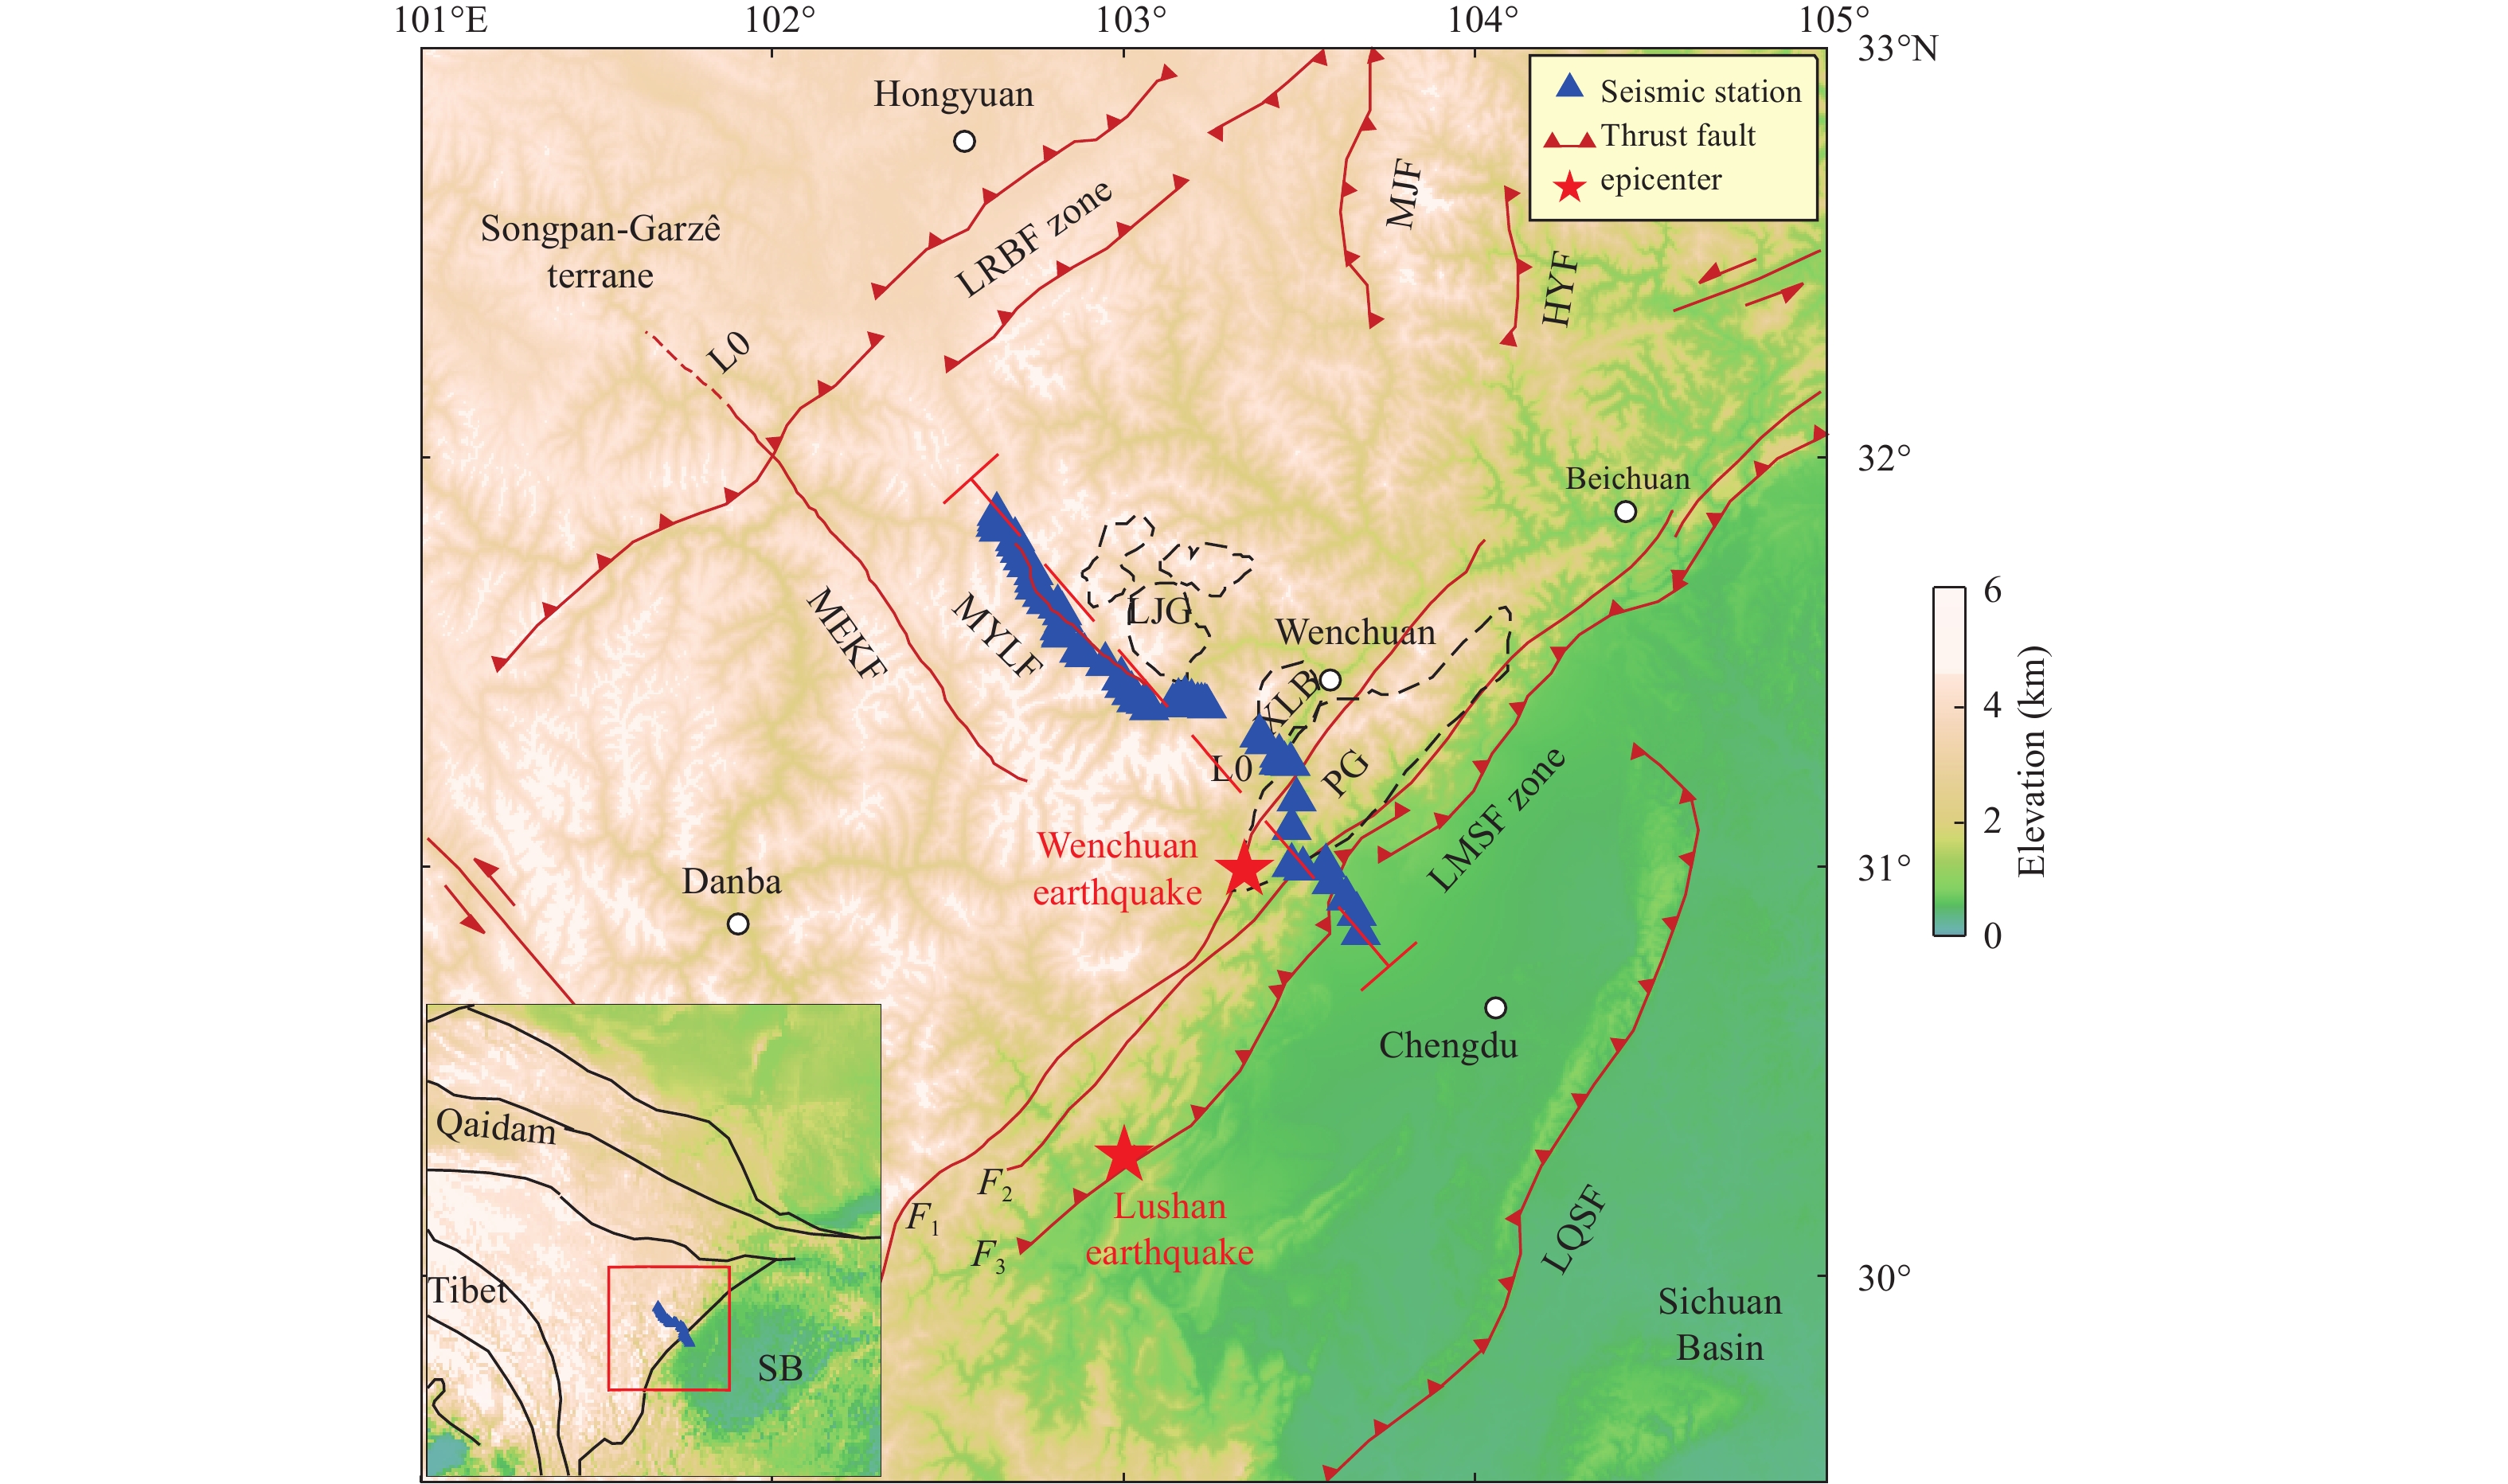
Located at the junction of the Sichuan foreland basin and the Songpan-Garzê block, the Longmenshan fault zone is formed by the strong eastward compression from the Tibetan Plateau and the blocking of Sichuan Basin (Figure 1) (Burchfiel et al., 1995, 2008; Jia et al., 2006; Hubbard and Shaw, 2009). Characterized by complex structures and strong seismicity, the huge Longmenshan fault zone is composed of three major faults (F1: Wenchuan-Maoxian Fault; F2: Yingxiu-Beichuan Fault; F3: Hanwang-Anxian Fault) (Figure 1). Since the 21st century, two strong earthquakes have occurred on the Longmenshan fault zone, causing terrible casualities and economic losses. The Wenchuan earthquake (MS 8.0) in 2008 was caused mainly by thrust motion with stike-slip along F1 and F2 (Wang et al., 2008). And occurring at the F3 on the southwest end of Longmenshan fault zone, the Lushan earthquake (MW6.7) in 2013 was a thrust event (Lin et al., 2013). Therefore, it is urgent to utilize various geophysical methods to study the underground structure of the Longmenshan fault zone.
Figure
1.
Tectonic setting and distribution of seismic stations in the Longmenshan fault zone. LQSF: Longquanshan fault zone; IMSF zone: Longmenshan fault zone; F1: Wenchuan-Maoxian fault; F2: Yingxiu-Beichuan fault; F3: Hanwang-Anxian fault; MEKF: Barkam fault; HYF: Huya fault; LRBF zone: Longriba fault zone; MJF: Minjiang fault; LJG: Laojungou granite (Mesozoic granite); XLB: Xuelongbao complex (Neoproterozoic metamorphic complex); PG: Pengguan complex (Neoproterozoic metamorphic complex); SB: Sichuan Basin; Red dashed line L0: A profile line; Blue triangle: Seismic station. The red square is study area
In recent years, a series of work was carried out to study the internal crustal structures of the Longmenshan fault zone and the adjacent areas, including seismic travel time tomography (Lei et al., 2009; Wu et al., 2009; Li et al., 2011; Deng et al., 2014), S-wave velocity structure inversion (Li et al., 2009a; Liu et al., 2014), deep seismic reflection profile (Li et al., 2009b; Guo et al., 2013), wide-angle reflection/refraction seismic profile (Jia et al., 2014; Zhang et al., 2017), gravity and magnetic modeling (Tian et al., 2017; Xue et al., 2017), electrical detection (Zhao et al., 2012; Wang et al., 2014b), drilling exploration (Wang et al., 2016), etc. The results show that seismic wave velocity in the shallow layer of the Sichuan Basin is significantly lower than those in the Longmenshan fault zone and Songpan-Garzê block (Jia et al., 2014; Liu et al., 2018). And the thrust strongly uplifted the upper crust and crystalline basement under the central fault system of Longmenshan (Guo et al., 2013; Jia et al., 2014; Zhang et al., 2017). The seismic wave velocity structure also revealed that the high-velocity anomalous zone in the upper and middle crust of Longmenshan blocked the low-velocity material come from the interior of the plateau, which leads to strain accumulation and controls the direction of earthquake occurrence and rupture propagation (Lei et al., 2009; Wu et al., 2009; Li et al., 2011; Deng et al., 2014; Li et al., 2019). The middle and lower crust of the Longmenshan fault zone near the Songpan-Garzê area is characterized by low and medium wave velocity while high velocity below the Sichuan Basin, and the weak zone thickening towards the Sichuan Basin in the deep crust was interpreted as a channel flow (Li et al., 2009a; Liu et al., 2014). It’s worth noting that most of these studies concentrated on large-scale regional problems.
Due to the rich information of the underground media contained in the seismic ambient noise, researchers have proposed seismic ambient noise imaging technique for 3D velocity structure imaging (Claerbout, 1968; Michel and Anne, 2003; Roux et al., 2005; Shapiro et al., 2005; Yao et al., 2006). This imaging method is not limited by seismic sources with the advantages of low requirements, high efficiency and high imaging resolution. Nowadays, it has been widely applied to revealing the fine velocity structure at the junction of Songpan-Garzê block and Sichuan Basin, which plays an important role in studying the mechanism of earthquakes in Longmenshan fault zone (Li et al., 2010; Chen et al., 2015). However, the previous researches also focused more on the deep crust and mantle velocity structures, but less on the shallow fine velocity structure with high imaging spatial resolution. In recent years, short period ambient noise tomography (~1 s, station spacing less than 10 km) has been proposed with the improvement of seismic instruments and gradually applied to high-resolution shallow velocity structure imaging, which proved that ambient noise tomography can be developed from large-scale research (hundreds of kilometers) to small-scale research (hundreds of meters) (Lin et al., 2010; Hannemann et al., 2014; Wang et al., 2018).
The purpose of our study is to obtain the fine velocity structure of the middle section in the Longmenshan fault zone and the adjacent areas. The research steps include background noise data pre-processing, cross-correlation calculation, phase velocity dispersion curves extraction of Rayleigh wave, and S-wave velocity structure inversion (Bensen et al., 2007). In the inversion process, the direct inversion method of surface-wave dispersion was used to minimize the influence of complex terrain (Fang et al., 2015).
2.
Data and methods
2.1
Station distribution and data collection
In our study, the data were recorded by an array of 52 EPS-2 instruments deployed across Longmenshan, with a runtime of up to 26 days (November 1 to November 26, 2017). The sampling frequency of the EPS-2 instrument is 100 Hz, and the frequency band width is 5 s−200 Hz. The array is almost perpendicular to the Longmenshan Range and extends from the Songpan-Garzê block to the edge of the Sichuan Basin (Figure 1). The distance between stations is about 2 km, and the total length of the array is about 150 km.
2.2
Ambient noise data processing
1) Data processing
In this study, ambient noise data collected needs a series of preprocessing before cross-correlation calculations. We truncated the continuous data of the vertical component to 1 hour per segment, remove the instrument response, eliminate the trend and the mean, and resampled to 50 Hz. Then the noise data were filtered to a bandpass range of 0.1−2 Hz with spectral whitening and temporal one-bit normalization (Bensen et al., 2007).
2) Cross-correlation function calculating
Assuming that vA(t) and vB(t) represent the seismic ambient noise data recorded by two stations A and B, the cross-correlation function between the two stations A and B can be written as equation (1). t0 is the length of time for the cross-correlation calculation.
cAB(t)=∫t00(vA(τ)vBt+τ)dτ.
(1)
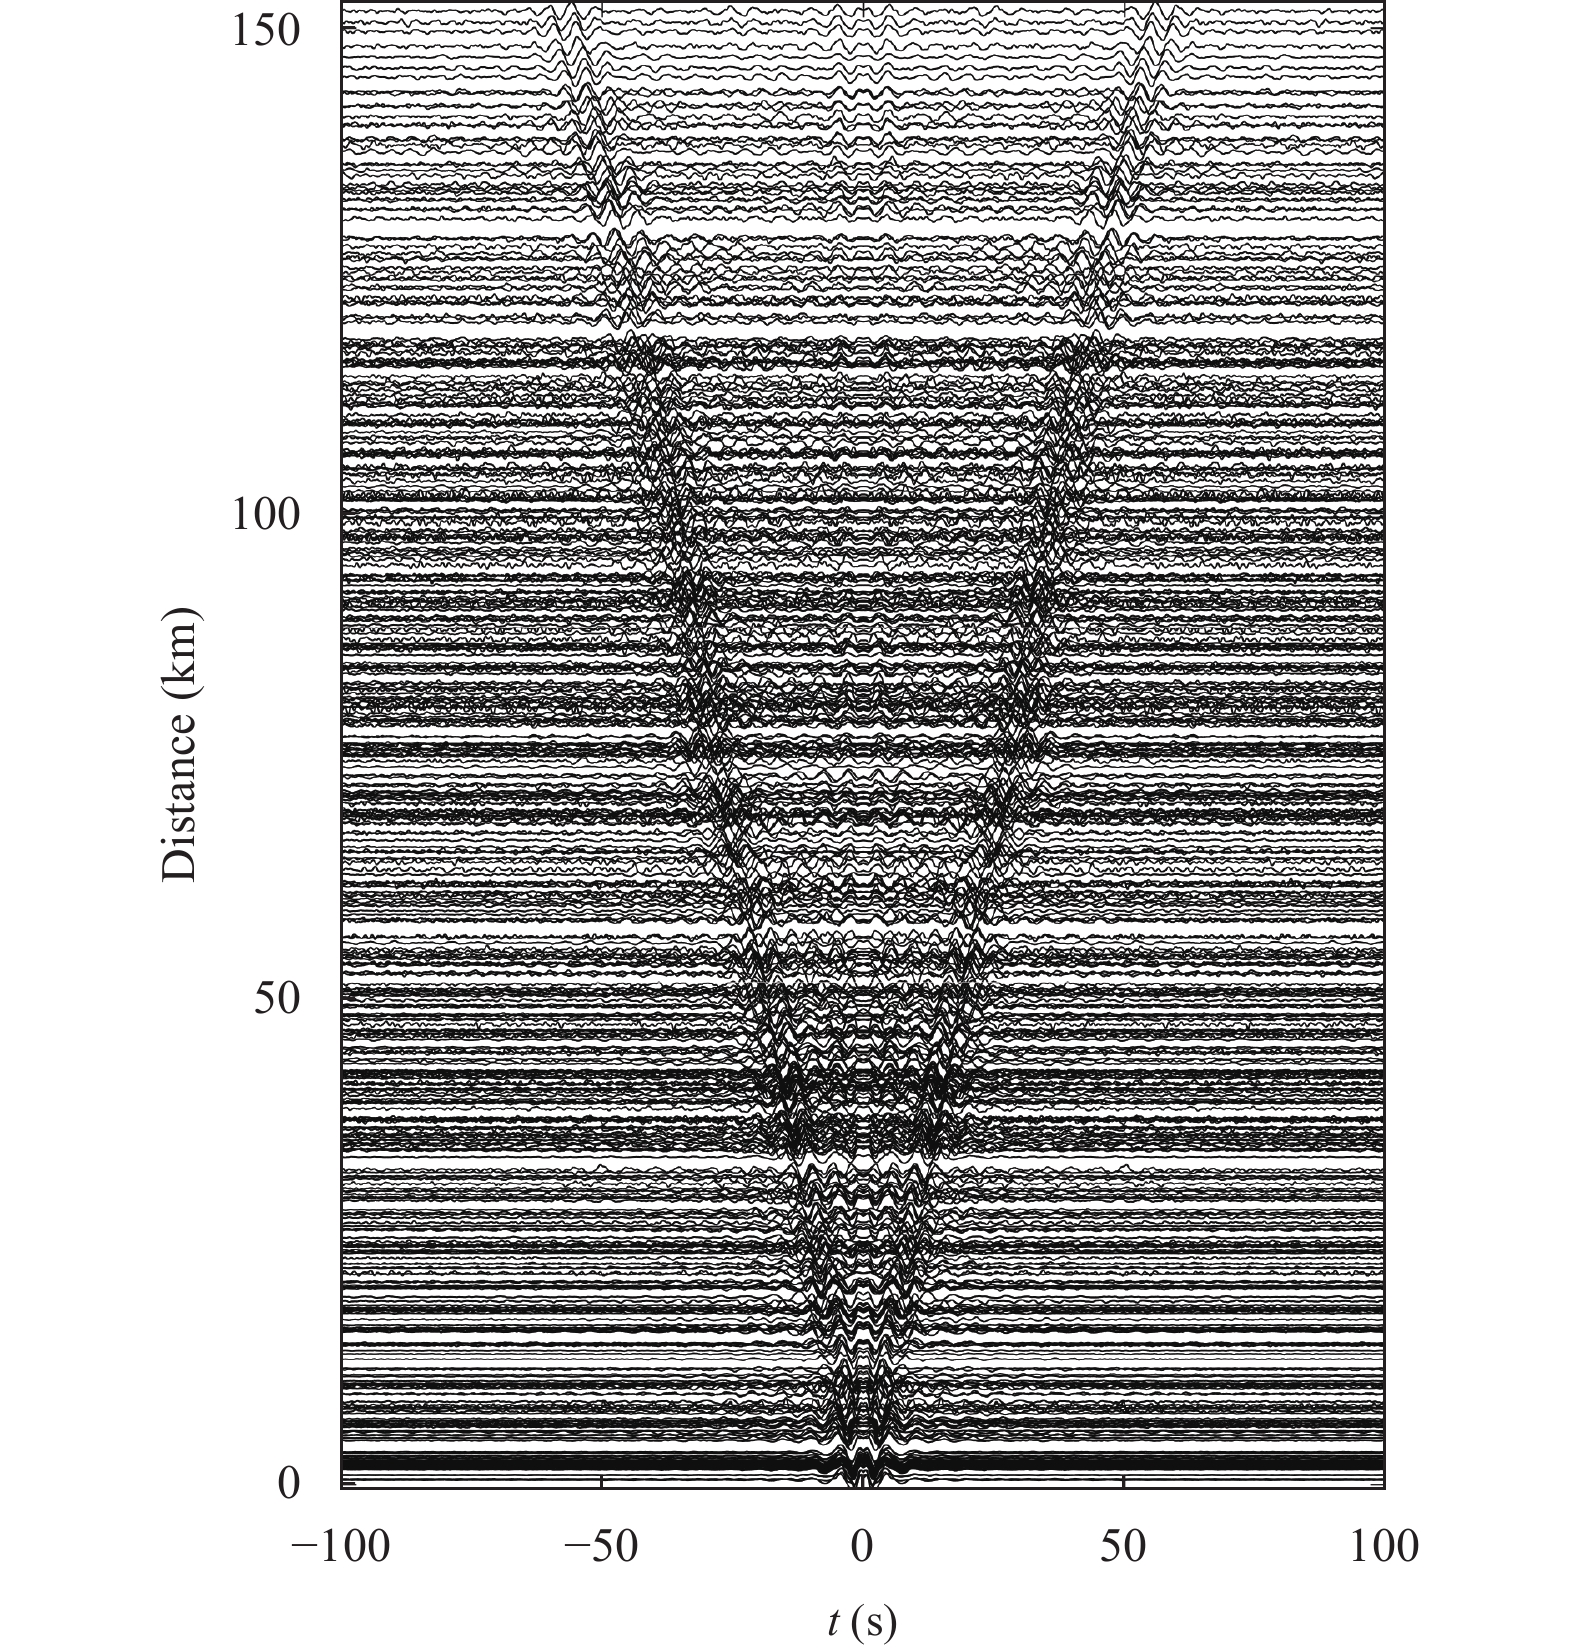
We calculated the cross-correlation functions (CFs) of the every hour's background noise data of different station pairs and superposed the CFs. The periods of CFs are 0.5 to 10 s, and the length is 100 s. The cross-correlation calculation results are shown in Figure 2.
Figure
2.
0.5−10 s interstation cross-correlation functions
3) The extraction of Rayleigh-wave phase velocity dispersions
The empirical Green's functions (EGFs) of the medium between stations can be calculated from the first-order time derivative of the CFs. In this study, the phase velocity dispersion curve was measured by using image transformation technique (Yao et al., 2005).
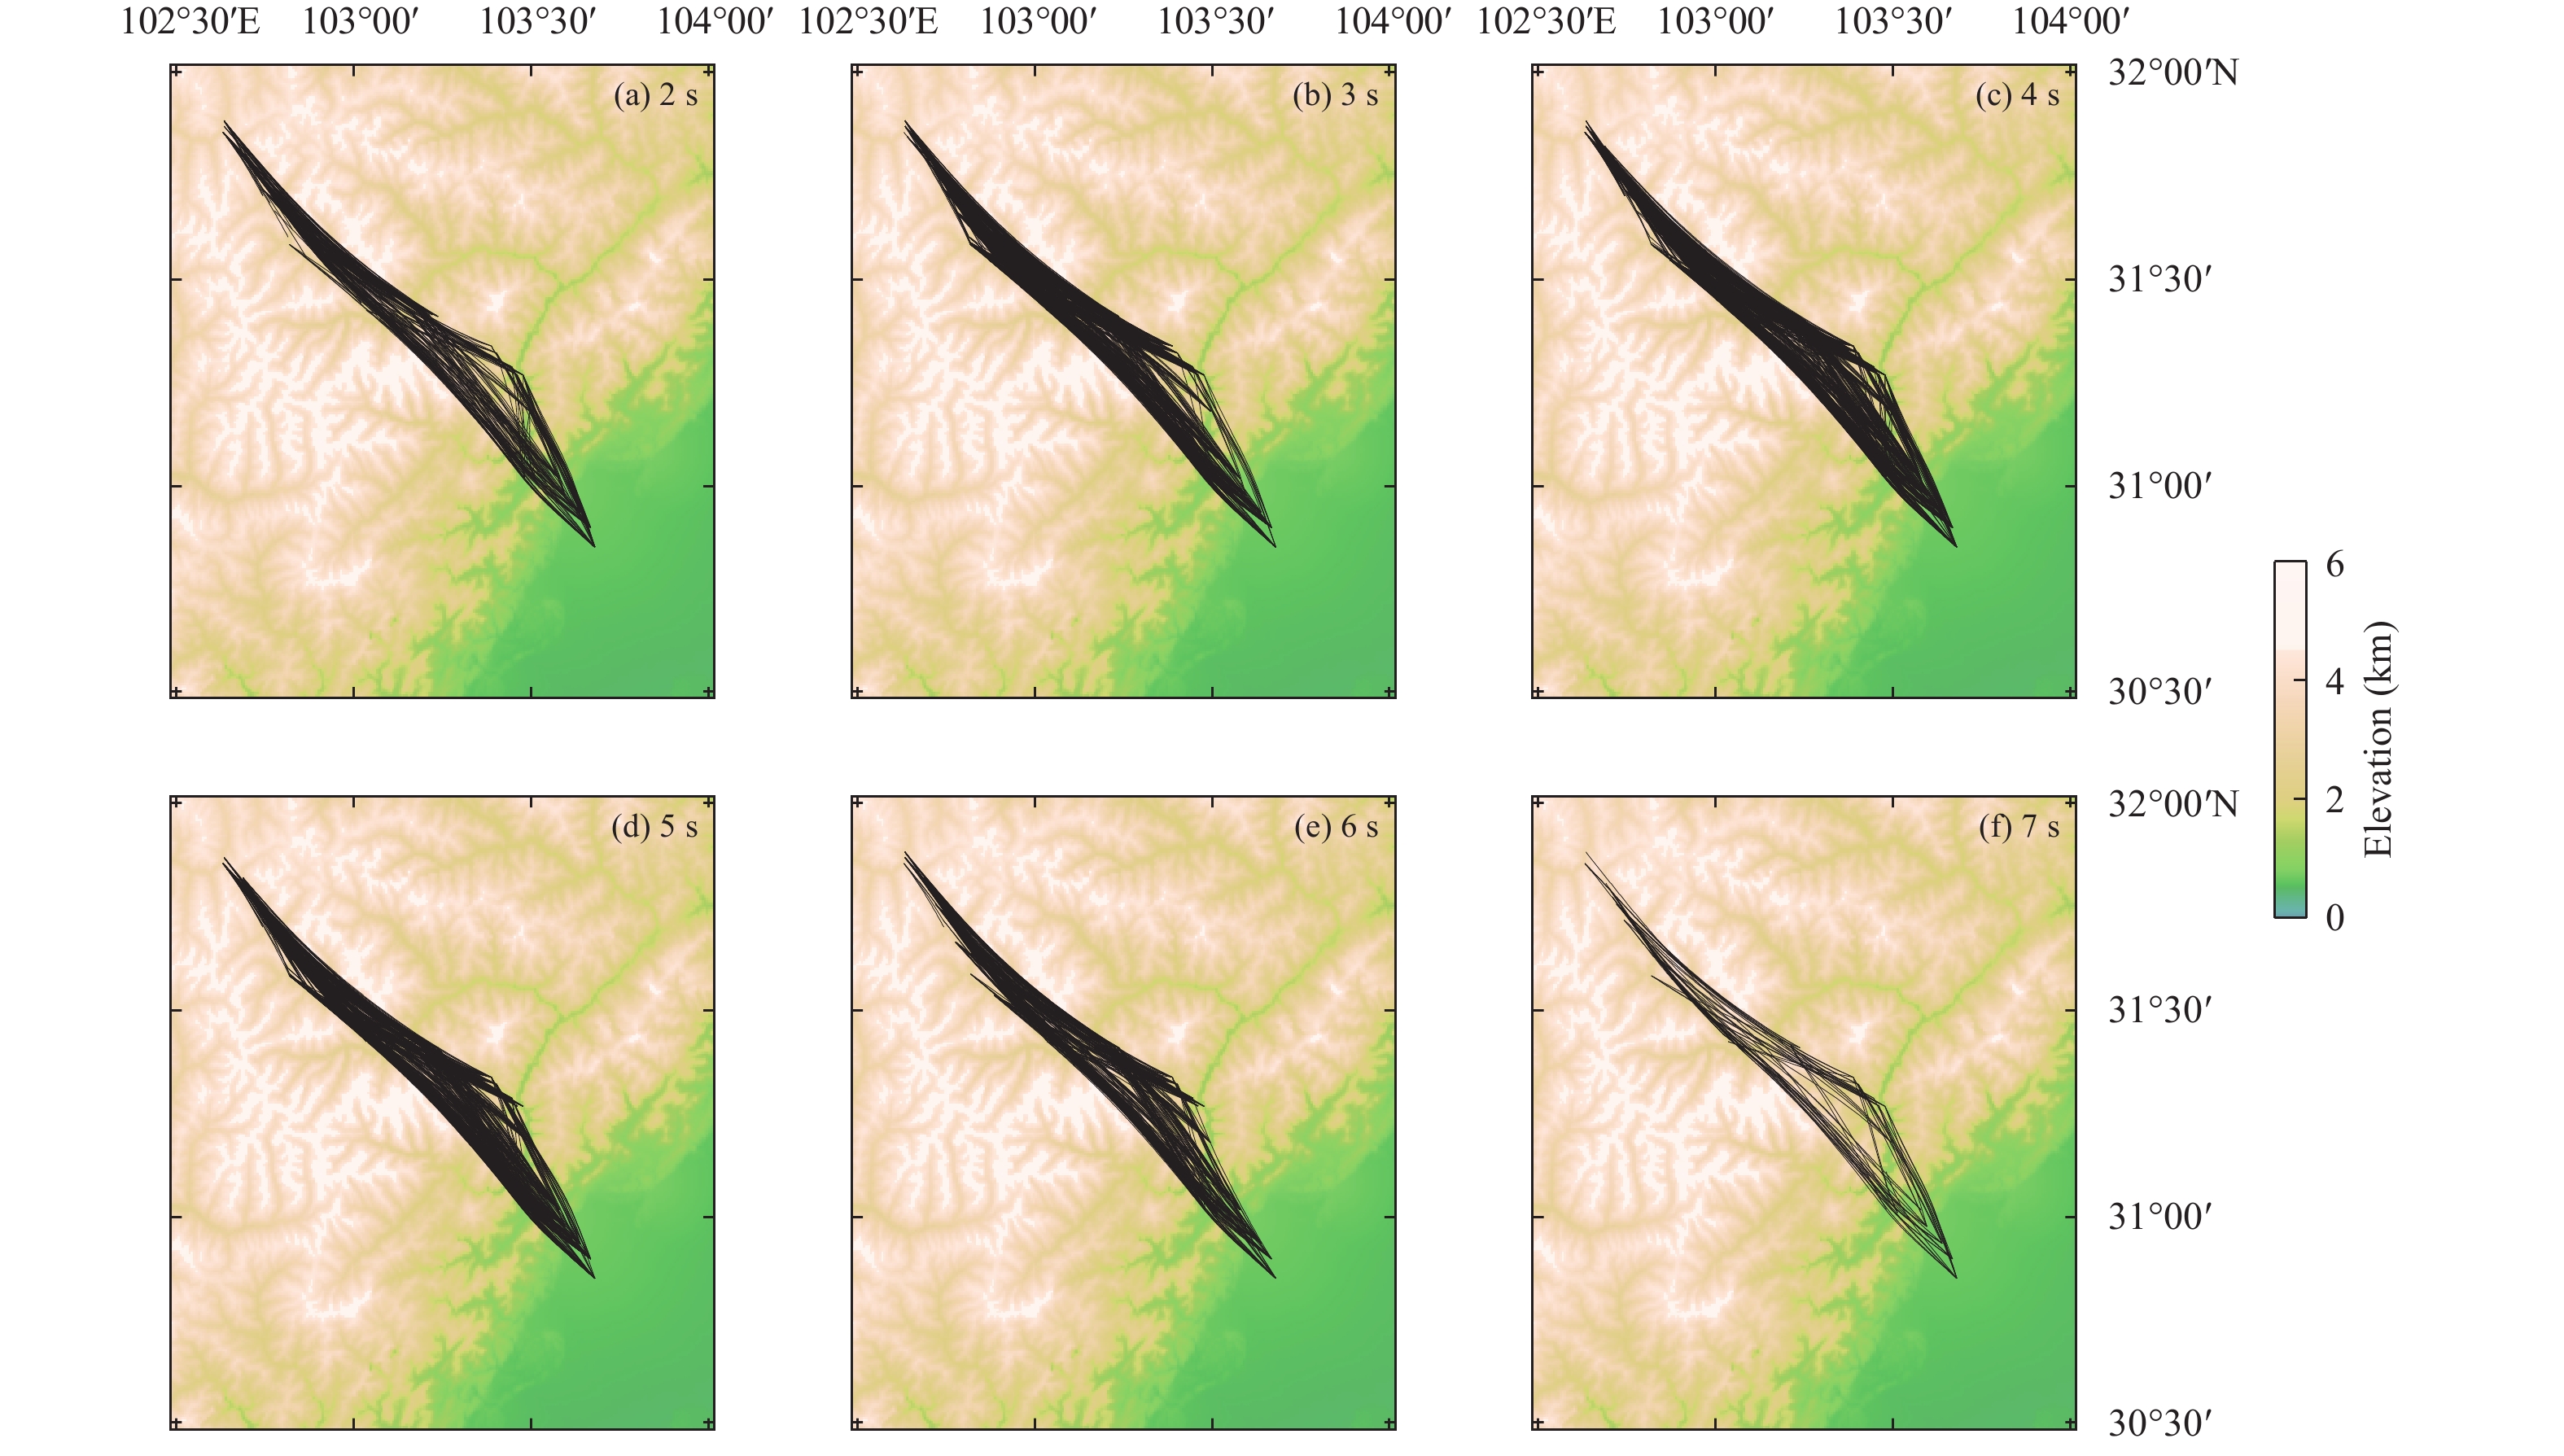
The study area crosses Longmenshan fault zone where the terrain is very complex, especially the elevation changes greatly. Therefore, in order to minimize the impact of elevation, we selected station pairs with a spacing greater than 6 times of the elevation when picking up the phase velocity dispersion curves of Rayleigh wave in the case of meeting the far-field conditions (cAB⋅T=λ≥Δ/3, where T is the period, λ is the wavelength, and Δ is the mesa pitch). And the signal-noise ration (SNR) is set to SNR > 5, so as to ensure the reliability of measurement.
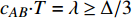
After sorting all the extracted dispersion curves and excluding the dispersion curves with poor quality, a total of 776 phase velocity dispersion curves were picked up with a period of 2−8 s, in which the minimum phase velocity is about 2 km/s and the maximum is about 3.5 km/s (Figure 3a). The ray path numbers of Rayleigh waves in different periods are shown in Figure 3b. Since the distance between the pairs of stations limits the ray coverage for long periods, only dispersion curves in the period of 2−7 s are used in this study in order to minimize the impact of the uneven data distribution.
Figure
3.
Phase velocity dispersion curves in the 2–8 s period band (a) and number of the ray paths of Rayleigh waves at different periods (b)
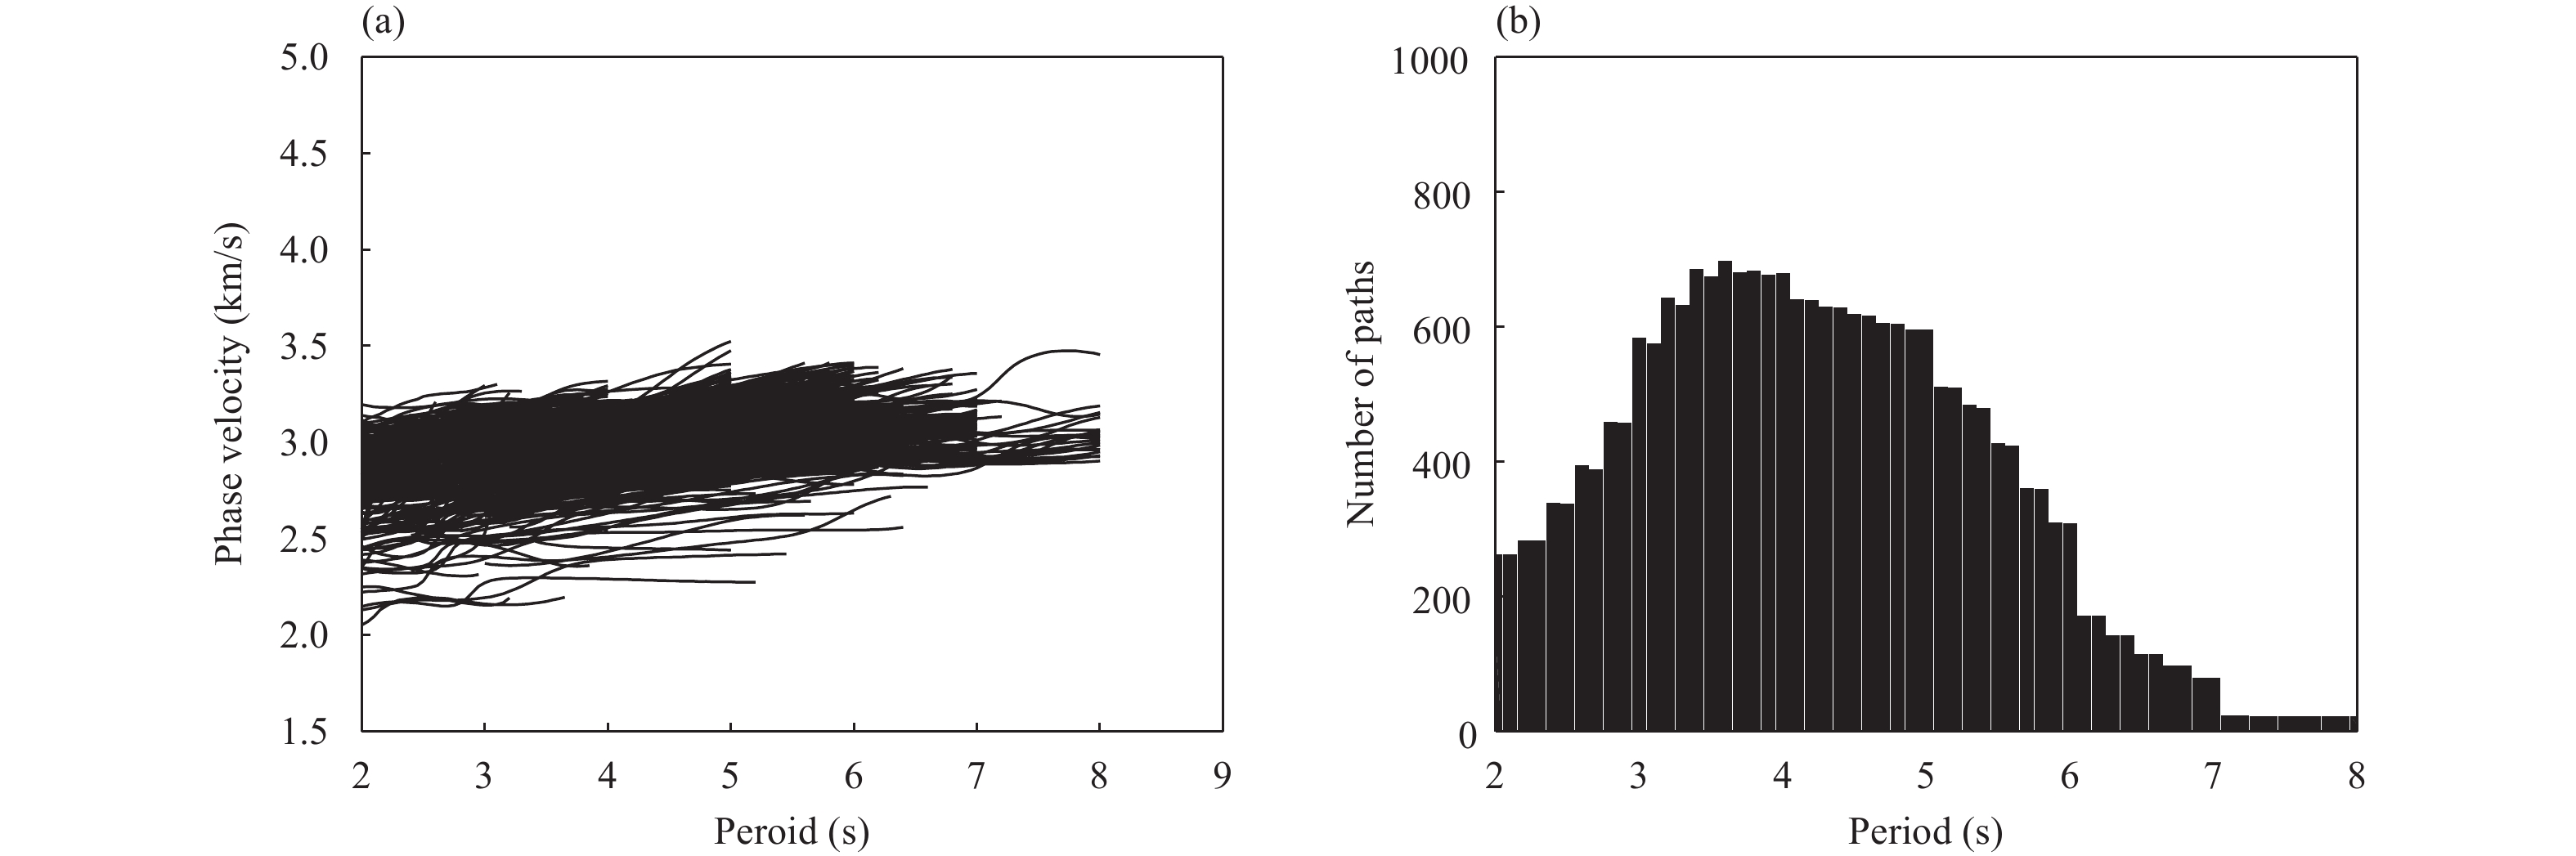
According to the ray paths distribution of Rayleigh wave phase velocity (Figure 4), it can be observed that the rays coverage in the 2−7 s period is sufficient, and the entire coverage area of the ray crosses the Longmenshan fault with showing a narrow-band shape.
Figure
4.
Different ray paths corresponding to different phase velocity periods (2−7 s)
3.
Direct inversion of Rayleigh-wave phase velocity dispersions
3.1
Resolution testing of the direct inversion
1) Checkerboard testing
Checkerboard testing was used to detect the lateral resolution of the direct inversion of phase velocity dispersion. The principle is that the theoretical travel time of each ray path at different periods is calculated according to the actual ray distribution which is based on the addition of positive and negative velocity anomalies to the initial velocity model, and then a certain random error is added to the theoretical travel time to invert and the inversion results are compared with the original velocity model.
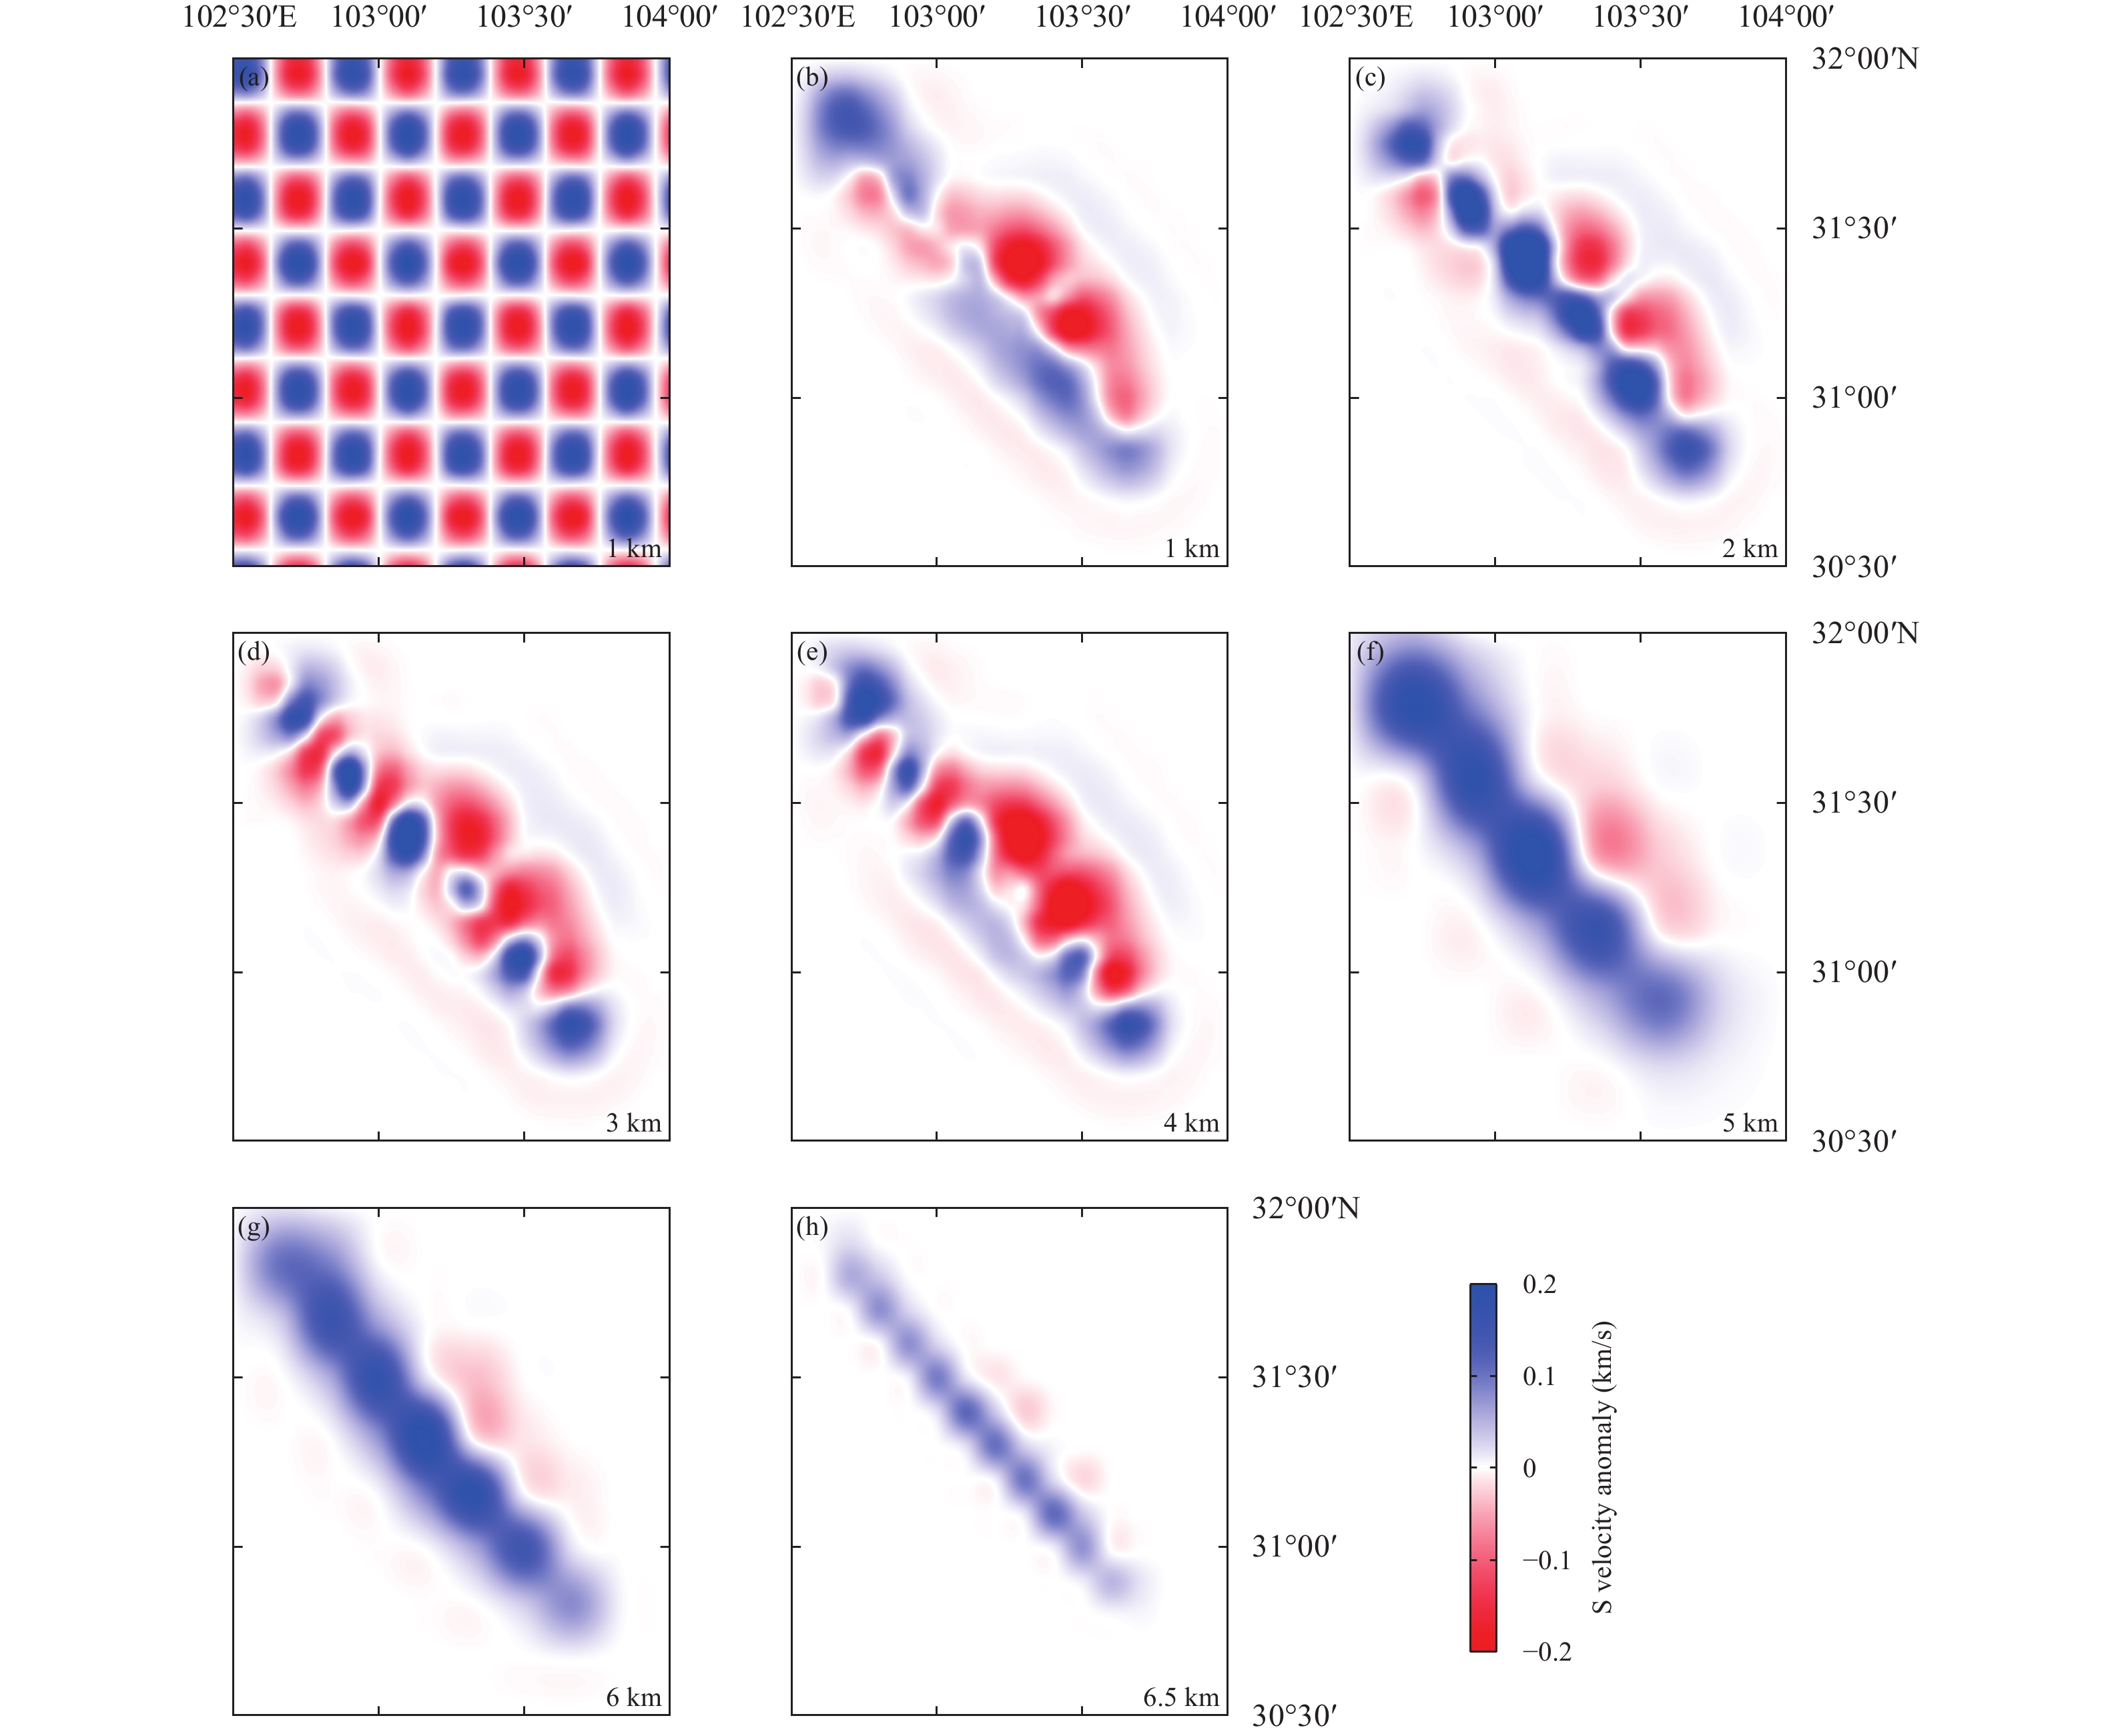
In the checkerboard testing, the study area was discretized into a 0.03°×0.03° grid, and the sampling interval of the Rayleigh-wave dispersion curves was set to 0.1 s. The depth of the initial velocity model ranges from 0 to 7 km with a 0.3 km/s velocity increase per kilometer and the velocity is 1.5 km/s at 0 km. For the initial velocity values of different depths, a velocity disturbance of sinusaidal fitribution is added, and the maximum absolute value is 0.2 km/s (Figure 5a). According to the recovered results (Figures 5b-5h), it can be seen that the imaging resolution is usually better in the areas covered by denser ray paths. And the theoretical velocity anomaly can be recovered better at the depth of 1–6 km than at other depth. In addition, the checkerboard testing results show that the reliable area for ambient noise imaging is narrow and perpendicular to the Longmenshan fault zone, because the stations are almost distributed on a line perpendicular to the mountain range.
Figure
5.
The results of checkerboard testing. (a) The input modle; (b−h) The output models at depths of 1, 2, 3, 4, 5, 6 and 6.5 km, respectively
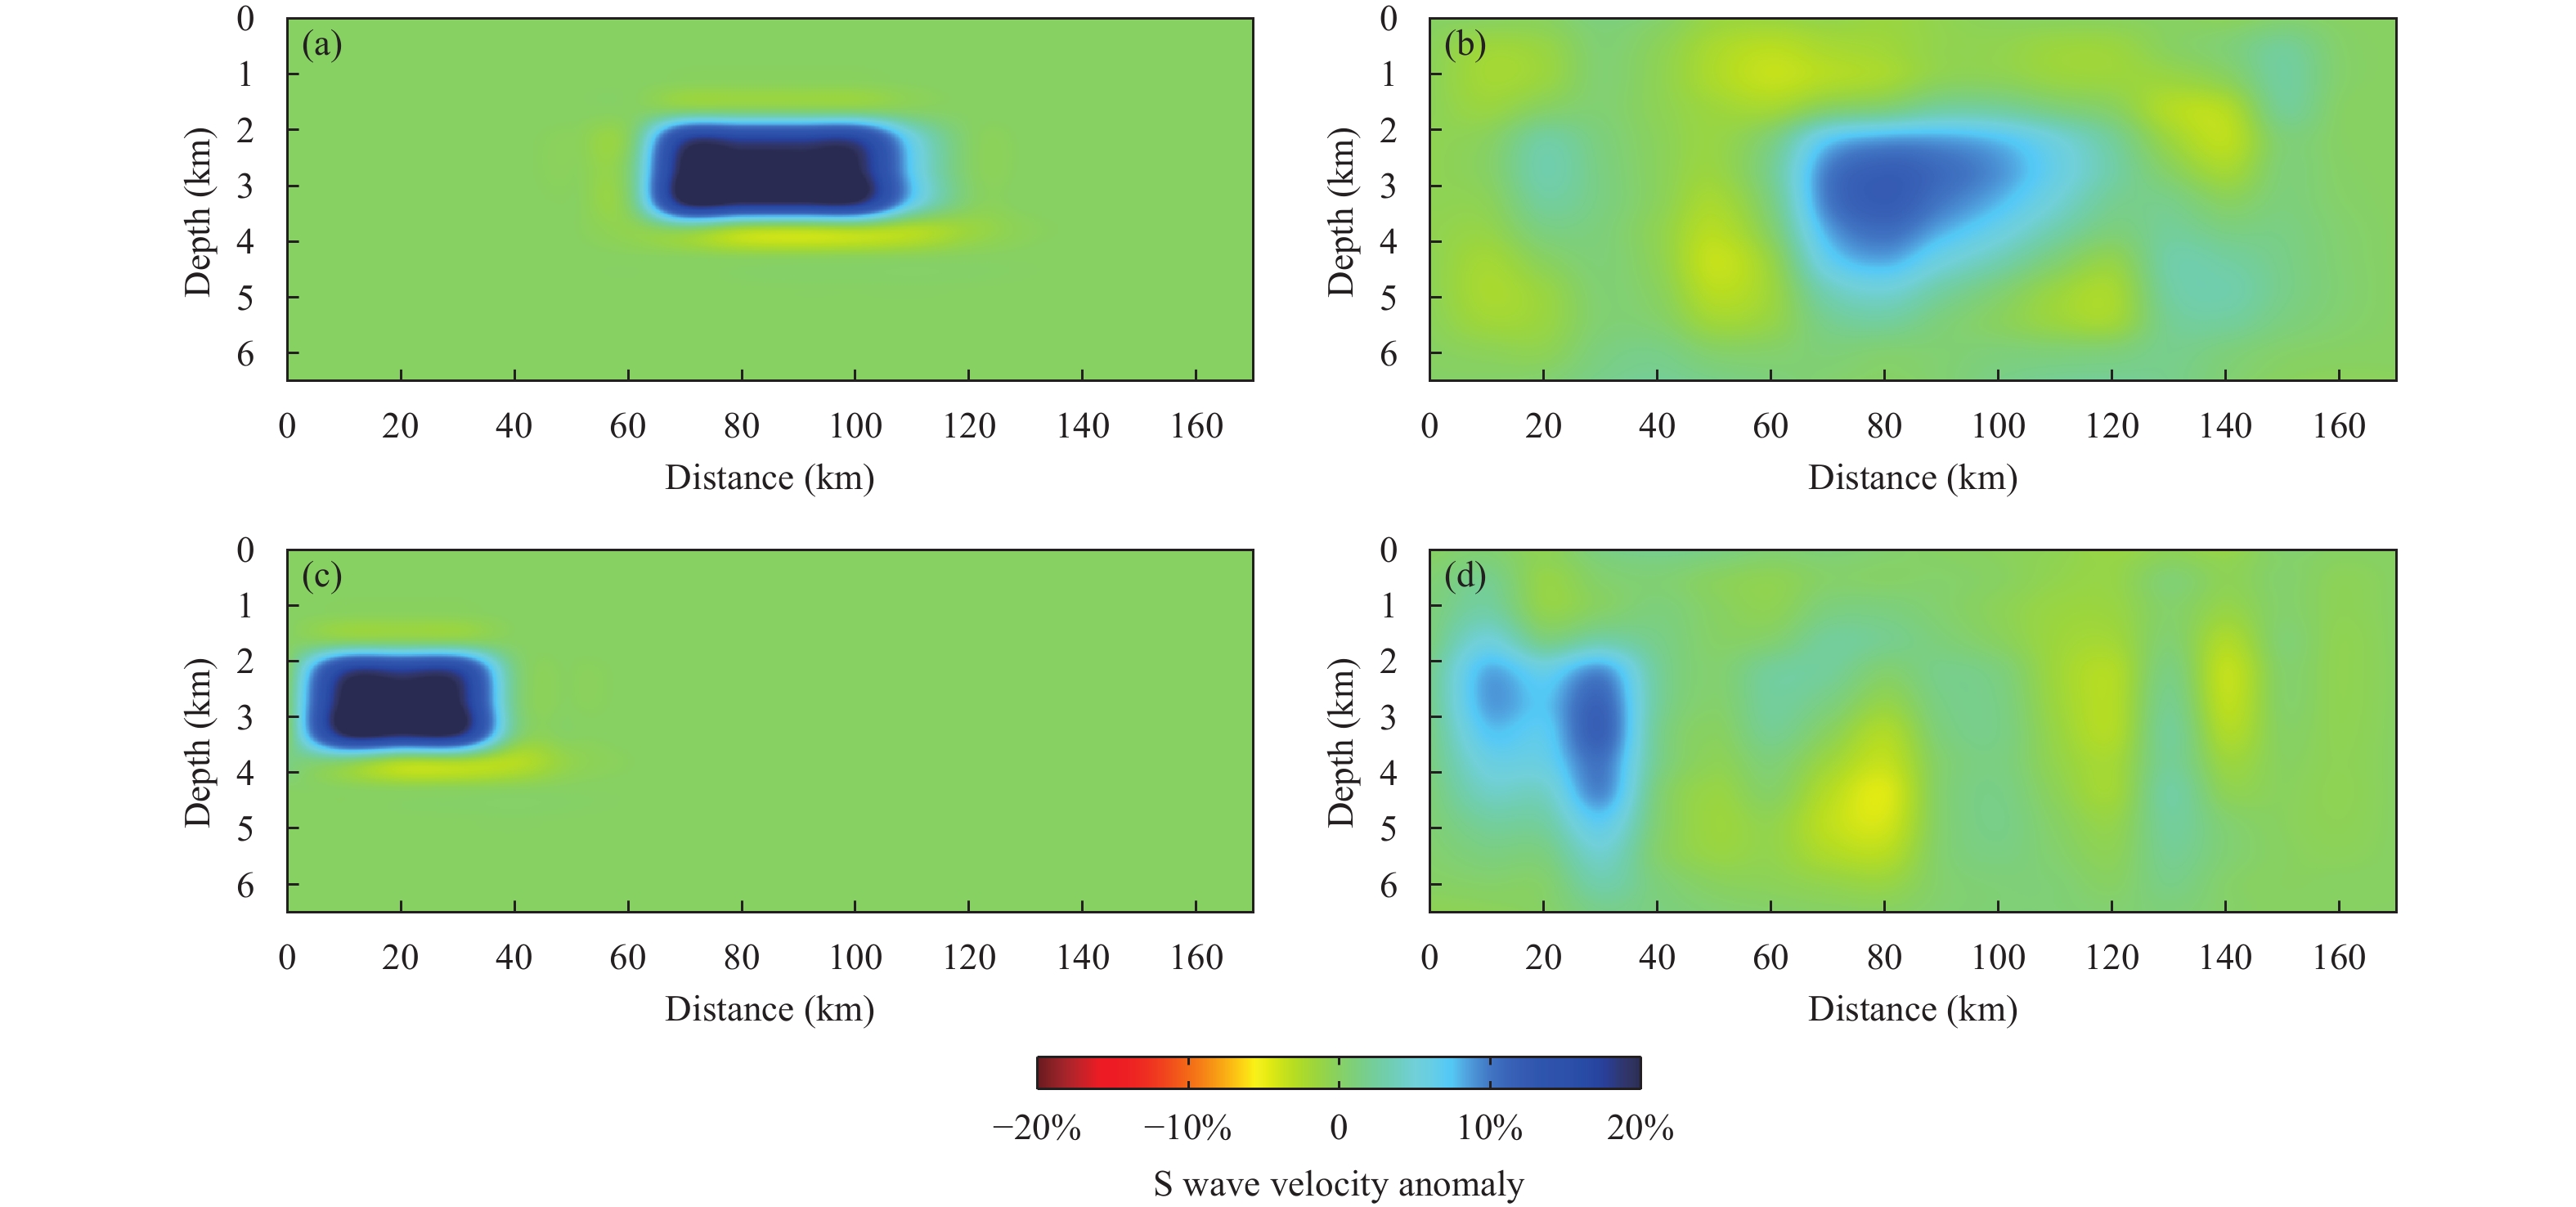
In order to detect the longitudinal resolution of the direct inversion method, a model test method was used in this study. The input models are plate-shaped anomalies in the L0 profile with a velocity anomaly value is 20% as shown in Figures 6a and 6c. The inversion results in Figures 6b and 6d both show that the method can better reconstruct the velocity anomaly with thickness of ~1.5 km, that is, the velocity anomalies with a thickness of at least 1.5 km and above can be distinguished well in this study. And no matter in the margin of the model with sparse rays or in the center of the model with dense rays, the model testing results both show that the anomalies are recovered well.
Figure
6.
Model testing of the L0 profile shown in Figure 1. (a) and (c) show the input models at the middle and edge of the L0 profile respectively; (b) and (d) show the output models of model testing corresponding to the input models (a) and (c)
We use the direct inversion method of surface wave dispersion for three-dimensional shallow crustal structure. Based on using frequency-dependent ray tracing and a wavelet-based sparsity-constrained tomographic technique, this method omits the construction of 2-D phase (or group) velocity maps and avoids the assumption of great-circle propagation (Fang et al., 2015).
The study area (102.5° E−104° E, 30.5° N−32° N) was divided into 53×53 grids with a grid spacing of 0.03°×0.03° in the horizontal direction to make sure that all the sources and receivers are in the region, and 24 layers in the depth direction with intervals ranging from 0.2 to 0.5 km. The initial velocity model is consistent with the initial velocity model tested by the checkerboard.
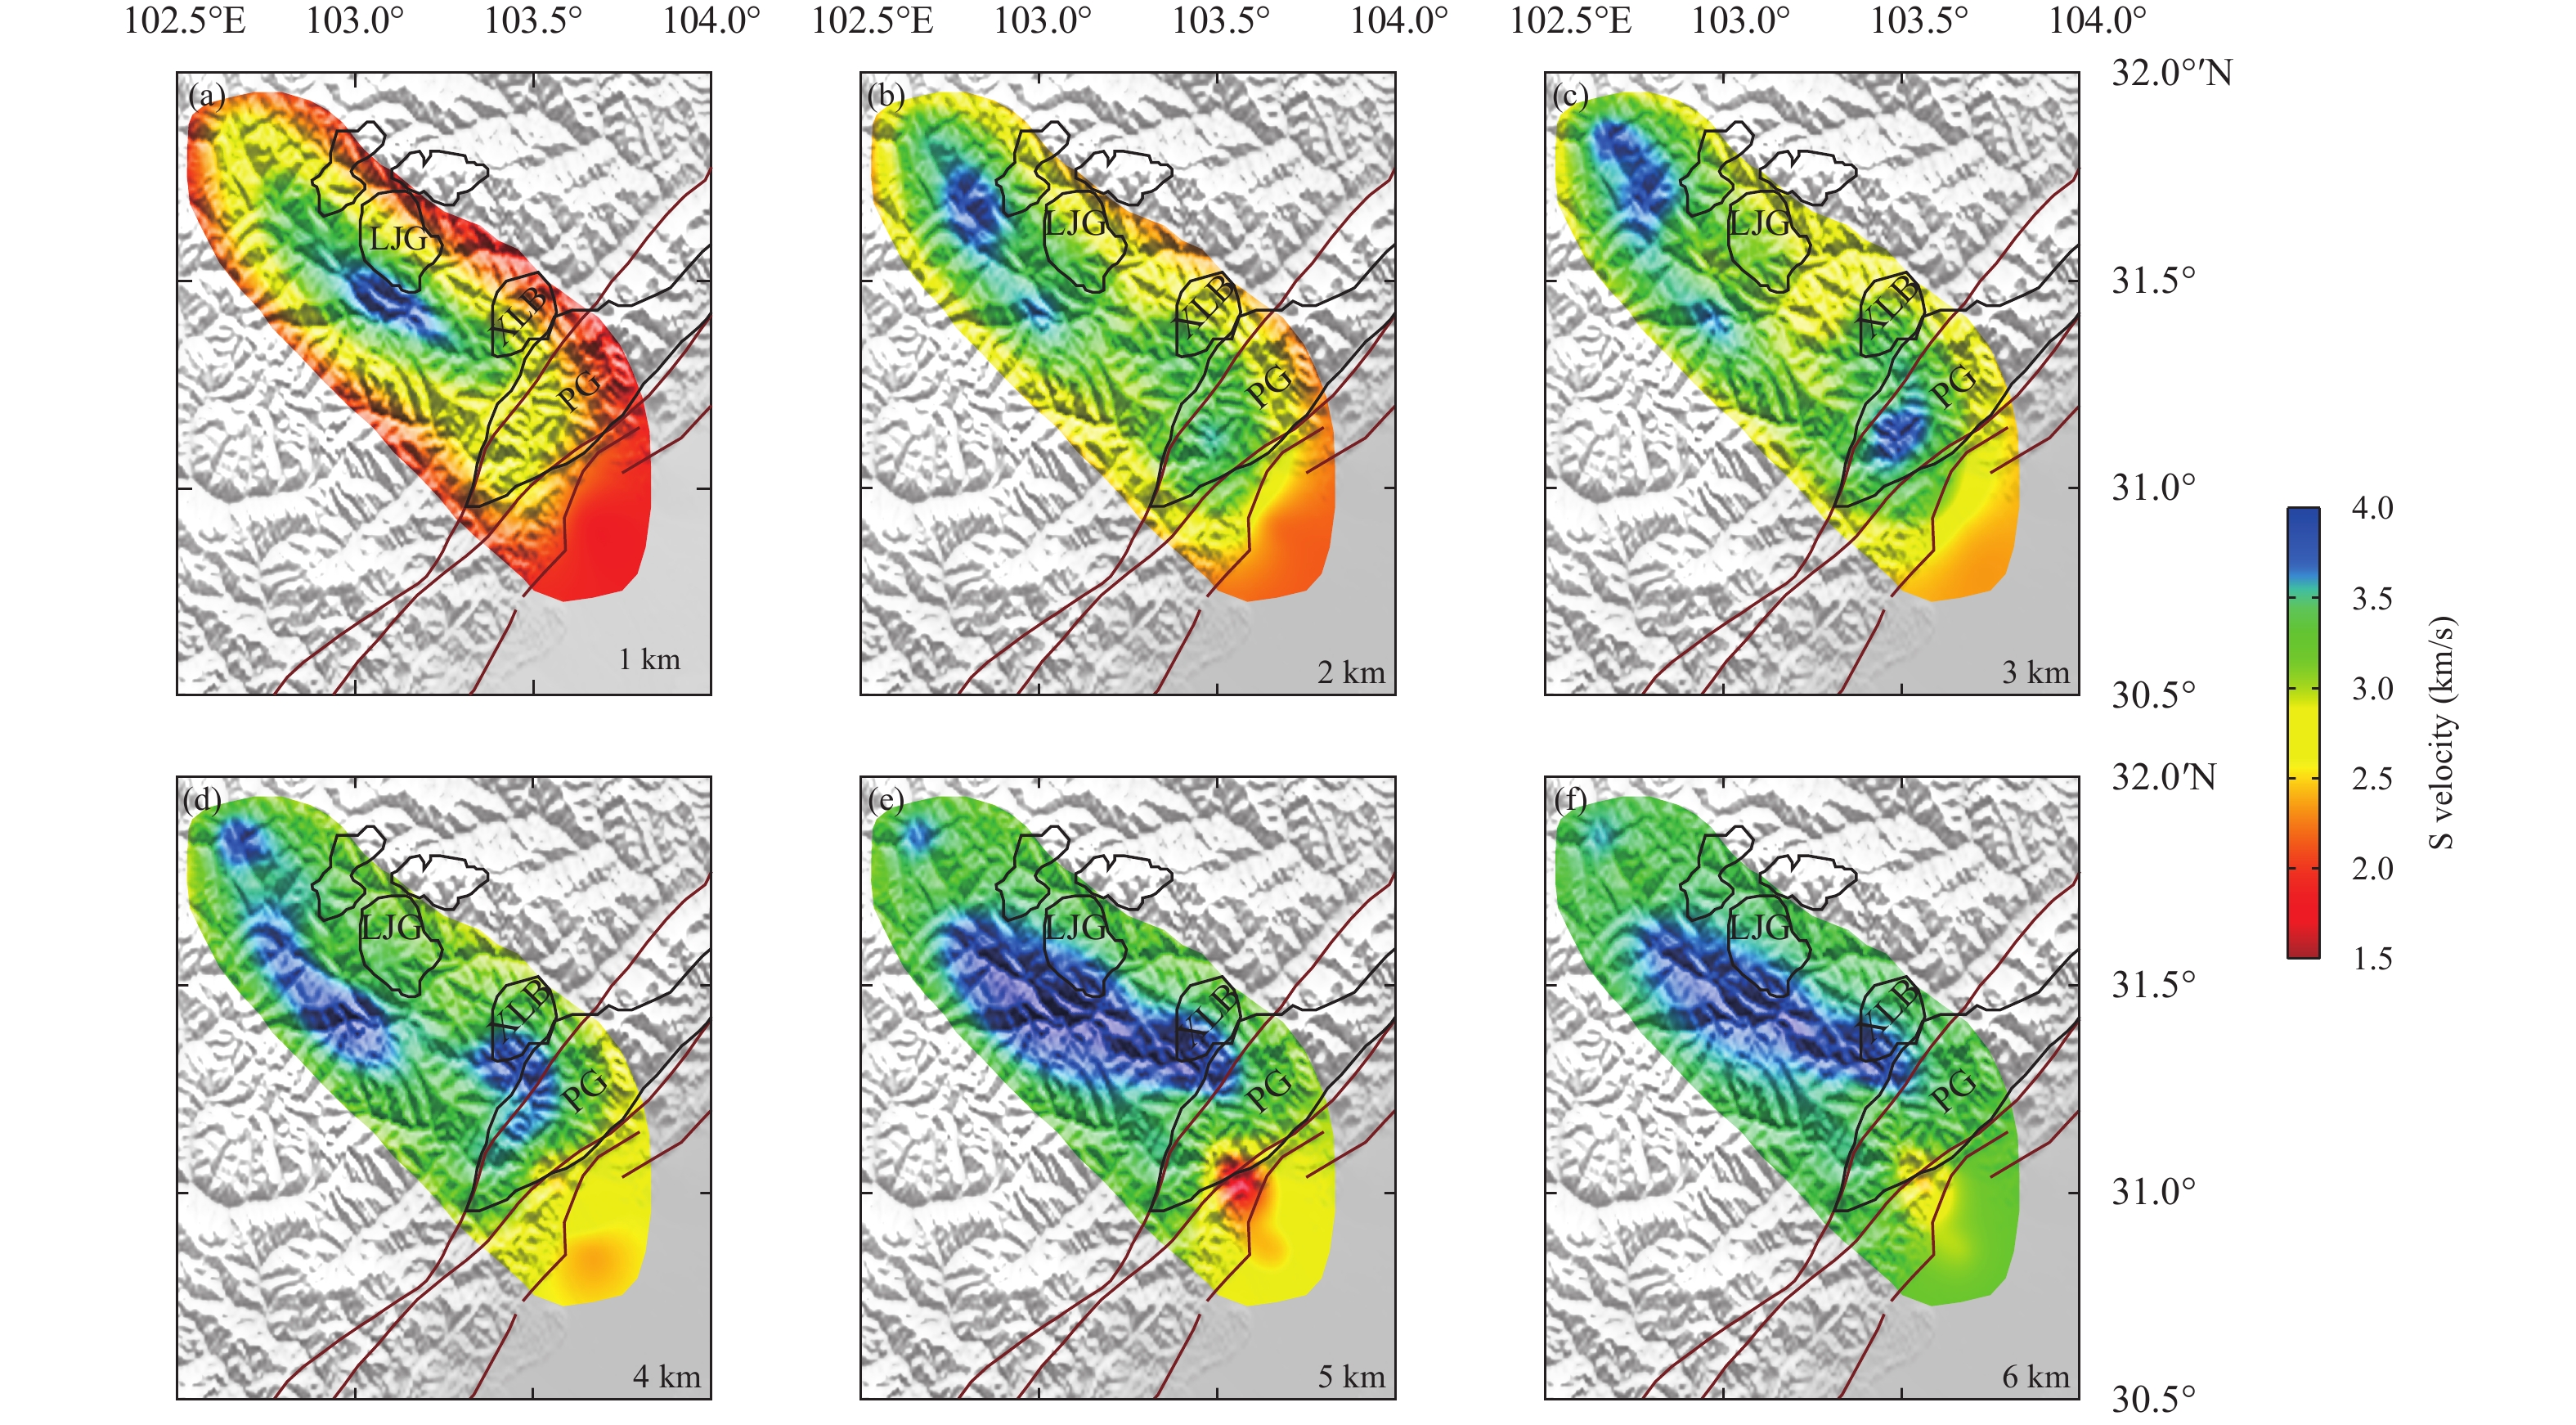
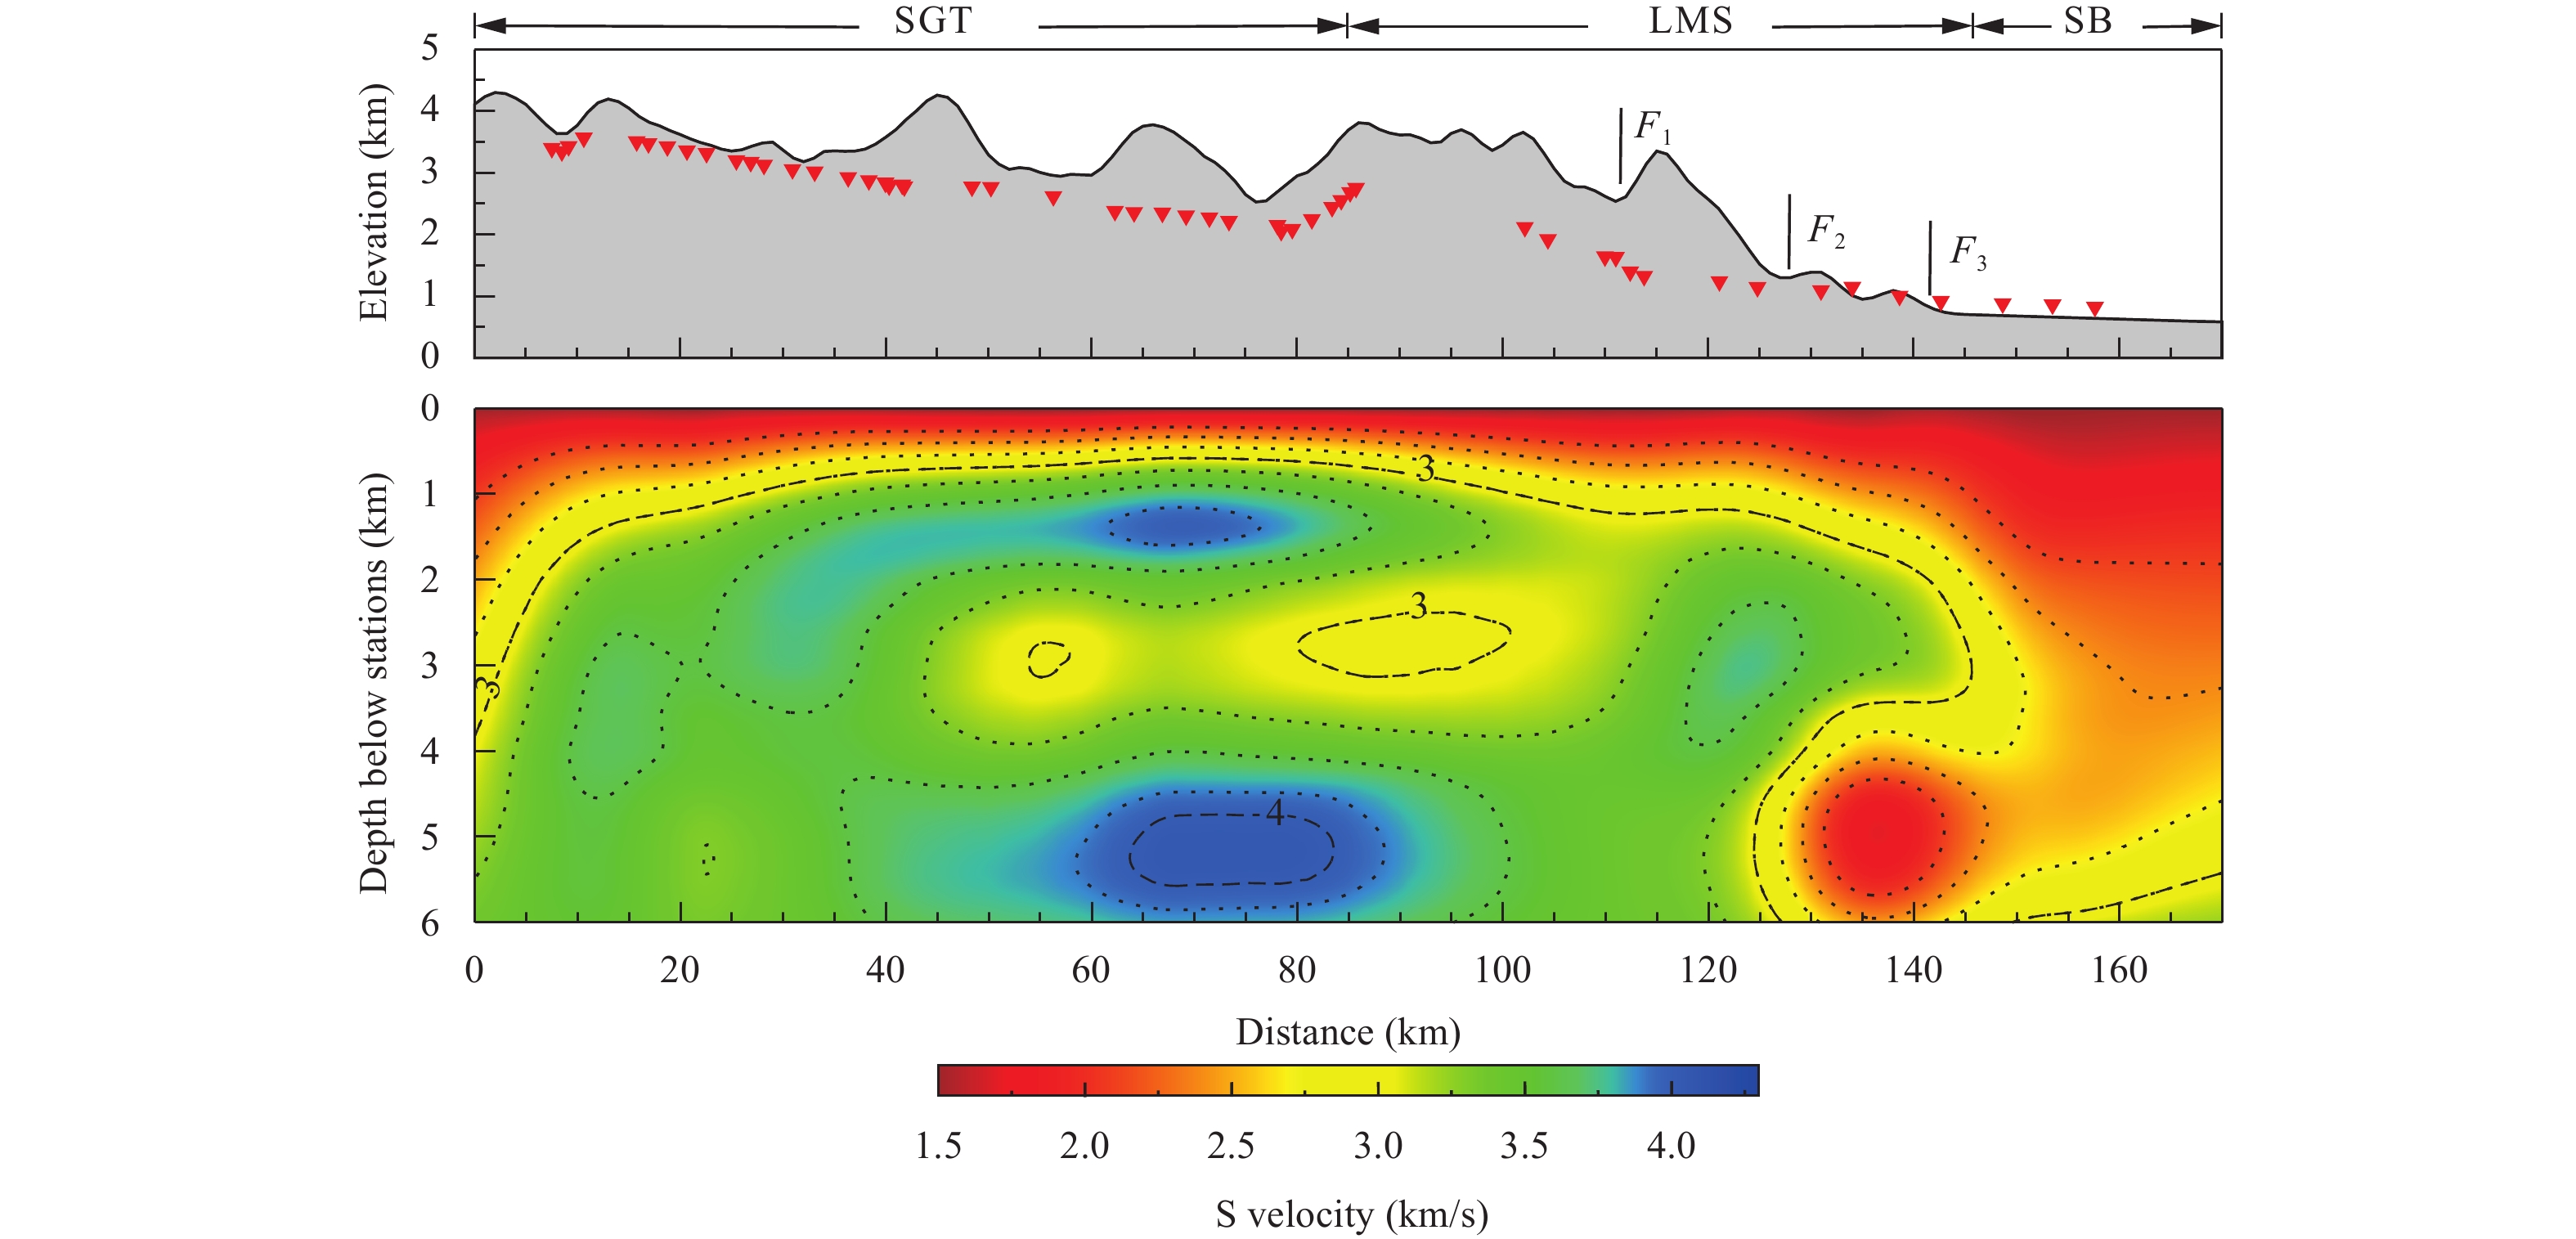
According to the results of checkerboard testing, we set reasonable parameters in the direct inversion programs (Fang et al., 2015). The maximum number of iterations, the balancing parameter between data fitting term and smoothing regularization term (‘weight’), the input parameter for LSQR (‘damp’) and the sparsity fraction parameter were set to 10, 4.0, 0.1 and 0.2, respectively. In the inversion process, an iteratively reweighted least squares algorithm is used to estimate the wavelet coefficients of the velocity model, and the new velocity model is used to update the surface wave ray paths and data sensitivity matrix in each iteration. In our iterative, the standard deviation of the travel time residuals is reduced from 1.06 to 0.63 s, and the average residual of the final velocity model is 0.0032 s. Finally, based on the dispersion curves of surface wave phase velocity in 2−7 s with an interval of 0.1 s, we obtained the 3D shear wave velocity structure under the middle section of Longmenshan fault zone by using the direct inversion method. And we assumed that the depth at each station is 0 km. Figure 7 shows the S-wave velocity slices at different depths (1, 2, 3, 4, 5, 6 km). we can clearly distinguish that the high-velocity anomalies correspond to Longmenshan fault zone and Songpan-Garzê block, while the low-velocity anomalies mainly correspond to Sichuan Basin at every depth. The inversion results along the L0 profile (Figure 8) clearly shows the distribution of anomalies in the vertical direction.
Figure
7.
Shallow shear wave velocity structure slices at different depths of 1, 2, 3, 4, 5, 6 km across the middle of LMSZ and the nearby areas
Using the method of short period ambient noise tomography, we obtained the vS structure images in the depth range of 0−6 km in the middle section of Longmenshan fault zone. The horizontal resolution of the imaging results is about 10 km, and the vertical resolution is about 1.5 km.
As it is shown in the Figures 7a−7f, the S-wave velocity within 0−6 km depth is significantly beneath the Sichuan Basin lower than that beneath the Longmenshan fault zone and the Songpan-Garzê block. And as the depth increases, the clear boundary of the low-velocity structure gradually approaches F1 from F3 (Figure 1). Geological exploration data, borehole logging data, and seismic reflection profiles all show that the Sichuan Basin has been in a stable sedimentary environment since the Late Paleozoic so that it covered by >10 km Sinian to Quaternary sedimentary deposits (Burchfiel et al., 1995; Jia et al., 2006; Wang et al., 2014a). To the east of the Longmenshan fault zone, the sedimentary thickness of the Sichuan foreland basin is also greater than 4 km (Li et al., 2003; Jia et al., 2006), so we interpret the shallow low-velocity structure below the Sichuan Basin in our results as thick sedimentary layers.
However, obvious high-velocity structures can be observed in Longmenshan fault zone and Songpan-Garzê area (Figures 7a−f). The high-velocity structure below Longmenshan fault zone may be closely related to the Pengguan complex body (Neoproterozoic granite) where the Wenchuan earthquake occurred. Taken the WFSD-2 drill hole located on the Yingxiu-Beichuan fault as the object, the core can be divided into six segments including three sections of the Pengguan complex which is the product of melt-mixing of mantle-derived magma with underplating and lower crust material (0−599.31 m, 1211.49−1679.51 m, 1715.48−2081.47 m) (Zhang et al., 2012; Lu et al., 2014). The strong compression between the Tibetan Plateau and the Sichuan Basin caused the high-pressure rock mass in the lower crust to migrate to the shallow layer and become an isolated Pengguan complex with high density (2.75 g/cm3), whose boundary corresponds to the boundary of velocity change (Burchfiel et al., 2008; Pei et al., 2014; Airaghi et al., 2017). The high-velocity anomalies (Figure 7a-7d) beneath the Songpan-Garzê fold belt may be attributed to the Mesozoic granite intrusions such as the Laojungu rock bodies mainly composed of diorite granite and monzogranite produced in the late Indosinian and Yanshanian periods (Hu et al., 2005; Zhao et al., 2007; Yuan et al., 2010; Xue et al., 2017).
According to the distribution of the stations, the S-wave velocity structure of the L0 profile across the Longmenshan fault zone was obtained (Figure 8) to reveal the vertical characters. At a depth of 0−6 km below the Sichuan foreland basin, sedimentary cover results in the low S-wave velocity structure (Jia et al., 2006; Li et al., 2009a; Chen et al., 2015). The high-velocity structure below the Longmenshan fault zone thrusts over the Sichuan Basin, which is consistent with the research results of the wide-angle reflection/refraction seismic profile. Originated from the deep crust, the Proterozoic granite (Pengguan complex) thrusts from the deep to the shallow, making the surface P-wave velocity up to 6 km/s (Jia et al., 2014; Zhang et al., 2017). And the comprehensive results of gravity profile, seismic profile and other geological studies indicate that there are high-density anomalies with the same thrusted/imbricated pattern as the Pengguan complex under the Songpan-Garzê fold belt near the middle part of Longmenshan. And it is considered to be equivalent to the Pengguan complex covered by Paleozoic sediments, which is produced by continuous crustal shortening and basement extrusion (Roger et al., 2004; Guo et al., 2013; De Sigoyer et al., 2014; Xue et al., 2017). Accordingly, the high-velocity anomaly ~4.5−6 km beneath the Songpan-Garzê fold belt indicates the shallow location of the hidden high-density body in the northwest of the Pengguan complex. There is also a high-velocity anomaly (~1−2 km) below the Songpan-Garzê block, which is very close to the location of the Laojungou granite (LJG in Figure 1). Previous studies revealed that the Mesozoic granites such as Laojungou granites are widely intruded into the lower-velocity Triassic turbidite deposits in the Songpan-Garzê area which may be caused by the delamination of thickened lithosphere or the underplating of mantle derived material in Songpan-Garzê area (Zhao et al., 2007; Yuan et al., 2010; Jia et al., 2014; Zhang et al., 2017). Therefore, we speculate that the high-velocity anomalous body may correspond to the Laojungou rock bodies in the Songpan-Garzê area. But we cannot describe the specific 3D shapes of the high-velocity anomalies due to the limitation of the stations’ distribution.
5.
Conclusions
Using the ambient noise tomography method to process the noise data recorded by a short-period dense array (52 EPS-2 instruments) across the Longmenshan in November 2017, we obtained the S-wave velocity structure of 0−6 km below the Longmenshan fault zone and the adjacent area with a vertical resolution of 1−2 km. On the east side of the middle part of Longmenshan fault zone, the S-wave velocity structure reveals that the sedimentary layer in the Sichuan foreland basin is thicker than 5 km. The high-velocity structural morphology ~2−4 km below Longmenshan fault zone describes the thrust overthrust of the high-density Pengguan complex clearly. And the high-velocity anomaly ~4.5−6 km below the Songpan-Garzê fold belt proves the existence of an equivalent of the Pengguan complex. The high-velocity anomaly ~1−2 km below the Songpan-Garzê block probably reflect the distribution of Laojungou granites in this area. Our high-resolution S-wave velocity structure with clear boundaries corresponds well to the geological conditions in the middle section of the Longmenshan fault zone and adjacent areas, providing a certain reference for the fine research work in the shallow layer of the area. However, the restrictions on the distribution of stations and the difference in elevation on both sides of the Longmenshan fault zone partly affects the accuracy of the inversion, and further improvements on this issue are needed in future work.
Acknowledgments
This work was supported by the National Key R&D Program of China (No.2016YFC0600301) and the National Natural Science Foundation of China (No.41974053). Seismic instruments were provided by the Short-period Seismograph Observation Laboratory, IGGCAS. And we plotted figures by using the Generic Mapping Tools software (Wessel and Smith, 1998). The authors would like to thank Lianglei Guo, Zhen Liu, Wei Li, Guiping Yu, Shitan Nie, Xusong Yang and Peixiao Du for their help and suggestions that greatly improved this paper. We acknowledge Hongjian Fang for providing software resources for the direct inversion method.
Airaghi L, de Sigoyer J, Lanari P, Guillot S, Vidal O, Monié P, Sautter B and Tan XB (2017) Total exhumation across the Beichuan fault in the Longmen Shan (eastern Tibetan plateau, China): Constraints from petrology and thermobarometry. J Asian Earth Sci 140: 108–121 doi: 10.1016/j.jseaes.2017.04.003
Bensen GD, Ritzwoller MH, Barmin MP, Levshin AL, Lin F, Moschetti MP, Shapiro NM and Yang Y (2007) Processing seismic ambient noise data to obtain reliable broad-band surface wave dispersion measurements. Geophys J Int 169(3): 1239–1260 doi: 10.1111/j.1365-246X.2007.03374.x
Burchfiel BC, Chen Z, Liu Y and Royden LH (1995) Tectonics of the Longmen Shan and adjacent regions, central China. International Geology Review 37(8): 661–735 doi: 10.1080/00206819509465424
Burchfiel BC, Royden L, van der Hilst R, Hager B, Chen ZL, King R, Li C, Lv J, Yao HB and Kirby E (2008) A geological and geophysical context for the Wenchuan earthquake of 12 May 2008, Sichuan, People's Republic of China. Geol Soc Am Today 18: 4–11
Chen JH, Zhao PP, Liu QY, Guo B and Li Y (2015) Fine structure of middle and upper crust of the Longmenshan fault zone from short period seismic ambient noise. Chin J Geophys 58(11): 4018–4030 (in Chinese with English abstract)
Claerbout JF (1968) Synthesis of a layered medium from its acoustic transmission response. Geophysics 33(2): 264–269
De Sigoyer J, Vanderhaeghe O, Duchêne S and Billerot A (2014) Generation and emplacement of Triassic granitoids within the Songpan Ganze accretionary-orogenic wedge in a context of slab retreat accommodated by tear faulting, Eastern Tibetan plateau. China J Asian Earth Sci 88: 192–216 doi: 10.1016/j.jseaes.2014.01.010
Deng WZ, Chen JH, Guo B, Liu QY, Li SC, Li Y, Yin XZ and Qi SH (2014) Fine velocity structure of the Longmenshan fault zone by double-difference tomography. Chin J Geophys 57(4): 1101–1110 (in Chinese with English abstract)
Fang HJ, Yao HJ, Zhang HJ, Huang YC and Van Der Hilst RD (2015) Direct inversion of surface wave dispersion for three-dimensional shallow crustal structure based on ray tracing: Methodology and application. Geophys J Int 201(3): 1 251–1 263 doi: 10.1093/gji/ggv080
Guo XY, Gao R, Keller GR, Xu X, Wang HY and Li WH (2013) Imaging the crustal structure beneath the eastern Tibetan Plateau and implications for the uplift of the Longmen Shan range. Earth Planet Sci Lett 379: 72–80 doi: 10.1016/j.jpgl.2013.08.005
Hannemann K, Papazachos C, Ohrnberger M, Savvaidis A, Anthymidis M and Lontsi AM (2014) Three-dimensional shallow structure from high-frequency ambient noise tomography: New results for the Mygdonia basin-Euroseistest area, northern Greece. J Geophys Res 119(6): 4979 doi: 10.1002/2013JB010914
Hu JM, Meng QR, Shi Y and Qu HJ (2005) SHRIMP U-Pb dating of zircons from granitoid bodies in the Songpan-Ganzi terrane and its implications. Acta Petrol Sin 21: 867–880
Hubbard J and Shaw JH (2009) Uplift of the Longmen Shan and Tibetan plateau, and the 2008 Wenchuan (M = 7.9). Nature 485(7235): 194–197
Jia D, Wei GQ, Chen ZX, Li Bl, Zeng Q and Yang G (2006) Longmen Shan fold-thrust belt and its relation to the western Sichuan Basin in central China: New insights from hydrocarbon exploration. AAPG Bull 90(9): 1 425–1 447 doi: 10.1306/03230605076
Jia SX, Liu BJ, Xu ZF, Liu Z, Feng SY, Zhang JS, Lin JY, Tian XF, Liu QX and Guo WB (2014) The crustal structures of the central Longmenshan along and its margins as related to the seismotectonics of the 2008 Wenchuan Earthquake. Sci China Earth Sci 57(4): 777–790 doi: 10.1007/s11430-013-4744-9
Lei JS, Zhao DP, Su JR, Zhang GW and Li F (2009) Fine seismic structure under the Longmenshan fault zone and the mechanism of the large Wenchuan earthquake. Chin J Geophys 52(52): 112–119 (in Chinese with English abstract)
Li HY, Su W, Wang CY and Huang ZX (2009a) Ambient noise Rayleigh wave tomography in western Sichuan and eastern Tibet. Earth Planet Sci Lett 282(1): 201–211
Li QS, Gao R, Wang HY, Zhang JS, Lu ZW, Li PW, Guan Y and He RZ (2009b) Deep background of Wenchuan earthquake and the upper crust structure beneath the Longmen Shan and adjacent areas. Acta Geologica Sinica 83(4): 733–739 doi: 10.1111/j.1755-6724.2009.00096.x
Li XR, Hergert T, Henk A, Wang D and Zeng ZX (2019) Subsurface structure and spatial segmentation of the Longmen Shan fault zone at the eastern margin of Tibetan Plateau: Evidence from focal mechanism solutions and stress field inversion. Tectonophysics 757: 10–23 doi: 10.1016/j.tecto.2019.03.006
Li Y, Allen P, Densmore AL and Xu Q (2003) Evolution of the Longmen Shan Foreland Basin (Western Sichuan, China) during the Late Triassic Indosinian Orogeny. Basin Res 15(1): 117–138
Li Y, Yao HJ, Liu QY and Chen JH (2010) Phase velocity array tomography of Rayleigh waves in western Sichuan from ambient seismic noise. Chin J Geophys 53(4): 842–852 (in Chinese with English abstract)
Li ZW, Xu Y, Huang RQ, Hao TY, Xu Y, Liu JS and Liu JH (2011) Crustal P-wave velocity structure of the Longmenshan region and its tectonic implications for the 2008 Wenchuan earthquake. Sci China Earth Sci 54(9): 1–386
Lin FC, Ritzwoller MH, Townend J, Bannister S and Savage MK (2010) Ambient noise Rayleigh wave tomography of New Zealand. Geophys J Int 170(2): 649–666
Lin XD, Ge HK, Xu P, Dreger D and Wu MJ (2013) Near field full waveform inversion: Lushan magnitude 7.0 earthquake and its aftershock moment tensor. Chin J Geophys 56(12): 4037–4047
Liu QY, van der Hilst RD, Li Y, Yao HJ, Chen JH, Guo B, Qi SH, Wang J, Huang H and Li SC (2014) Eastward expansion of the Tibetan Plateau by crustal flow and strain partitioning across faults. Nature Geoscience 7(5): 361–365 doi: 10.1038/ngeo2130
Liu ZQ, Liang CT, Hua Q, Li Y, Yang YH, He FJ and Fang LH (2018) The seismic potential in the seismic gap between the Wenchuan and Lushan earthquakes revealed by the joint inversion of receiver functions and ambient noise data. Tectonics 37: 4 226–4 238 doi: 10.1029/2018TC005151
Lu RQ, He DF, John S, Wu JE, Liu B and Chen YG (2014) Structural model of the central Longmen Shan thrusts using seismic reflection profiles: Implications for the sediments and deformations since the Mesozoic. Tectonophysics 630: 43–53 doi: 10.1016/j.tecto.2014.05.003
Michel C and Anne P (2003) Long-range correlations in the diffuse seismic coda. Science 299(5606): 547–549 doi: 10.1126/science.1078551
Pei SP, Zhang HJ, Su JR and Cui ZX (2014) Ductile gap between the Wenchuan and Lushan earthquakes revealed from the two-dimensional Pg Seismic Tomography. Scientific Reports 4: 6489
Roger F, Malavieille J, Leloup PH, Calassou S and Xu Z (2004) Timing of granite emplacement and cooling in the Songpan-Garzê Fold Belt (eastern Tibetan Plateau) with tectonic implications. J Asian Earth Sci 22(5): 465–481 doi: 10.1016/S1367-9120(03)00089-0
Roux P, Sabra KG, Gerstoft P, Kuperman WA and Fehler MC (2005) P-waves from cross-correlation of seismic noise. Geophys Res Lett 32(19): 312–321
Shapiro N, Campillo M, Stehly L and Ritzwoller M (2005) High-resolution surface-wave tomography from ambient seismic noise. Science 307(5715): 1 615–1 618 doi: 10.1126/science.1108339
Tian T, Zhang JF, Liu TY, Jiang WL and Zhao YB (2017) Morphology, tectonic significance, and relationship to the Wenchuan earthquake of the Xiaoyudong Fault in Western China based on gravity and magnetic data. J Asian Earth Sci 138: 672–684 doi: 10.1016/j.jseaes.2016.10.008
Wang GC, Tian XB, Guo LL, Yan JY and Lyu QT (2018) High-resolution crustal velocity imaging using ambient noise recordings from a high-density seismic array: An example from the Shangrao section of the Xinjiang basin, China. Earth Sci 31: 1–10 doi: 10.29382/eqs-2018-0001-1
Wang H, Li HB, Si JL, Sun ZM and Huang Y (2014a) Internal structure of the Wenchuan earthquake fault zone, revealed by surface outcrop and WFSD-1 drilling core investigation. Tectonophysics 619-620: 101–114
Wang MM, Hubbard J, Plesch A, Shaw JH and Wang L (2016) Three-dimensional seismic velocity structure in the Sichuan basin, China. J Geophys Res 121(2): 1007–1022 doi: 10.1002/2015JB012644
Wang WF, Zhu CH, Qing YB and Shan XJ (2014b) Research on Transverse Faults in the Longmenshan Fault Zone. China Advanced Materials Research 1010-1012: 1380–1386 doi: 10.4028/www.scientific.net/AMR.1010-1012.1380
Wang WM, Zhao LF, Li J and Yao ZX (2008) Rupture process of the MS8.0 Wenchuan earthquake of Sichuan, China. Chin J Geophys 51(5): 1403–1410 (in Chinese with English abstract)
Wessel P and Smith WHF (1998) New improved version of Generic Mapping Tools released. Eos Transactions Amercan Geophysical Union 79(47): 1
Wu JP, Huang Y, Zhang TZ, Ming YH and Fang LH (2009) Aftershock distribution of the MS8.0 Wenchuan earthquake and three dimensional P-wave velocity structure in and around source region. Chin J Geophys 52(2): 320–328 (in Chinese with English abstract)
Xue ZH, Martelet G, Lin W, Faure M, Chen Y, Lin W, Li SJ and Wang QC (2017) Mesozoic crustal thickening of the Longmenshan belt (NE Tibet, China) by imbrication of basement slices: Insights from structural analysis, petrofabric and magnetic fabric studies, and gravity modeling. Tectonics 36(12): 3 110–3 134
Yao HJ, van der Hilst RD and de Hoop MV (2006) Surface-wave array tomography in SE Tibet from ambient seismic noise and two-station analysis I. Phase velocity maps. Geophys J Int 166(2): 732–744 doi: 10.1111/j.1365-246X.2006.03028.x
Yao HJ, Xu GM, Zhu LB and Xiao X (2005) Mantle structure from inter-station Rayleigh wave dispersion and its tectonic implication in western China and neighboring regions. Phys Earth Planet In 148(1): 39–54 doi: 10.1016/j.pepi.2004.08.006
Yuan C, Zhou MF, Sun M, Zhao YJ, Wilde S, Long XP and Yan DP (2010) Triassic granitoids in the eastern Songpan Ganzi Fold Belt, SW China: Magmatic response to geodynamics of the deep lithosphere. Earth Planet Sci Lett 290(3): 481–492
Zhang W, Li HB, Huang Y, Si JL, Liu DL, Li Y, Wang H, Yang G and Sun LW (2012) Lithologic characteristics and fault zone structure revealed by No. 2 hole cores of the Wenchuan Earthquake Fault Zone Scientific Drilling (WFSD-2). Geological Bulletin of China 31(8): 1201–1218
Zhang XY, Gao R, Bai ZM, Xu T and Li QS (2017) Crustal structure beneath the Longmenshan area in eastern Tibet: New constrains from reprocessing wide-angle seismic data of the Aba-Longmenshan-Suining profile. Chin J Geophys 60(6): 2200−2212 (in Chinese with English abstract)
Zhao GZ, Unsworth M, Zhan Y, Wang L, Chen XB, Jones A, Tang J, Xiao Q, Wang J, Cai JT, Li T, Wang Y and Zhang J (2012) Crustal structure and rheology of the Longmenshan and Wenchuan MW7.9 earthquake epicentral area from magneto-telluric data. Geology 40(12): 1 139–1 142 doi: 10.1130/G33703.1
Zhao YJ, Yuan C, Zhou MF and Yan DP (2007) Geochemistry and petrogenesis of Laojungou and Mengtonggou granites in western Sichuuan, China: Constraints on the nature of Songpan-Ganzi basement. Acta Petrol Sin 23(05): 133–144
Cai, Y., Wu, J., Liu, Y. et al. Advances in seismological methods for characterizing fault zone structure. Earthquake Science, 2024, 37(2): 122-138.
DOI:10.1016/j.eqs.2024.01.019
2.
Chen, X., Li, H., Zhang, Y. et al. Shallow structure of Beichuan area from a dense, short-period seismic array | [基于短周期密集台阵的北川地区浅层地壳结构研究]. Acta Geophysica Sinica, 2022, 65(11): 4311-4325.
DOI:10.6038/cjg2022P0795
3.
Hua, Q., Pei, S., Guo, Z. et al. Shallow Layer Tomography Study on Tongmai⁃Lulang Section of Sichuan⁃Tibet Railway | [川藏铁路通麦‒鲁朗段浅层结构背景噪声成像]. Diqiu Kexue - Zhongguo Dizhi Daxue Xuebao/Earth Science - Journal of China University of Geosciences, 2022, 47(9): 3447-3462.
DOI:10.3799/dqkx.2022.111
4.
Chang, Y., Liang, C., Cao, F. et al. Seismic velocity structure for the Anninghe-Zemuhe fault zone by wave gradiometry analysis | [基于波场梯度法研究安宁河—则木河断裂带速度结构]. Acta Geophysica Sinica, 2022, 65(8): 2886-2903.
DOI:10.6038/cjg2022P0731

 DownLoad: