Sadegh Rezaei, Asskar Janalizadeh Choobbasti (2017). Application of the microtremor measurements to a site effect study. Earthq Sci 30(3): 157-164. DOI: 10.1007/s11589-017-0187-2
Citation:
Sadegh Rezaei, Asskar Janalizadeh Choobbasti (2017). Application of the microtremor measurements to a site effect study. Earthq Sci 30(3): 157-164. DOI: 10.1007/s11589-017-0187-2
Sadegh Rezaei, Asskar Janalizadeh Choobbasti (2017). Application of the microtremor measurements to a site effect study. Earthq Sci 30(3): 157-164. DOI: 10.1007/s11589-017-0187-2
Citation:
Sadegh Rezaei, Asskar Janalizadeh Choobbasti (2017). Application of the microtremor measurements to a site effect study. Earthq Sci 30(3): 157-164. DOI: 10.1007/s11589-017-0187-2
Earthquake has left much life and property damages. The occurrence of such events necessitates the execution of plans for combating the earthquakes. One of the most important methods for combating earthquakes includes assessing dynamic characteristics of soil and site effect. One of the methods by which one can state dynamic characteristics of the soil of an area is the measurement of microtremors. Microtremors are small-scale vibrations that occur in the ground and have an amplitude range of about 0.1-1 microns. Microtremor measurement is fast, applicable, cost-effective. Microtremor measurements were taken at 15 stations in the Babol, north of Iran. Regarding H/V spectral ratio method, peak frequency and amplification factor were calculated for all microtremor stations. According to the analysis, the peak frequency varies from 0.67 to 8.10 Hz within the study area. Also, the authors investigated the validity of the results by comparing them with SESAME guidelines and geotechnical conditions of study area. The microtremor analysis results are consistent with SESAME guidelines and geotechnical condition of study area. The results show that the microtremor observations are acceptable methods for assessing dynamic characteristics of soil and site effect in the Babol City.
Numerous observations in earthquake-affected areas have shown that the local intensity of earthquake shaking and the amount of structural damage due to seismic impact are in some way influenced by the local subsoil. During the past decades, the effect of local soil condition is known to have caused serious damage during several earthquakes. Some well-known examples include the earthquake in Michoacan, Mexico, in 1985, Loma Prieta, California, USA, 1989, Roodbar, Iran, 1990, Chi-Chi, Taiwan, 1999, Bam, Iran, 2003.
In general, site effect has introduced the effects of soils layers and underground topography which alter the specification of strong ground motion (Choobbasti et al. 2013; Del Gaudio et al. 2013). It is well accepted that, besides the earthquake magnitude and fault distance, local geological conditions, known as site effects, can impose significant influences on the earthquake ground motion at a given place (Rezaei et al. 2015; Panzera et al. 2013).
Soft soil layers amplify the earthquake ground motion. This fact increases the importance of assessing the site effects, in order to introduce suitable solutions for minimizing the earthquake damage and loss of life. These assessments are performed by different methods. One of the most common methods includes microtremor measurement. Today, this approach is being used as fast, applicable, cost-effective site effect assessment method.
Babol City is located in Mazandaran Province in north of Iran. This region consists of soft deposits. In the last three decades, the population of Babol is increased, which resulted in very rapid growth of settlements, especially in urban areas. Currently, about 300, 000 people in Babol are at risk from earthquakes. Many of the Iran cities, including Babol, are located in region with high seismic activity. One of the most important steps for identifying and combating earthquakes is seismic microzonation. This method is a general process for dividing a region into smaller part with similar seismic properties.
The International Society of Soil Mechanics and Foundation Engineering has introduced three levels for zonation process. Level II map is based on the microtremor records and simplified geological studies. For this reason, microtremor measurement has been taken at 15 stations in the western part of Babol City.
The obtained data were analyzed based on Nakamura method (H/V). Nakamura method is one of the most reliable and efficient microtremor analysis methods. The obtained results were controlled with SESAME guidelines. In addition, the results were compared with study area soil's texture and geotechnical condition to confirm their precision.
2.
Seismicity of Babol
Unfortunately, Iran's human communities and material infrastructure have been developed in disaster-prone areas such as the Babol City. Population in these communities has been increased; therefore, an accurate natural hazard risk assessment is necessary. Babol is the capital of Babol County, Mazandaran Province, Iran. Babol is located at a latitude of 36°5′36″ north and latitude of 52°3′ east (Rezaei 2014).
Babol is located in front of Alborz Mountain which is a tectonically active region situated between the Caspian Sea and the Iran platform. The tectonic of Alborz Mountain is controlled by the boundary condition due to convergent motion between Arabia and Eurasia, which probably started in the Cretaceous. The area around Babol has repeatedly experienced earthquakes. In Table 1, the magnitude, intensity, year of occurrence and location of these earthquakes are reported.
Table
1.
List of recorded damaging earthquakes in and around Babol (Choobbasti et al. 2013)
Microtremors are ground vibrations with displacement amplitude about 1-10 micron, and velocity amplitude is 0.001-0.01 cm/s that can be detected by seismograph with high magnification (Rezaei and Choobbasti 2014). Many investigations have been conducted to determine the nature of microtremors. One of the possible sources of microtremors can be human activity, such as traffic, industrial noises and natural phenomena, such as wind, ocean waves (Del Gaudio and Wasowski 2011).
As it is said before, one of the most popular techniques for estimation of site effects in the regions with low seismicity is microtremor measurements by Nakamura method (H/V) (Matassoni et al. 2015; Nakamura 1989). Based on the literature review, the Nakamura method (H/V) has been used in many places.
Nakamura presumes that the microtremors predominantly consist of shear waves. Observation of tremor data showed that the ratio values between horizontal and vertical motions of tremor for each observation point (HB/VB) are related to soil conditions and are almost equal to one for firm soil and bedrock. The horizontal component of the shear wave is amplified by the layer of soft soil due to the multiple-reflection phenomena of the waves. However, Nakamura assumed that the soft soil layer does not amplify the vertical component, i.e., P wave. The transfer function (ST) of surface layers is defined as the ratio between the horizontal tremor spectrum on the surface (HS) and the horizontal tremor spectrum on the substratum (HB).
(1)
In this interpretation, it was assumed that the horizontal tremor spectrum on the surface is affected by the Rayleigh waves, which are considered as noise for microtremor measurements. And also, the Rayleigh waves affect the vertical spectrum at the surface but do not affect the vertical spectrum at the bedrock. Moreover, it was assumed that soft sediments do not amplify the vertical waves; hence, the effect of the Rayleigh waves (ERW) can be evaluated by taking the ratio of the vertical component at the surface (VS) and at the bedrock (VB).
(2)
Hence, incorporating the effects of Rayleigh waves, new transfer function (SM) can be written as
(3)
where
(4)
Thus, an estimate of the transfer function is given by the spectral ratio between the horizontal and the vertical components of the motion at the surface:
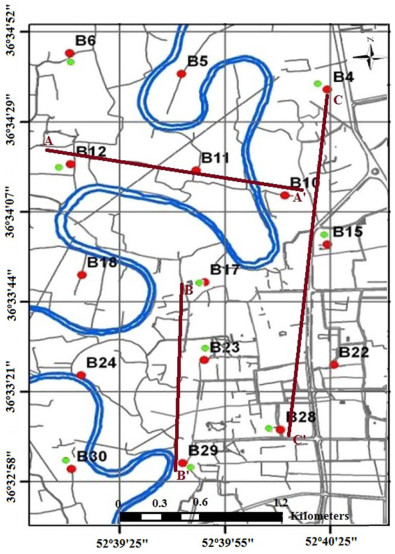
Investigations were conducted in the western part of Babol, the study area was divided in the form of 700 m × 700 m squares, and one station was specified for measurement in each square. Figure 1 shows the gridding, the location of microtremor recording stations and geotechnical boreholes available in the study area (red: microtremor station, green: geotechnical borehole).
Figure
1.
Location of microtremor recording stations and geotechnical borehole red microtremor station, green geotechnical borehole. (Color figure online)
Microtremor measurements were taken in 2011 and 2012 in the study area. All the experimental conditions for current work were controlled mainly by the European SESAME research project. To reduce the effect of local noisy sources, such as industrial facilities, almost all recordings were done between 10 pm and 3 am.
The measurement system used (SL07) consists of power supply, GPS, amplifiers, 32-bit A/D converters and a laptop, with a three-component velocity sensor unit (two in two orthogonal horizontal directions and one in vertical directions). At each site, microtremor motions were measured for 15 min and digitized with equi-interval of 0.01 s.
At each station, data were recorded for 901.12 s (i.e., 90, 112 data points at the sampling rate of 100 Hz). The recorded time series data were divided into 44 windows each of 20.48 s duration. For each site, appropriate windows of the data were chosen from 44 windows, omitting the windows that are influenced by very near noisy sources. Each window is baseline-corrected for anomalous trends, tapered with Hanning window and band-pass filtered from 0.2 to 20 Hz. These appropriate windows were used for the calculation. The Fourier spectra were calculated for the selected windows using the fast Fourier transform (FFT) algorithm. The Fourier amplitude ratio of the two horizontal Fourier spectra and one vertical Fourier spectrum was obtained using Eq. 6:
(6)
where N, E and V are the Fourier amplitude spectra in the NS, EW and UD directions, respectively.
After obtaining the H/V spectra for appropriate windows, the average of the spectra was obtained as the H/V spectrum for a particular site. The peak frequency of the H/V spectrum plot shows the resonance frequency and amplification factor of the site.
In order to assess the accuracy of the measurements, reliability and clarity of the peak in the H/V curve have been checked. For this purpose, the authors use the SESAME guidelines. The SESAME guidelines on the H/V spectral ratio technique are the result of comprehensive and detailed analyses performed by the SESAME participants during the 3 years (2001-2004). The guidelines represent the state of the art of the present knowledge of microtremor method and its applications and are based on the consensus reached by a large group of participants. It reflects the synthesis of a considerable amount of data collection and subsequent analysis and interpretations. For more information about SESAME research project, visit http://sesame-fp5.obs.ujf-grenoble.fr (SESAME 2004).
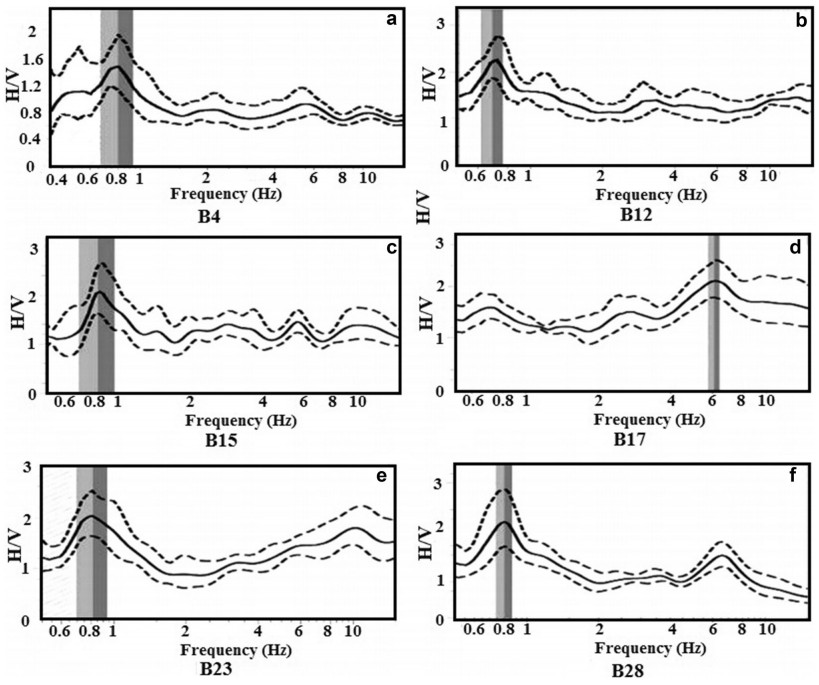
H/V spectral ratios for the selected windows have been computed at 15 stations of surveyed sites. Figure 2 displays the H/V spectral ratio for stations B04, B12, B15, B17, B23 and B28 for example. Table 2 shows the analysis results for all recording stations. In this table, f(Peak) is the peak frequency and A0 is the amplification factor.
Table 3 shows the criteria for a clear H/V peak recommended by European SESAME research project. Also, Table 4 shows the criteria for a reliable H/V curve recommended by European SESAME research project. In the following tables, Y represents that the criteria are acceptable and N shows that the criteria are not acceptable.
Table
3.
Criteria for a clear H/V peak recommended by European SESAME research project
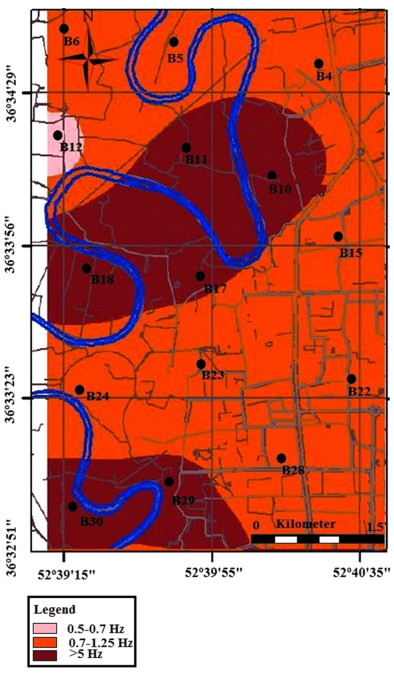
The H/V spectral ratios for selected windows have been computed at 15 stations of surveyed sites and are presented in Fig. 2a-f. According to the analysis, the peak frequency f(Peak) varies from 0.67 to 8.10 Hz within the study area but they can be classified in two frequency ranges. First group in shorter range is from 0.67 to 1.32 Hz. The other in larger range is from 1.32 to 8.10 Hz. The most part has lower values of f(Peak) (less than 1 Hz, about 60%), and these low values indicate large thickness of sediments. Each station enables an estimation of the peak frequency and amplification. In order to represent the spatial distribution of the peak frequency over the Babol City, interpolation between the microtremor stations was carried out. Figure 3 shows the peak frequency for Babol City varying from 0.67 to 8.10 Hz. Major portion of the city shows a lower peak frequency in the range of 0.67-0.92 Hz. The central and southwest part has higher values of peak frequency.
The presence of clear peak of H/V curve (Fig. 2a-c, e) is considered as an indicative of the impedance contrast between the uppermost surface soil and the underlying hard rock (SESAME 2004). At some sites, a second significant and clearly identifiable peak is visible at higher frequency (Fig. 2f); these secondary peaks of the H/V curve reflect the presence of two large impedance contrasts (SESAME 2004). Figure 2d presents some of broad peak curves, and this could be related to presence of an underground sloping of the interface between softer and harder layers (SESAME 2004; Fnais et al. 2010).
5.2
Comparison of data collected from microtremor measurements and geotechnical conditions
To validate the experimental technique, peak frequencies obtained from microtremor measurements were compared with the soil texture and geotechnical condition in the study area. For this purpose, three cross sections of A-A', B-B' and C-C' have been considered in the study area (Fig. 1).
Geotechnical data enabled authors to determine soil columns representative of each site. The mechanical properties of the existing boreholes in the study area were entered in the RockWorks software, and by the performed analysis, the soil condition under the three considered cross sections has been specified. RockWorks is an integrated software package for geological data management, analysis and visualization (Haque et al. 2017).
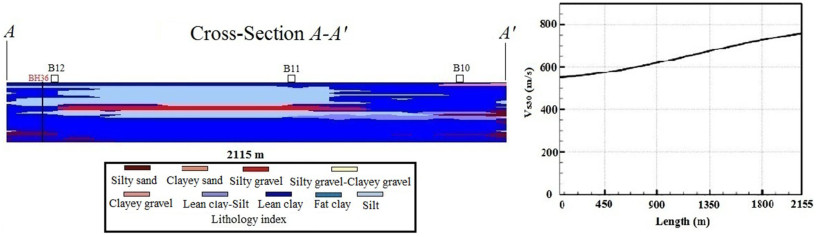
First, let's review the A-A' section. This section has the west-east direction. This section passes through the three microtremor recording stations of B12, B11 and B10. As it is evident from Fig. 4, the considered section mainly consists of fine particles and has been changed noticeably only in the middle and end of soil profile and coarse grain is observed in this region.
By assessing the frequency values obtained from recording stations B12, B11 and B10, it can be seen that the results have acceptable conformity with the section's geotechnical conditions, such that the recording stations of B11 and B10 mainly consist of coarse grain and this issue beside high N-SPT and shear wave velocity confirms the existence of high frequency in this region. In addition, the soil under the B12 recording station mainly consists of fine particles with high N-SPT and this fact confirms the existence of low resonance frequency in this region.
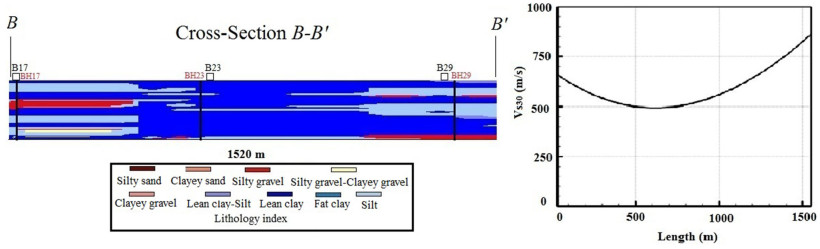
The B-B' cross section is passed from the north to the south and is almost located from the midsection to the end of the study area. This section has been passed in direction of three recording stations of B17, B23 and B29. By reviewing Fig. 5, it is observed that the geotechnical conditions of this section consist of various soils types. However, we can observe the general trend of the related changes. The soil layers at the beginning of section contain some coarse grains, but in the midsection, fine particles increase. At the end of section, the soil layer changes are considerable, but it consists mainly of coarse grains. Considering the reviews performed for the soil layers, N-SPT and shear wave velocity, it is predicted that the resonance frequency values are high at the beginning of the section, and then in the midsection, its value will be decreased and again will increase at the end of section. This problem is consistent with the values measured at the microtremor stations.
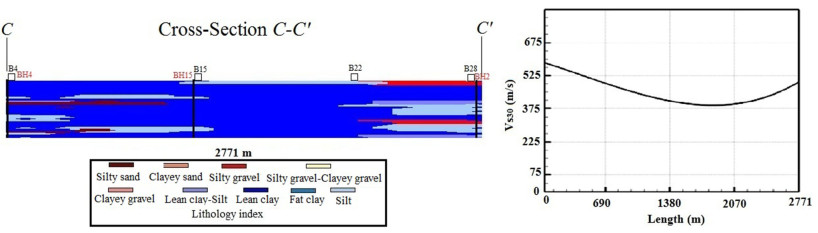
The C-C' section has the north-south direction and is located at the right side of the study area. This section is longer than the other two sections. This section passes through the microtremor recording stations of B04, B15, B22 and B28. By reviewing Fig. 6, it is observed that, this section mainly consists of fine particles with low N-SPT. The beginning of section consists of coarse grain, and in the rest of the profile toward the south, some fine particles are noticed which can decrease the resonance frequency, and almost at the end of the section, the coarse grain is increased again. A general review shows that the soil texture and geotechnical condition of section have an acceptable conformity with the results of microtremor measurements.
In this paper, the authors evaluate the applicability of microtremor measurement in Babol City. Babol is an important city in the north of Iran that is built on thick soft sediments, which could amplify the earthquake ground motion. In order to assess the dynamic characteristics and site effect, the study area has been divided at nodes on a 700-m grid within a 3.5-km by 2.1-km area in Babol City. The result shows the resonance frequency and the amplification factor vary within a short distance. The results of the resonance frequencies of the sediments show a distribution in a wide range 0.67-8.10 Hz and most part of the study area has amplification factor in the range of 1.4-2.2. There is a good correlation of different frequency ranges with a soil texture and geotechnical properties (shear wave velocity, N-SPT) of study area. Also, the accuracy of the measurements, reliability and clarity of the peak in the H/V curve have been checked by SESAME guidelines. As final conclusion, it is possible to say that, microtremor analysis using the Nakamura technique proved to be a valuable tool to determine peak frequency and amplification factor of shallow soft soils with simple layer distribution.
Open Access
This article is distributed under the terms of the Creative Commons Attribution 4.0 International License (http://creativecommons.org/licenses/by/4.0/), which permits unrestricted use, distribution, and reproduction in any medium, provided you give appropriate credit to the original author(s) and the source, provide a link to the Creative Commons license, and indicate if changes were made.
Del Gaudio V, Wasowski J (2011) Advances and problems in understanding the seismic response of potentially unstable slopes. Eng Geol 122:73-83 doi: 10.1016/j.enggeo.2010.09.007
Del Gaudio V, Wasowski J, Muscillo S (2013) New developments in ambient noise analysis to characterise the seismic response of landslide-prone slopes. Nat Hazards Earth Syst Sci 13:2075-2087 doi: 10.5194/nhess-13-2075-2013
Fnais MS, Abdelrahman K, Al-Amri AM (2010) Microtremor measurements in Yanbu city of Western Saudi Arabia: a tool for seismic microzonation. J King Saud Univ 22:97-110 doi: 10.1016/j.jksus.2010.02.006
Haque MN, Keramat M, Shahid S, Mohsenipour M, Wang XJ (2017) Groundwater dynamics and balance in the western part of greater Kushtia district of Bangladesh. KSCE J Civ Eng 21:1595-1606 doi: 10.1007/s12205-016-0801-1
Matassoni L, Fiaschi A, Silengo MC, Lotti A, Saccorotti G (2015) Preliminary seismic microzonation in a mountain municipality of Tuscany (Italy). Open Geosci 7:559-571 http://adsabs.harvard.edu/abs/2015OGeo....7...45M
Milana G, Azzara RM, Bertrand E, Bordoni P, Cara F, Cogliano R, Cultrera G, Di Giulio G, Duval AM, Fodarella A, Marcucci S, Puccilo S, Regnier J, Riccio G (2011) The contribution of seismic data in microzonation studies for downtown L'Aquila. Bull Earthq Eng 9:741-759 doi: 10.1007/s10518-011-9246-6
Mundepi AK, Galiana-Merino JJ, Asthana AKL, Rosa-Cintas S (2015) Soil characterizations in Doon Valley (north west Himalaya, India) by inversion of H/V spectral ratios from ambient noise measurements. Soil Dyn Earthq Eng 77:309-320 doi: 10.1016/j.soildyn.2015.06.006
Nakamura Y (1989) A method for dynamic characteristics estimation of subsurface using microtremor on the ground surface. Q Rep RTRI 30:25-33
Pilz M, Parolai S, Bindi D, Saponaro A, Abdybachaev U (2014) Combining seismic noise techniques for landslide characterization. Pure Appl Geophys 171:1729-1745 doi: 10.1007/s00024-013-0733-3
Purnachandra Rao N, Rabi Kumar M, Seshunarayana T, Shukla AK, Suresh G, Pandey Y, Dharma Raju R, Pimprikar SD, Chandra D, Kalpna G, Mishra PS, Gupta H (2011) Site amplification studies towards seismic microzonation in Jabalpur urban area, central India. Phys Chem Earth 36:1247-1258 doi: 10.1016/j.pce.2011.01.002
Rezaei S (2014) Assessing the site effects and estimation of strong ground motion specification by using microtremor data and compare its results with simulation of soil profile (Case study: western part of Babol city). Master Thesis, Babol: Babol University of Technology
Rezaei S, Choobbasti AJ, Kutanaei SS (2015) Site effect assessment using microtremor measurement, equivalent linear method, and artificial neural network (case study: Babol, Iran). Arab J Geosci 8:1453-1466 doi: 10.1007/s12517-013-1201-1
SESAME, WP12 (2004) Guidelines for the implementation of the H/V spectral ratio technique on ambient vibrations-Measurements, processing and interpretation. SESAME European research project, Deliverable D23. 12., Project No. EVG1-CT-2000-00026 SESAME, 62 pp
Singh AP (2015) Seismic hazard evaluation in Anjar city area of western India: microtremor array measurement. Soil Dyn Earthq Eng 71:143-150 doi: 10.1016/j.soildyn.2015.01.009
Prajapati, R., Dhonju, S., Bijukchhen, S.M. et al. Estimation of Vs30 and site classification of Bhaktapur district, Nepal using microtremor array measurement. Earth, Planets and Space, 2024, 76(1): 135.
DOI:10.1186/s40623-024-02077-6
2.
Pandey, M., Joshi, A., Sharma, S. et al. Identification of major tectonic boundaries in the Garhwal and Kumaon Himalaya, India using shallow seismic surveys. Environmental Earth Sciences, 2024, 83(17): 504.
DOI:10.1007/s12665-024-11806-9
3.
Durmuş, H.. Soil Characterization Using HVSR and MASW Techniques: A Case Study (Kütahya Dumlupınar University Campus). Pure and Applied Geophysics, 2024, 181(4): 1281-1302.
DOI:10.1007/s00024-024-03452-w
4.
EL Hilali, M., Bounab, A., Timoulali, Y. et al. Seismic site-effects assessment in a fluvial sedimentary environment: case of Oued Martil floodplain, Northern Morocco. Natural Hazards, 2023, 118(2): 1235-1257.
DOI:10.1007/s11069-023-06032-8
5.
Emami, R., Rezapour, M., Faraji, M. Study of Landslides using electrical resistivity tomography (ERT) in the Kiasar-Semnan road, Iran | [مطالعه مناطق لغزشی با روش توموگرافی مقاومت الکتریکی (ERT) در جادهکیاسر سمنان، ایران]. Journal of Water and Health, 2023, 49(1): 15-34.
DOI:10.22059/jesphys.2023.338184.1007401
6.
Rusydi, M., Sandra, S., Utami, A.C. et al. Earthquake hazard analysis in Mamuju district. AIP Conference Proceedings, 2023.
DOI:10.1063/5.0133274
7.
Purba, T.R., Mariyanto, M., Komara, E. Microtremor analysis around Jari mud volcano, Bojonegoro. Journal of Physics: Conference Series, 2023, 2582(1): 012031.
DOI:10.1088/1742-6596/2582/1/012031
8.
Emami, R., Rezapour, M., Faraji, M. Study of landslide potential in Chaybagh region with 2D electrical resistivity tomography method | [مطالعه پتانسيل زمينلغزش با استفاده از روش توموگرافي الكتريك ي دوبعدي در منطقه چايباغ (سوادكوه شمالي ، ايران)]. Iranian Journal of Geophysics, 2022, 16(3): 223-237.
DOI:10.30499/ijg.2022.329130.1396
9.
Poormirzaee, R., Kabgani, A. Characterizing the Vs Profile from Surface Wave Data Using a Customized Artificial Jellyfish Search Algorithm. Pure and Applied Geophysics, 2022, 179(12): 4429-4444.
DOI:10.1007/s00024-022-03173-y
10.
Alzahrani, M., Abdelrahman, K., Alfaifi, A. et al. Site effect estimation for shallow engineering bedrock using microtremor HVSR method and geotechnical borehole data, Riyadh city, Saudi Arabia. Journal of King Saud University - Science, 2022, 34(8): 102285.
DOI:10.1016/j.jksus.2022.102285
11.
Badrolhisham, S.N.S., Khalil, A.E., Wai, W.K. et al. Evaluation of site effects using horizontal-to-vertical spectral ratio in Kuala Pilah, Negeri Sembilan. IOP Conference Series: Earth and Environmental Science, 2022, 1003(1): 012036.
DOI:10.1088/1755-1315/1003/1/012036
12.
Hegde, A., Anand, A. Resistivity Correlations with SPT-N and Shear Wave Velocity for Patna Soil in India. Indian Geotechnical Journal, 2022, 52(1): 161-173.
DOI:10.1007/s40098-020-00492-6
13.
Kusumawardani, R., Qudus, N., Sabba, A.B. et al. Vibration Analysis on a Railway Bridge Structure. Lecture Notes in Civil Engineering, 2022.
DOI:10.1007/978-981-16-6932-3_6
14.
Öztürk, S., Beker, Y., Sari, M. et al. Estimation of ground types in different districts of Gümüşhane province based on the ambient vibrations H/V measurements. Sigma Journal of Engineering and Natural Sciences, 2021, 39(4): 374-391.
DOI:10.14744/sigma.2021.00026
15.
Nemati, S.F., Hafezi Moghadas, N., Lashkaripour, G.R. et al. Identification of hidden faults using determining velocity structure profile by spatial autocorrelation method in the west of Mashhad plain (Northeast of Iran). Journal of Mountain Science, 2021, 18(12): 3261-3274.
DOI:10.1007/s11629-020-6511-7
16.
Ipmawan, V.L., Permanasari, I.N.P., Suhendi, C. Improving Quality of Microtremor Data with Application of Empirical Mode Decomposition Method, Case Study: East Tanjung Karang, Bandar Lampung. IOP Conference Series: Earth and Environmental Science, 2021, 830(1): 012058.
DOI:10.1088/1755-1315/830/1/012058
17.
Kumar, S., Singh, P., Sushil, R. et al. Microtremor measurement to evaluate site characteristics by horizontal to vertical spectral ratio technique in Sikkim, Northeast Himalayas, India. Quaternary International, 2021.
DOI:10.1016/j.quaint.2020.11.028
18.
Li, C.-Y., Wu, J.-H., Lee, D.-H. et al. Investigating the Ground Characteristics Using HVSR Curves with Microtremor Measurements: The Urban Area in Tainan | [利用微振儀單站水平/垂直頻譜比形探討地盤特性之研究:以臺南都會區為例]. Journal of the Chinese Institute of Civil and Hydraulic Engineering, 2021, 33(2): 125-138.
DOI:10.6652/JoCICHE.202104_33(2).0005
19.
Kumar, P., Mahajan, A.K. New empirical relationship between resonance frequency and thickness of sediment using ambient noise measurements and joint-fit-inversion of the Rayleigh wave dispersion curve for Kangra Valley (NW Himalaya), India. Environmental Earth Sciences, 2020, 79(11): 256.
DOI:10.1007/s12665-020-09000-8
20.
Rezaei, S., Shooshpasha, I., Rezaei, H. Evaluation of landslides using ambient noise measurements (case study: Nargeschal landslide). International Journal of Geotechnical Engineering, 2020, 14(4): 409-419.
DOI:10.1080/19386362.2018.1431354
21.
Rezaei, S., Shooshpasha, I., Rezaei, H. Evaluation of ground dynamic characteristics using ambient noise measurements in a landslide area. Bulletin of Engineering Geology and the Environment, 2020, 79(4): 1749-1763.
DOI:10.1007/s10064-019-01637-5
22.
Rezaei, S., Choobbasti, A.J. Site response evaluation through measuring the ambient noise (case study: Iran, Babol City). Innovative Infrastructure Solutions, 2020, 5(1): 23.
DOI:10.1007/s41062-020-0272-6
23.
Besedina, A.N., Kishkina, S.B., Kocharyan, G.G. et al. Microseismic Noise before and after Strong Earthquakes: Case Study of Chilean Subduction Zone. Izvestiya, Physics of the Solid Earth, 2020, 56(2): 151-161.
DOI:10.1134/S1069351320020020
24.
Moon, S.-W., Subramaniam, P., Zhang, Y. et al. Bedrock depth evaluation using microtremor measurement: empirical guidelines at weathered granite formation in Singapore. Journal of Applied Geophysics, 2019.
DOI:10.1016/j.jappgeo.2019.103866
25.
Rezaei, S., Shooshpasha, I., Rezaei, H. Reconstruction of landslide model from ERT, geotechnical, and field data, Nargeschal landslide, Iran. Bulletin of Engineering Geology and the Environment, 2019, 78(5): 3223-3237.
DOI:10.1007/s10064-018-1352-0
26.
Asrillah, A., Marwan, M., Muksin, U. et al. Estimation of vs structure of krueng aceh and its suburb basin of aceh province, indonesia, derived from microtremor measurements. Geosciences (Switzerland), 2019, 9(4): 186.
DOI:10.3390/geosciences9040186
27.
Rezaei, S., Choobbasti, A.J. Evaluation of local site effect from microtremor measurements in Babol City, Iran. Journal of Seismology, 2018, 22(2): 471-486.
DOI:10.1007/s10950-017-9718-5
28.
Rezaei, S., Shooshpasha, I., Rezaei, H. Empirical correlation between geotechnical and geophysical parameters in a landslide zone (Case study: Nargeschal landslide) | [Correlación empírica entre parámetros geotécnicos y geofísicos en la zona de un deslizamiento de tierra. Caso de estudio: deslizamiento de nargeschal]. Earth Sciences Research Journal, 2018, 22(3): 195-204.
DOI:10.15446/esrj.v22n3.69491
Other cited types(0)
Catalog
Asskar Janalizadeh Choobbasti
Department of Civil Engineering, Babol University of Technology, P.O.Box 484, Babol, Mazandaran, Iran


 DownLoad: