Zhang P, Song XD, Li JT, Wang XC and Zhang XZ (2024). Crustal and uppermost mantle structure of the northeastern Qinghai-Xizang Plateau from joint inversion of surface wave dispersions and receiver functions with P velocity constraints. Earthq Sci 37(2): 93–106,. DOI: 10.1016/j.eqs.2024.01.014
Citation:
Zhang P, Song XD, Li JT, Wang XC and Zhang XZ (2024). Crustal and uppermost mantle structure of the northeastern Qinghai-Xizang Plateau from joint inversion of surface wave dispersions and receiver functions with P velocity constraints. Earthq Sci 37(2): 93–106,. DOI: 10.1016/j.eqs.2024.01.014
Zhang P, Song XD, Li JT, Wang XC and Zhang XZ (2024). Crustal and uppermost mantle structure of the northeastern Qinghai-Xizang Plateau from joint inversion of surface wave dispersions and receiver functions with P velocity constraints. Earthq Sci 37(2): 93–106,. DOI: 10.1016/j.eqs.2024.01.014
Citation:
Zhang P, Song XD, Li JT, Wang XC and Zhang XZ (2024). Crustal and uppermost mantle structure of the northeastern Qinghai-Xizang Plateau from joint inversion of surface wave dispersions and receiver functions with P velocity constraints. Earthq Sci 37(2): 93–106,. DOI: 10.1016/j.eqs.2024.01.014
Crustal and uppermost mantle structure of the northeastern Qinghai-Xizang Plateau from joint inversion of surface wave dispersions and receiver functions with P velocity constraints
• High-resolution images of crustal vS and vP/vS structures in the NE Qinghai-Xizang Plateau were obtained from a joint inversion with vP constraints after H-κ-c correction.
• Low-velocity zones (LVZs) and higher vP/vS ratios in the Songpan-Ganzi terrane and the Qilian Orogen may suggest crustal partial melting.
• LVZs in the mid-lower crust and uppermost mantle were correlated in most of the study region, forming patches of weaker crust and mantle lithosphere.
• Lithospheric-scale deformation is the preferred mechanism of continuous shortening accounting for deformation and growth of the NE Qinghai-Xizang Plateau.
Abstract
Lithospheric structure beneath the northeastern Qinghai-Xizang Plateau is of vital significance for studying the geodynamic processes of crustal thickening and expansion of the Qinghai-Xizang Plateau. We conducted a joint inversion of receiver functions and surface wave dispersions with P-wave velocity constraints using data from the ChinArray II temporary stations deployed across the Qinghai-Xizang Plateau. Prior to joint inversion, we applied the H-κ-c method (Li JT et al., 2019) to the receiver function data in order to correct for the back-azimuthal variations in the arrival times of Ps phases and crustal multiples caused by crustal anisotropy and dipping interfaces. High-resolution images of vS, crustal thickness, and vP/vS structures in the Qinghai-Xizang Plateau were simultaneously derived from the joint inversion. The seismic images reveal that crustal thickness decreases outward from the Qinghai-Xizang Plateau. The stable interiors of the Ordos and Alxa blocks exhibited higher velocities and lower crustal vP/vS ratios. While, lower velocities and higher vP/vS ratios were observed beneath the Qilian Orogen and Songpan-Ganzi terrane (SPGZ), which are geologically active and mechanically weak, especially in the mid-lower crust. Delamination or thermal erosion of the lithosphere triggered by hot asthenospheric flow contributes to the observed uppermost mantle low-velocity zones (LVZs) in the SPGZ. The crustal thickness, vS, and vP/vS ratios suggest that whole lithospheric shortening is a plausible mechanism for crustal thickening in the Qinghai-Xizang Plateau, supporting the idea of coupled lithospheric-scale deformation in this region.
The high topography and thick crust of the Qinghai-Xizang Plateau are the result of Indian-Eurasian continental collision, a process ongoing for approximately 50–60 million years (Molnar and Tapponnier, 1975; Yin and Harrison, 2000). Debates surrounding the uplift and growth of the Qinghai-Xizang Plateau have given rise to three main models. The rigid block model (e.g., Tapponnier et al., 2001) suggests stepwise Qinghai-Xizang Plateau growth, primarily through deformation along strike-slip faults. The continuous deformation model suggests that due to the coupling of the crust and uppermost mantle, stress can transfer within and across blocks, resulting in broad lithospheric deformation (e.g., England and Houseman, 1986; Zhang PZ et al., 2004). The crustal flow model (e.g., Royden et al., 1997; Clark and Royden, 2000) suggests that the mid-lower crust moves southeast around the Sichuan Basin and northeast around the Ordos Block, contributing to the topographic gradient around the Qinghai-Xizang Plateau.
The northeastern Qinghai-Xizang Plateau, due to its strategic location and a history of significant earthquakes, serves as an ideal site for studying Qinghai-Xizang Plateau deformation and uplift. Some receiver function (RF) studies indicate moderate to low crustal vP/vS ratios beneath the northeastern Qinghai-Xizang Plateau margin, accompanied by crustal azimuthal anisotropy. These findings align more closely with the whole-lithosphere shortening model (e.g., Pan SZ and Niu FL, 2011; Li XF et al., 2015; Ye Z et al., 2015; Wang Q et al., 2016; Wang WL et al., 2017; Huang ZC et al., 2017). Tomography studies have identified widespread mid-crustal low-velocity zones (LVZs) in the Songpan-Ganzi terrane (SPGZ) (e.g., Bao XW et al., 2013; Li HY et al., 2014; Shi YT et al., 2021; Yang YJ et al., 2012), consistent with the crustal flow model. Additionally, the observed Moho offsets (e.g., Zhu LP and Helmberger, 1998; Zhang ZJ et al., 2011; Ye Z et al., 2015) and the correlation between GPS and SKS splitting (e.g., Li J et al., 2011; León Soto et al., 2012; Chang LJ et al., 2017) support coupled lithospheric-scale deformation (e.g., Tapponnier et al., 2001; Yin A et al., 2008; Ye Z et al., 2015). Images from joint inversion of the RFs and surface wave dispersions indicated that the rigid block model and crustal flow model could be concomitant (e.g., Liu QY et al., 2014). In summary, despite numerous geophysical investigations, the deformation mechanism in this region remains a subject of debate. Well-constrained models encompassing crustal thickness, velocity, and vP/vS ratios are crucial for understanding Qinghai-Xizang Plateau uplift and growth.
To mitigate trade-offs between model parameters and inversion result ambiguities, joint inversion of independent datasets is a common practice (e.g., Julià et al., 2000; Bao XW et al., 2015a; Zheng C et al., 2016; Li JT and Song XD, 2021; Li MK et al., 2022; Li YH et al., 2023). However, for the conventional joint inversion of RFs and surface wave dispersions, the Moho depth is significantly influenced by the vP/vS ratio in the crust, which is often unconstrained and is normally set to a global average (1.75). Based on the method of Xu ZJ et al. (2013), Li JT et al. (2017) developed a new method that incorporates independently constrained P-wave information into the joint inversion. This method, incorporating an independent vP model, enables simultaneous inversion of the vS structure of the crust and uppermost mantle as well as the crustal vP/vS ratio. To enhance our understanding of the lithospheric structure in the northeastern Qinghai-Xizang Plateau, we utilized data recorded by 673 temporary stations (ChinArray II) and first implemented the improved H-κ method with azimuthal corrections (H-κ-c) for all the RFs. Subsequently, we applied a nonlinear joint inversion, which incorporated the P-wave velocity model constraint, to the corrected RFs and surface wave dispersions. This joint inversion scheme reduced model ambiguity and enabled us to simultaneously resolve lithospheric S-wave velocity, crustal thickness, and crustal vP/vS ratio in the study area. Our seismic images provide detailed insights into the low-velocity anomalies beneath the Qinling Orogen, SPGZ, and Qilian Orogen, supporting the notion of coupled lithospheric-scale deformation in this region.
2.
Data and methods
2.1
Data
Three independent datasets were used in this study: P-wave RFs, dispersion curves of surface wave group and phase velocities, and a P-wave velocity (vP) model of the crust. These datasets were assembled with the temporary stations in northeastern Qinghai-Xizang Plateau.
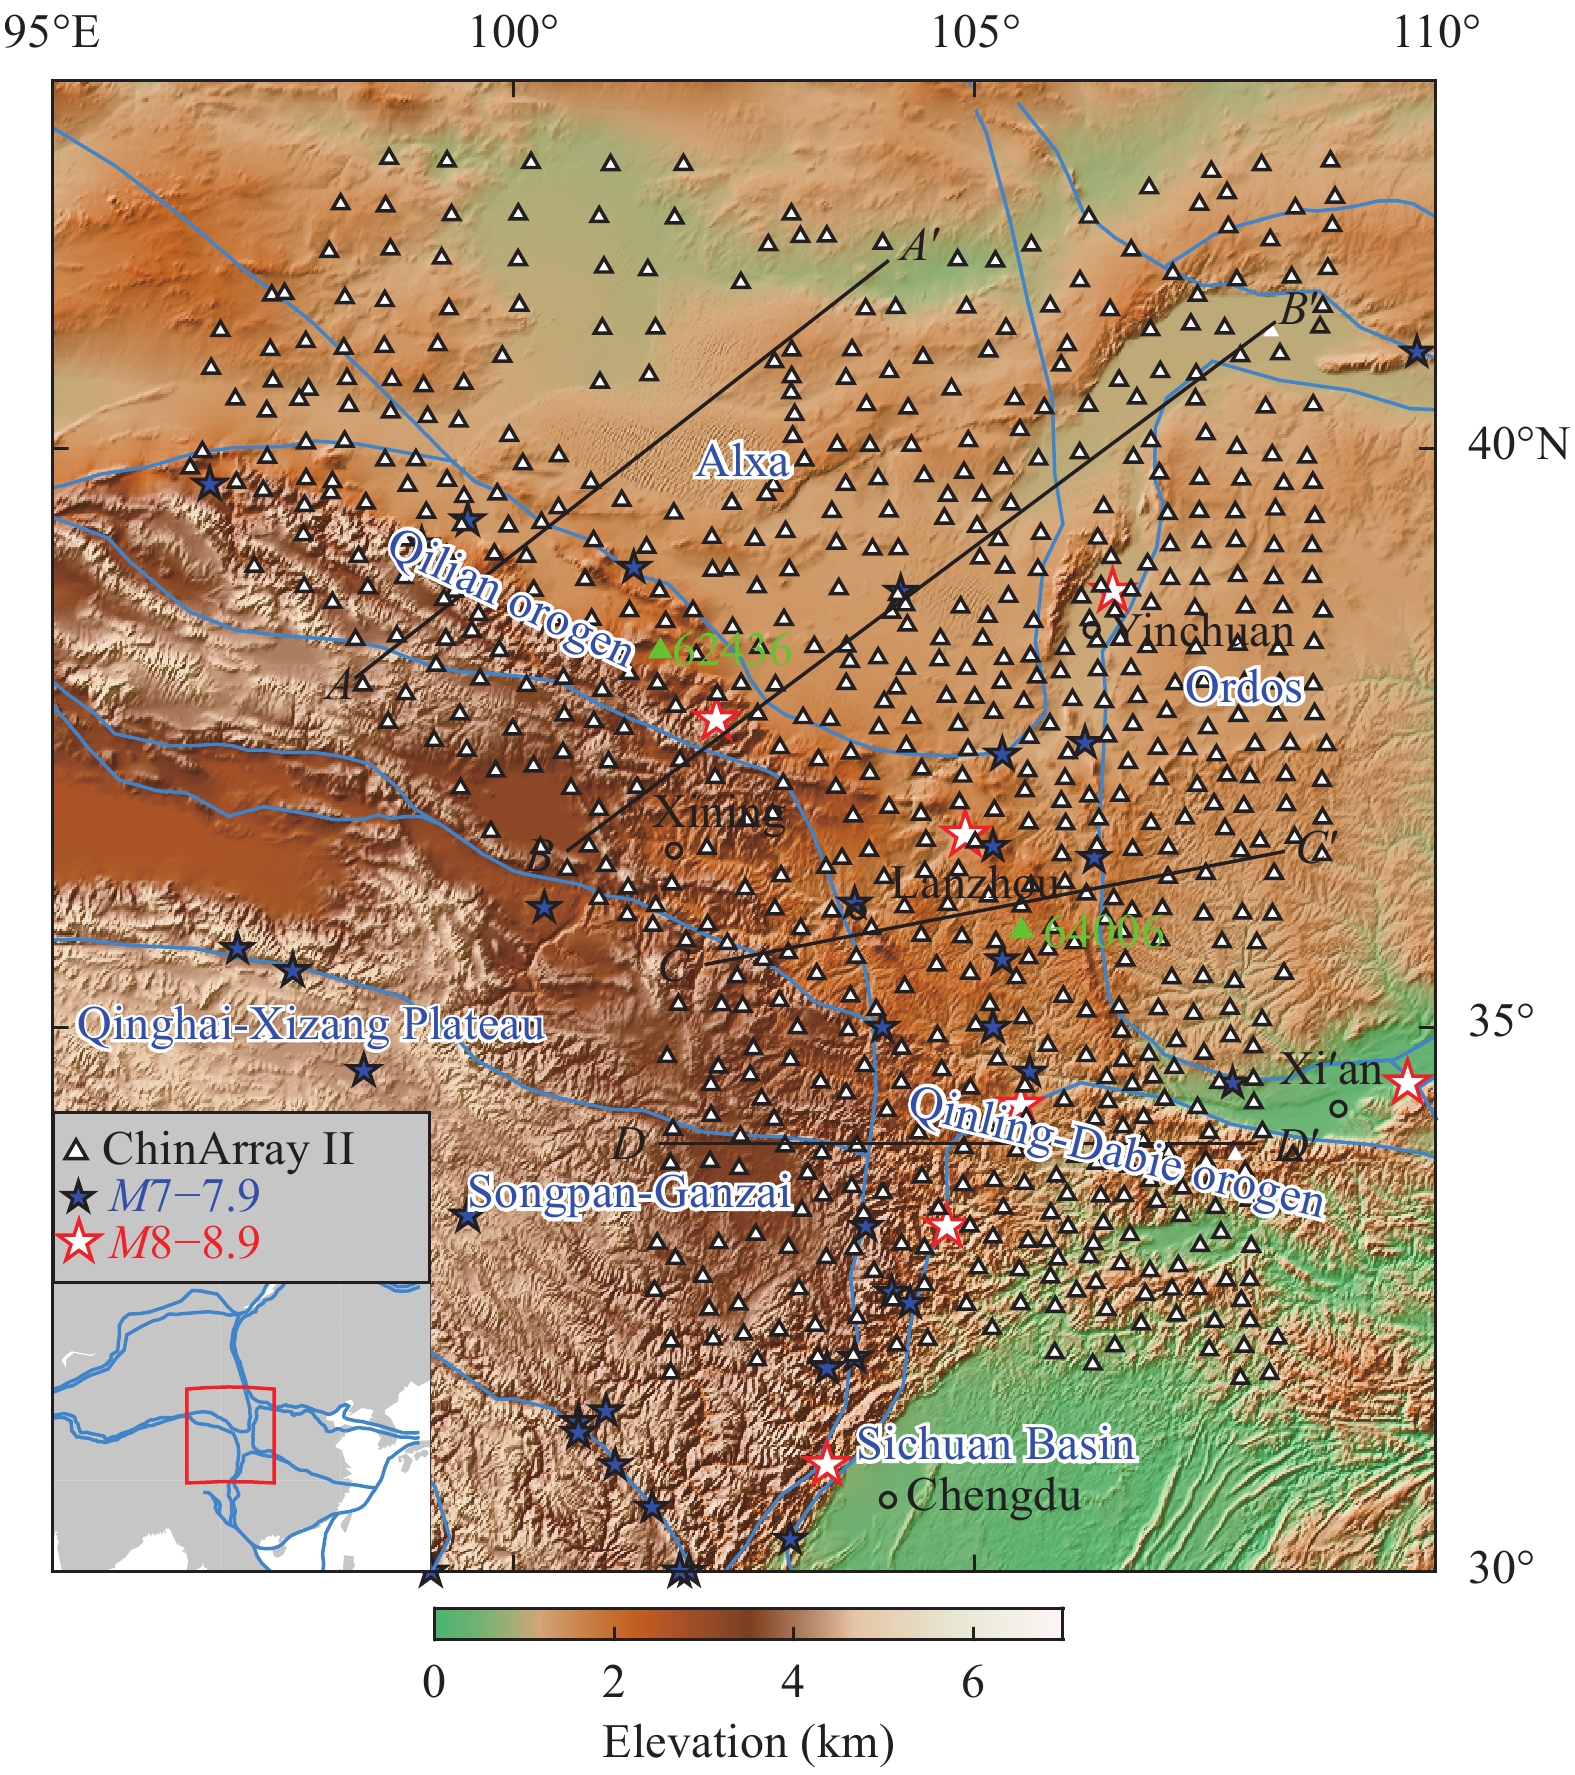
RFs were obtained from teleseismic P-waveforms recorded at 673 broadband stations of the China Array (Phase II), deployed on the northeastern Qinghai-Xizang Plateau from September 2013 to April 2016 (Figure 1). To extract the RFs, earthquakes with magnitudes MW≥5.5 and epicentral distances ranging from 30° to 90° were selected. To generate the RFs, the waveform data were first decimated to 10 samples per second and a 0.02 to 1 Hz band-pass filter was applied. Next, the time-domain iterative deconvolution method (e.g., Ligorría and Ammon, 1999) was employed to obtain P-wave RF waveforms. To account for back-azimuthal variations in the arrival times of Ps phases and crustal multiples caused by crustal anisotropy and dipping interfaces, we utilized the H-κ-c method (e.g., Li JT et al., 2019) to correct the RFs. A low-pass filter with a Gaussian parameter of 2.0 was used to remove high-frequency noise. We also visually inspected all the RFs and removed those without clear first P and/or Ps arrival phases. All the RFs with a clear Ps phase at each station were stacked into one RF, after moveout correction (e.g., Yuan XH et al., 1997) at a reference slowness of 6.4 s/deg using the IASP91 model (e.g., Kennett and Engdahl, 1991) and H-κ-c corrections. Finally, after harmonic correction and stacking, the RFs from the 649 stations were used in the joint inversion.
The group and phase velocity dispersion data (at periods of 10–70 s) at each station site were extracted from the surface wave tomography results for Chinese mainland (e.g., Bao XW et al., 2015b), which were obtained from more than 700,000 dispersion curves recorded at 1, 316 seismic stations, to generate group and phase velocity maps at periods of 10–140 s. Our crustal vP model was sourced from an updated unified seismic tomography model of the continental China lithosphere, USTCLitho2.0 (e.g., Han SC et al., 2022). The USTClitho2.0 model uses 10 years of body-wave arrival times and surface-wave dispersion data; see details on the vP model construction in Han SC et al. (2022).
2.2
Method
Our joint inversion followed the scheme developed by Li JT et al. (2017) for the joint inversion of RFs and surface wave dispersion curves (modified from Xu ZJ et al., 2013) with vP constraints. The joint inversion was divided into two steps. First, the vS profile at each station site was inverted using only the dispersion data. Next, based on this vS model and the constraints of crustal vP values, the fast global searching Neighborhood Algorithm (NA) (e.g., Sambridge, 1999) was used to minimize the misfit of the RFs and dispersions with model damping and smoothing. The objective function is constructed as follows:
min
(1)
where the first term is the RF misfit and the second term is the dispersion misfit. {D}_{{\rm{obs}}} is the data that we are trying to fit, and {D}_{{\rm{pred}}} is the prediction from a random model generated by the NA. Here, {w}_{1} and {w}_{2} are the relative weights of the RF and dispersion misfit, respectively. The weightings were chosen empirically. After many experiments, {w}_{1} =1 and {w}_{2} =1 were selected for our joint inversion. The third term of Equation 1 represents the model constraints. λ is the damping parameter; m is the model parameter (S-wave velocity or interface depth) and {m}_{0} is the reference model. The fourth term is the smoothing constraint, where φ is the smoothing parameter and L is the Laplacian operator (e.g., Lees and Crosson, 1989). Another advantage of the joint inversion method is the introduction of a sedimentary layer in the parameterization, which significantly improves the waveform fitting of the RFs; omitting this feature from the inversion may result in artifacts in both the shallow and deep crust (e.g., Li JT et al., 2017). We also set a fixed vP/vS of 2.0 for the sedimentary layer (e.g., Shen WS et al., 2013) and fixed the mantle vP/vS to the global average of 1.8 (e.g., Li JT et al., 2017; Ye Z et al., 2017).
Figure
1.
Distribution of ChinArray II stations (triangles) used in this study, with topography (color), the main crustal blocks (labeled, boundaries indicated by dark blue lines) and major historical earthquakes (M>7) (stars). The green triangles indicate the two example stations used for the joint inversion demonstration in Figure 2. Black lines AA' to DD' indicate the locations of the velocity cross sections in Figure 5.
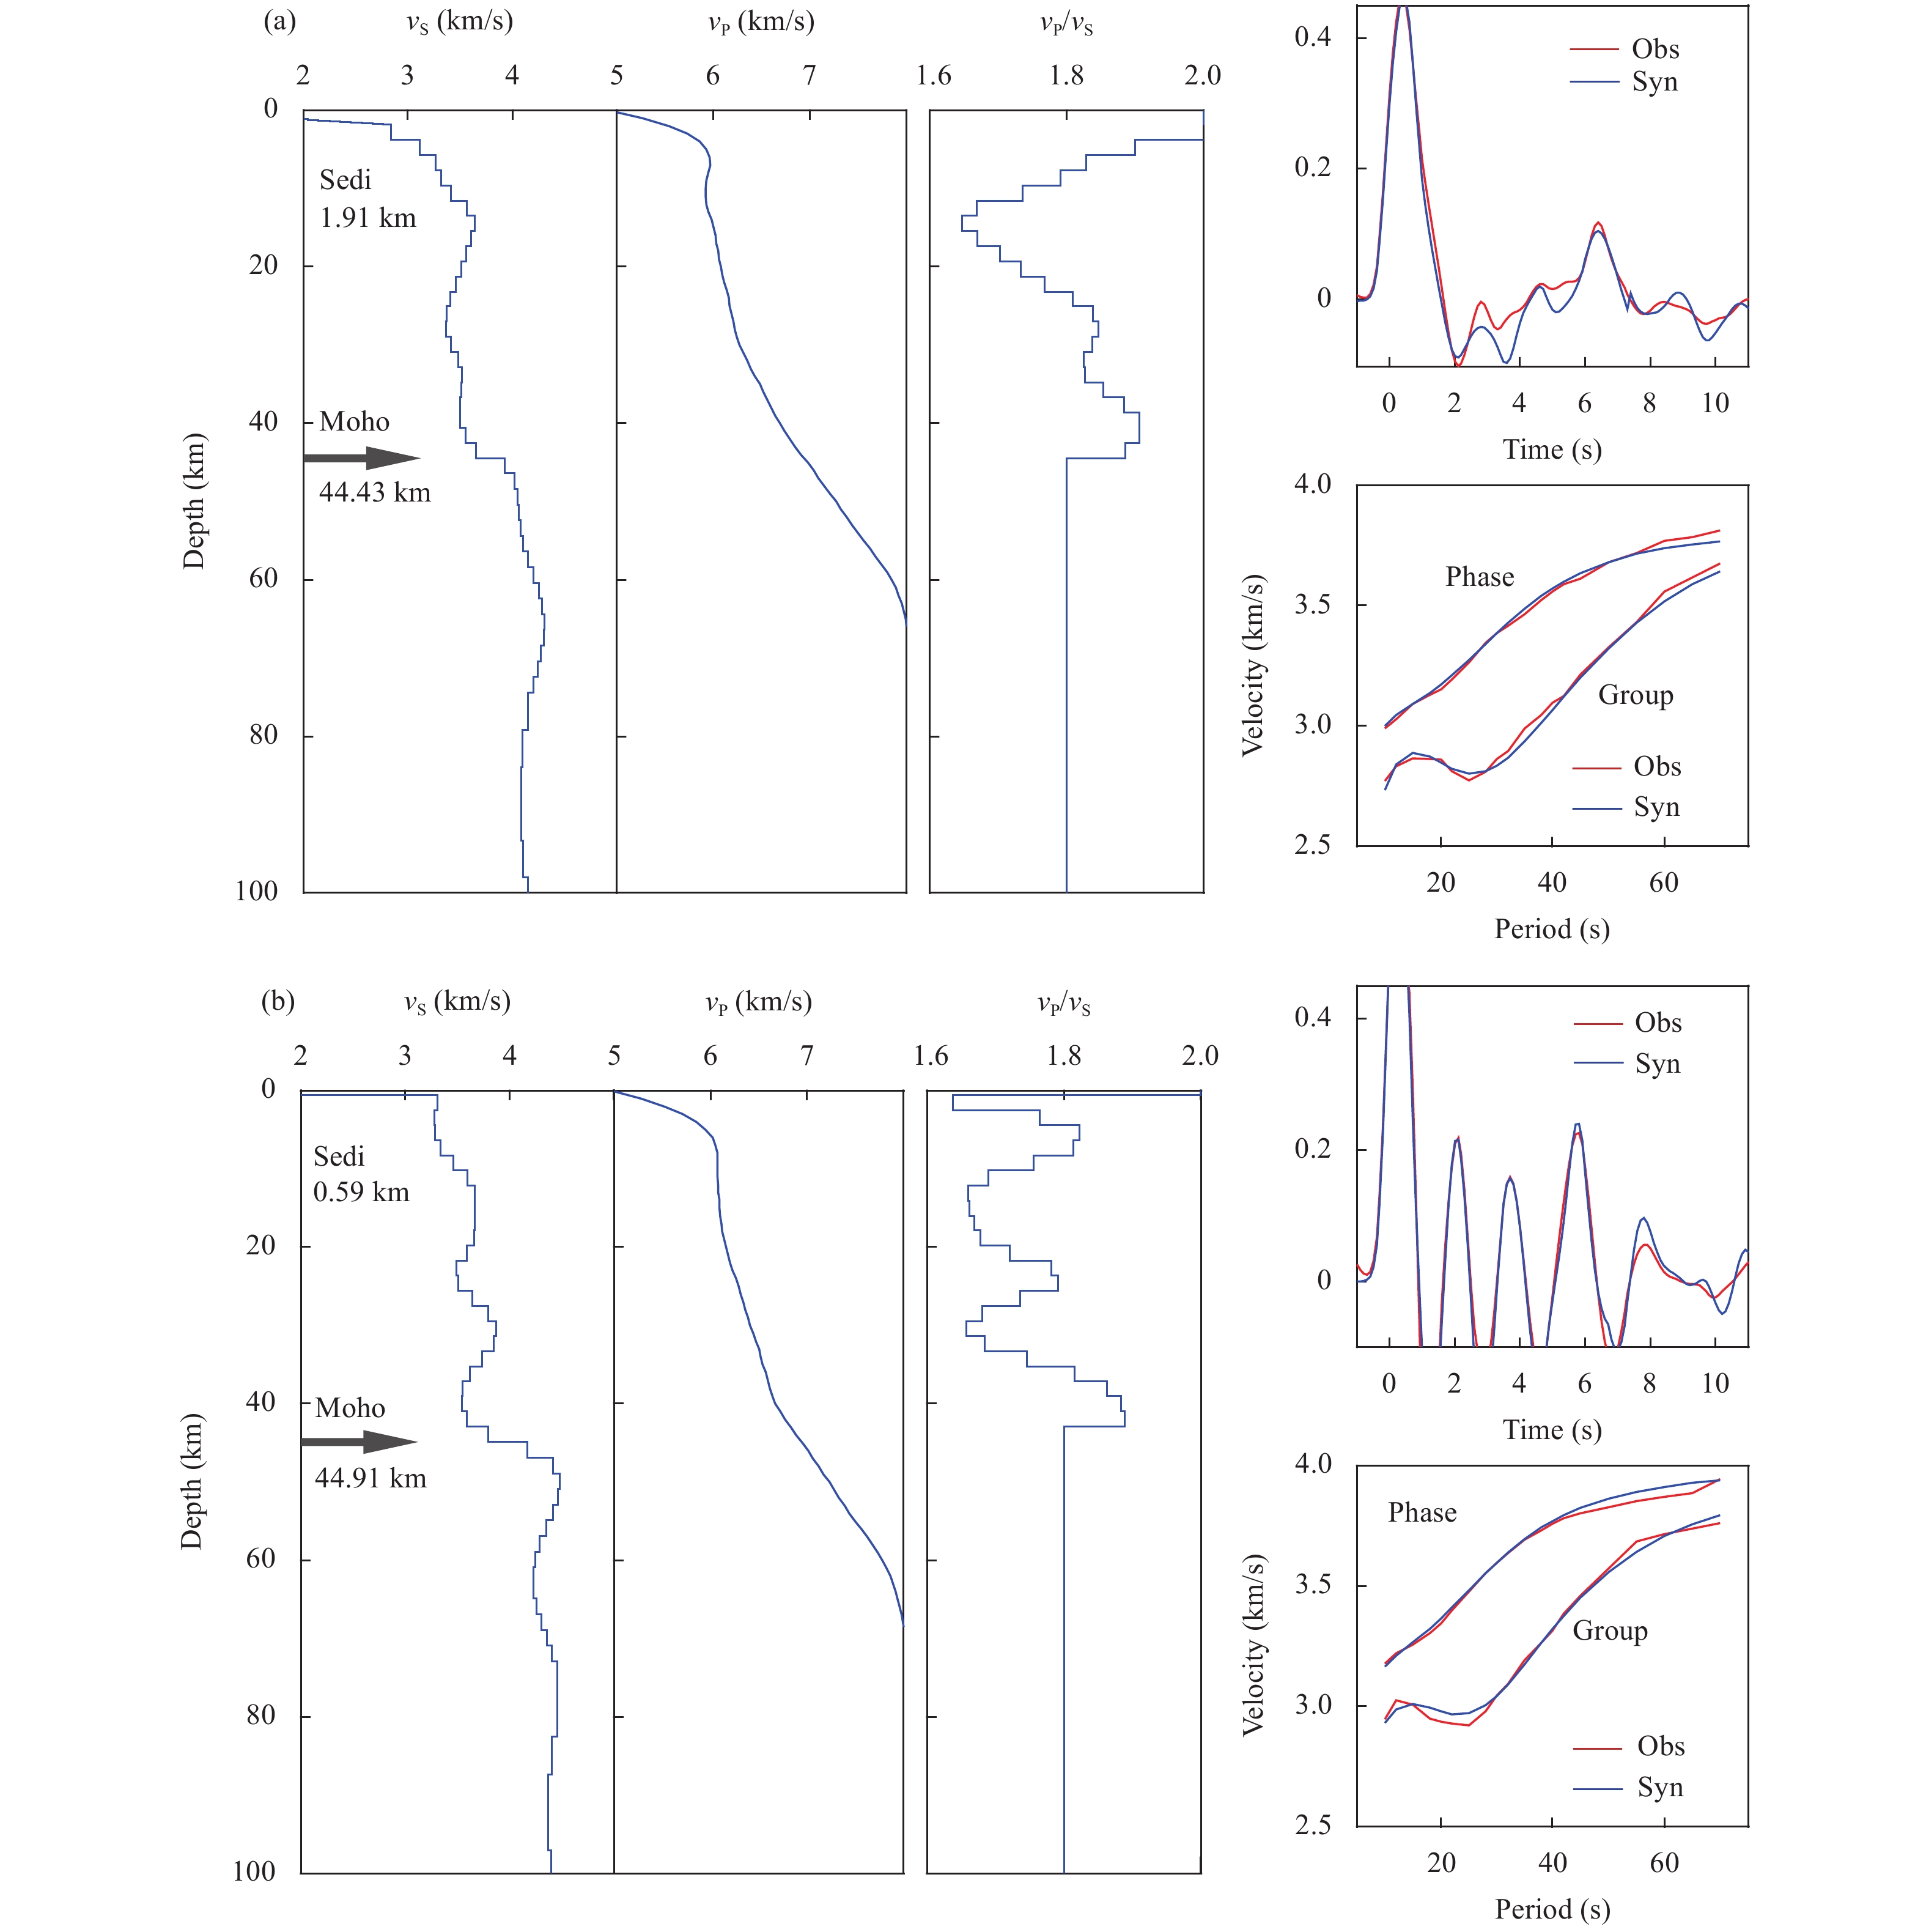
High-resolution images of lithospheric S-wave velocity, crustal thickness, and crustal vP/vS ratio were obtained for the northeastern Qinghai-Xizang Plateau from the joint inversion of surface wave dispersions and RFs with P velocity constraints. Before interpreting these results, we inspected them at two representative stations, as shown in Figure 2. The nearly perfect fit of the RFs and surface wave dispersions confirmed the robustness of the joint inversion results. The smoothed crustal P-wave velocities and vP/vS variations in Figure 2 also imply that anomalous vP/vS ratios originate mainly from vS anomalies, which confirms the results obtained by Li JT et al. (2017) and Deng YF et al. (2018).
Figure
2.
Examples of joint inversion of RFs and surface wave dispersions with vP constraints for (a) station 62436 and (b) station 64006 (locations shown in Figure 1). The panels for each station show the best-fitting vS model from the joint inversion, the input vP model from USTClitho2.0 (Han SC et al., 2022), the derived vP/vS ratio, the observed (red) and predicted (blue) RFs, and the observed (red) and predicted (blue) group and phase dispersion curves, respectively. The arrow indicates the Moho depth obtained from the joint inversion.
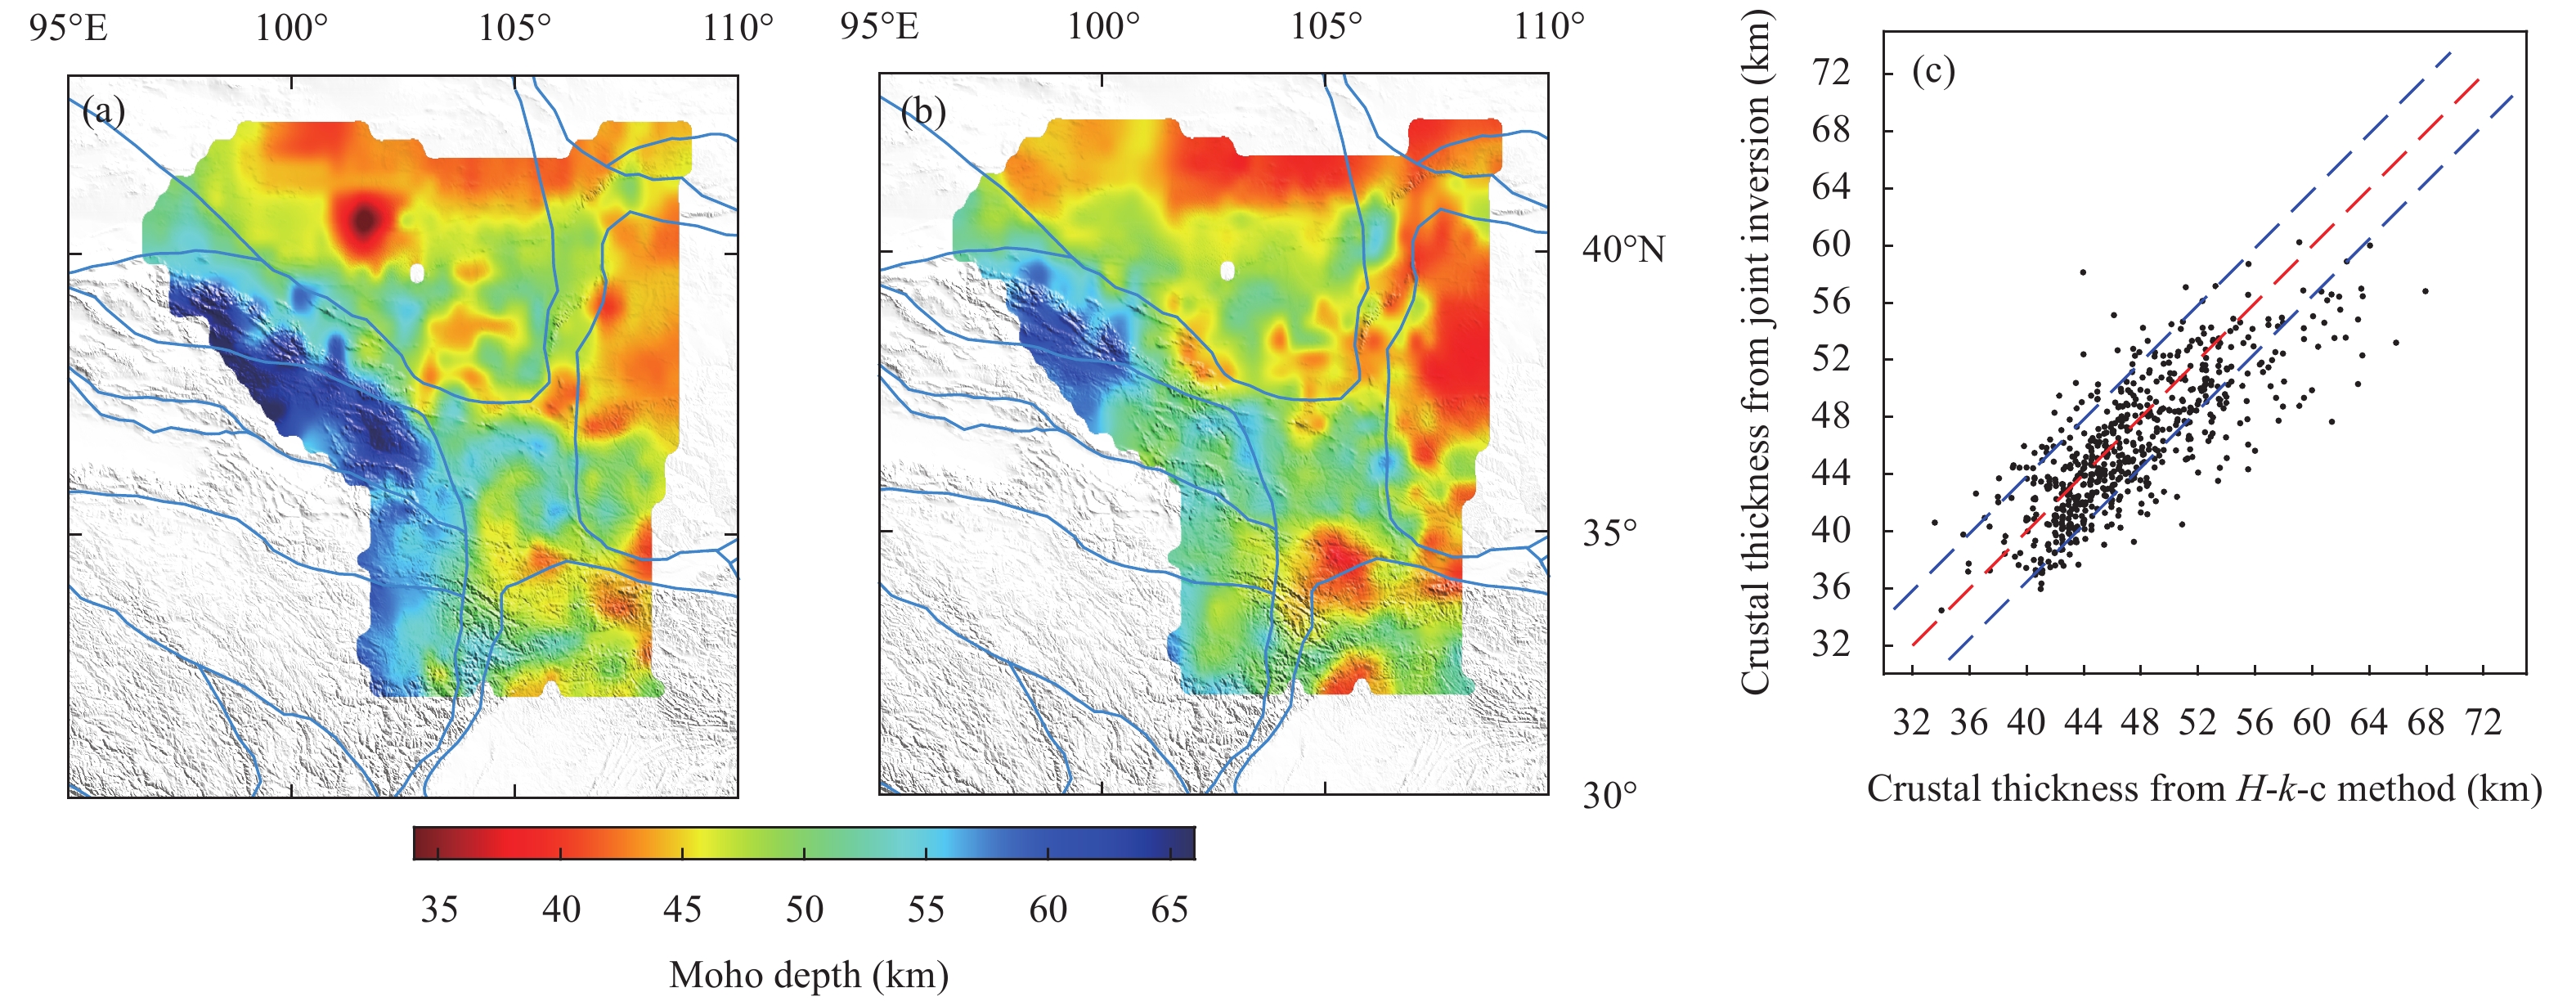
An initial vS model, obtained by inverting only the dispersion data, is commonly utilized in joint inversion to speed up the convergence of the NA search (e.g., Xu ZJ et al., 2013). Similarly, before the joint inversion, we corrected all of the RFs using the H-κ-c method (e.g., Li JT et al., 2019) to improve the inversion. The inverted Moho depth is shown in Figure 3a. Crustal thickness exhibits a good spatial correlation with the tectonic blocks in the study area. The Moho depth decreases from the center of the northeastern Qinghai-Xizang Plateau towards the edge. The thickest crust occurs in the western Qilian Orogen, whereas the stable Alxa and Ordos Blocks exhibit a thinner crust. There is an evident contrast between the thick crust in the SPGZ and the thin crust in the Qinling-Dabie Orogen to the east.
Figure
3.
Estimates of crustal thickness from this study. (a) Crustal thickness from RF inversion with the H-κ-c method. Dark blue lines indicate the block boundaries. (b) Same as (a), but for crustal thickness from the joint inversion. (c) Comparison of crustal thickness obtained using the two methods. The red dashed line indicates the same value of crustal thickness from the two methods. Blue dashed lines indicate ±3 km deviation from the same value.
The crustal thicknesses estimated using the joint inversion method with vP constraints are shown in Figure 3b. The crustal thickness varies from ~66 km in the northeastern Qinghai-Xizang Plateau to ~36 km in the Ordos Basin, which is consistent with previous estimates obtained with the RF method (e.g., Li XF et al., 2015; Pan SZ and Niu FL, 2011; Wang Q et al., 2016; Wang XC et al., 2017; Wang WL et al., 2017) and active-source seismic profiles (e.g., Liu MJ et al., 2006; Teng JW et al., 2013; Wang CY et al., 2014). Crustal thickness also exhibits significant lateral variation within each block. There is a remarkable contrast between the western and eastern Qilian terranes: the western Qilian Block features a thick crust (~65 km), whereas the eastern Qilian Block has a thin crust (~45 km). The crust is slightly thicker (~50 km) beneath the western Alxa Block and thinner (~45 km) beneath the eastern Alxa Block. The crustal thickness in the western Qinling terrane decreases from ~55 km in the west to ~40 km in the east.
Comparing the crustal thicknesses estimated by joint inversion with those obtained from RFs and the H-κ-c method (e.g., Li JT et al., 2019) reveals differences of less than 3 km at most of the stations (Figure 3c). The largest differences in crustal thickness occur in the Qilian Mountains, northwestern Ordos Basin, and northern Sichuan Basin, which coincide with block intersections and areas covered by thicker sedimentary layers.
3.2
Three-dimensional S-wave velocity model
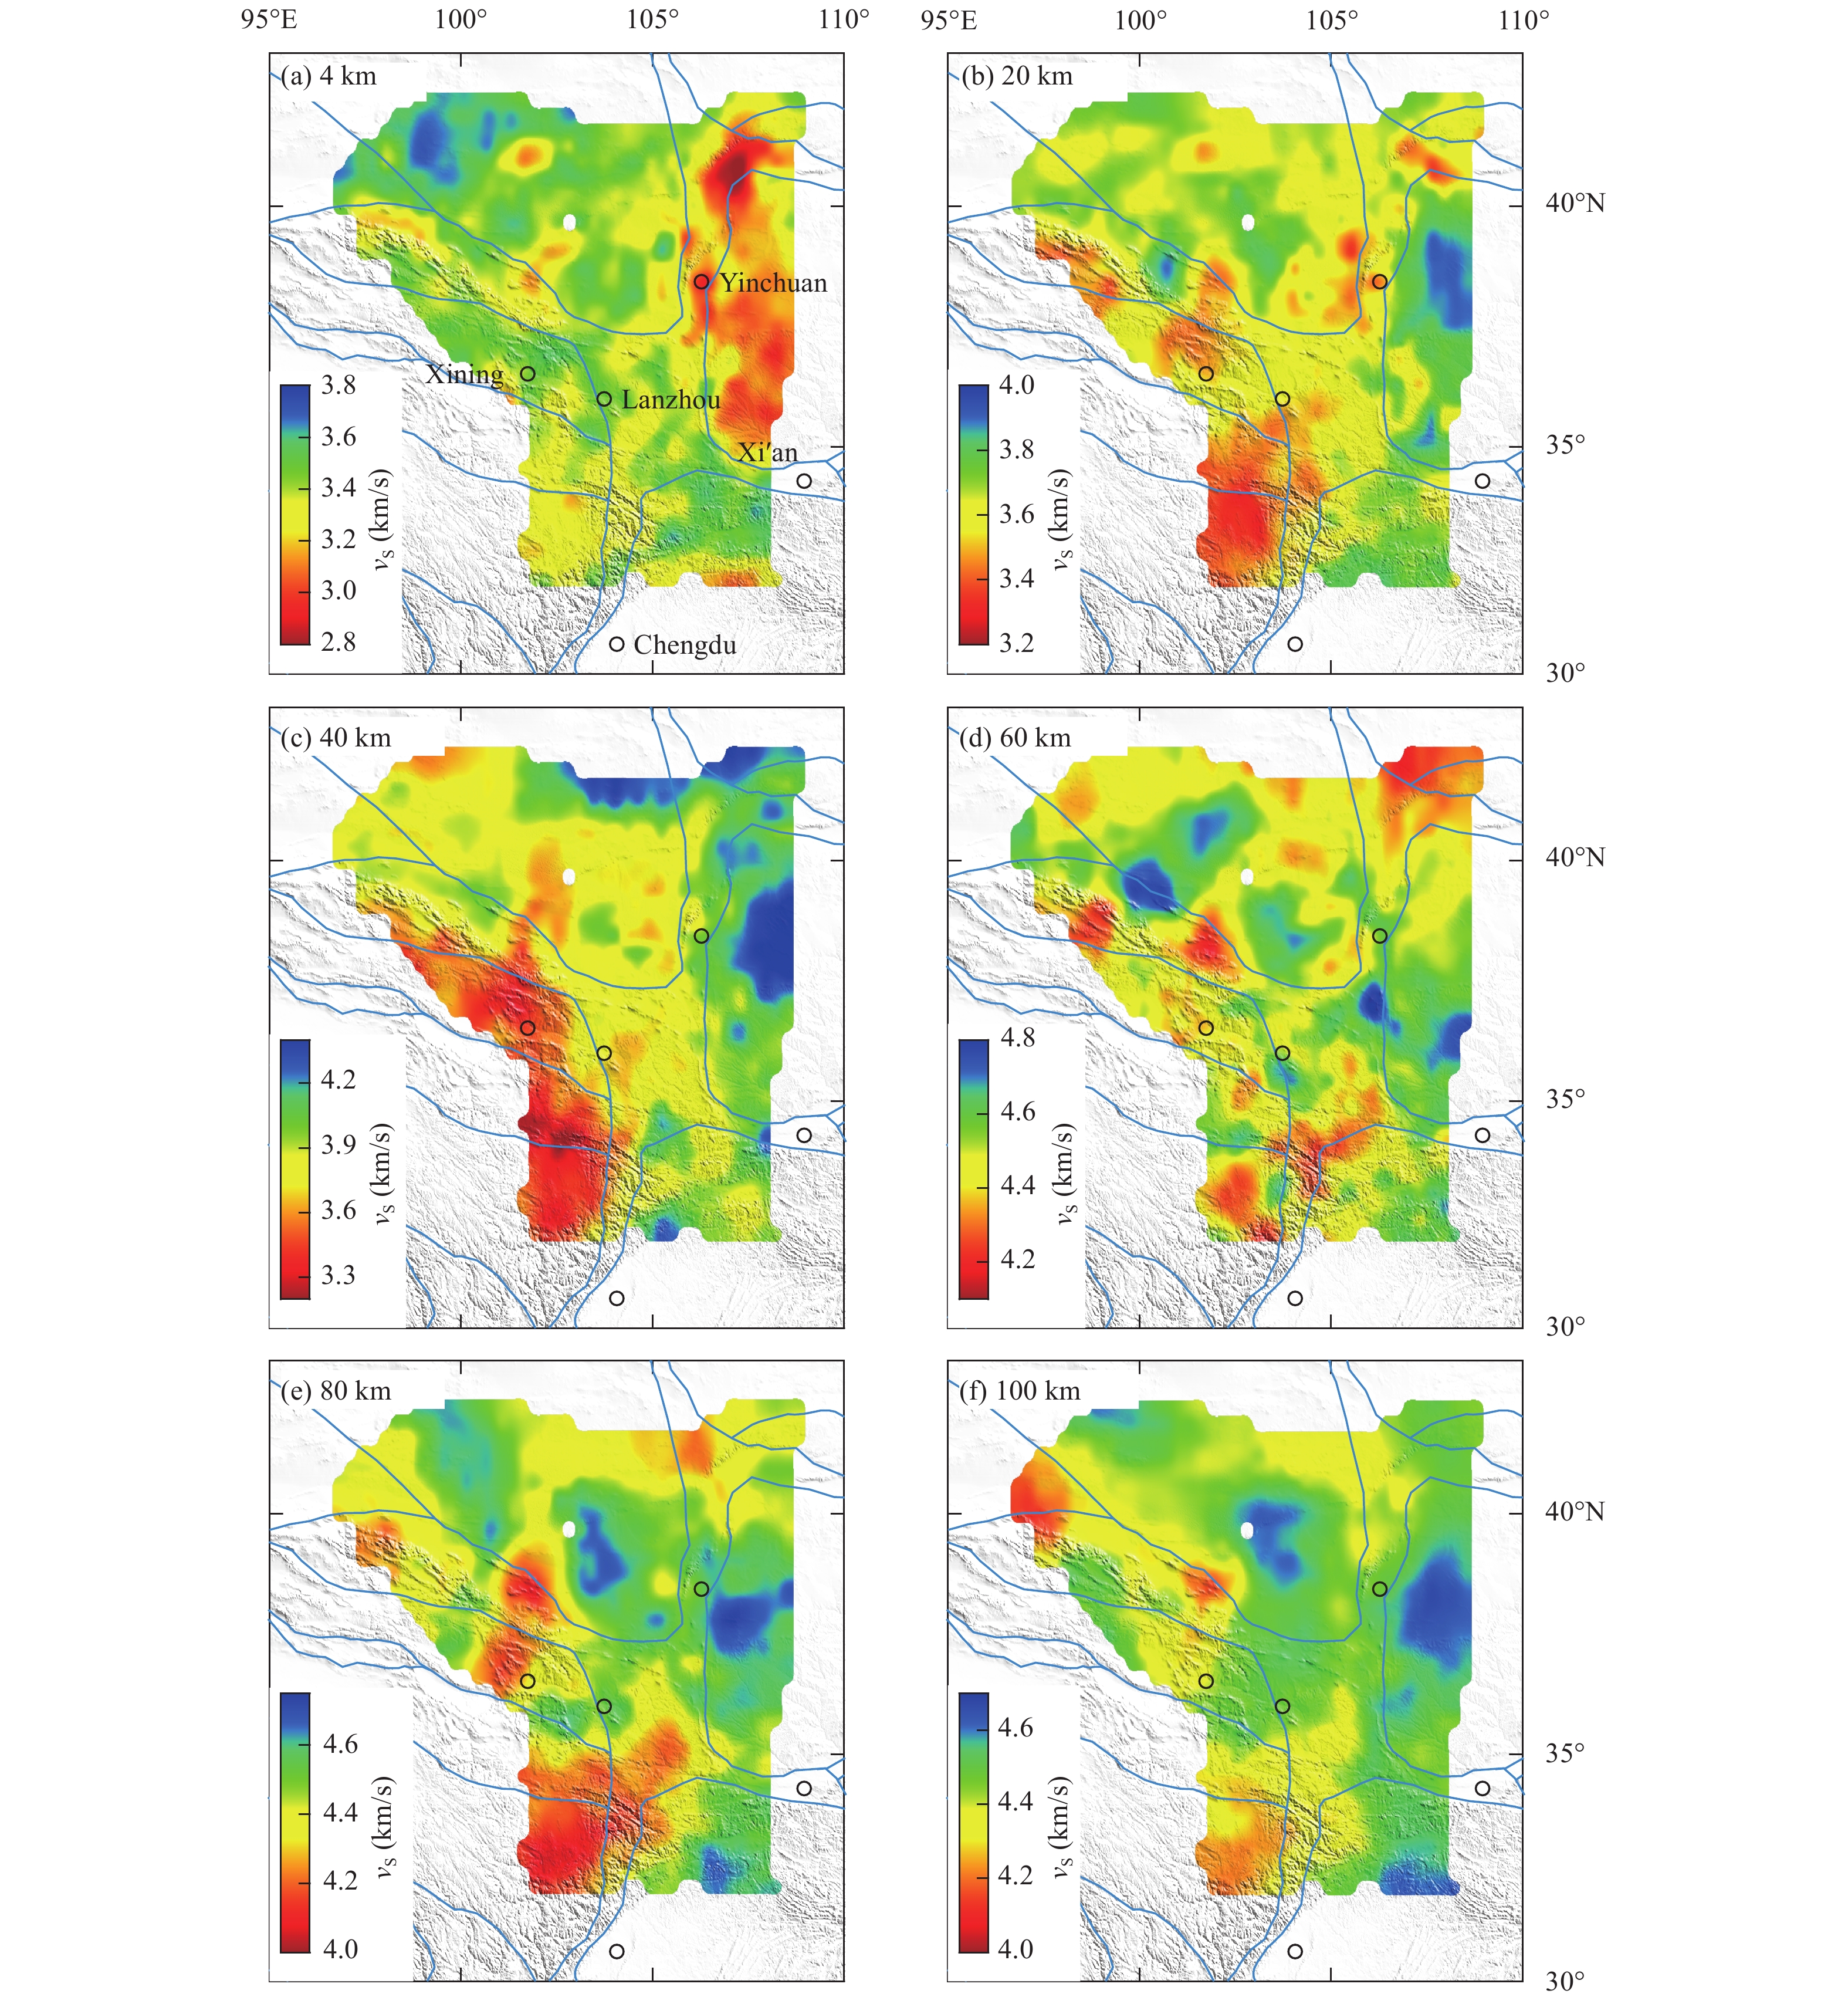
A high-resolution 3D S-wave velocity model of the crust and uppermost mantle beneath the northeastern Qinghai-Xizang Plateau was obtained from a joint inversion of the RFs and dispersions with independent vP model constraints. Below, we examine the S-wave velocity maps at depths of 4, 20, 40, 60, 80, and 100 km, as shown in Figure 4.
Figure
4.
Horizontal slices of the S-wave velocity model (color) at depths of (a) 4 km, (b) 20 km, (c) 40 km, (d) 60 km, (e) 80 km, and (f) 100 km. Dark blue lines represent the main block boundaries.
At a shallow depth of 4 km (Figure 4a), regions of high S-wave velocity occur in the Qinling Orogen, southern Qilian Orogen, and Alxa Block, while a low S-wave velocity anomaly lies below areas with thick sedimentary deposits, such as the Ordos Basin and Hetao Basin. Some low-velocity anomalies are also evident along the western Qilian Orogen, coinciding with sedimentary basins. The S-wave velocity is higher in the southeast Ordos Block than in the northwest, indicating a northwest-to-southeast decrease in sedimentary thickness in the Ordos Block. The 20-km depth slice (Figure 4b) reveals significantly low S-wave velocity anomalies in the upper crust of the SPGZ, west of the Qinling Orogen, and below the Qilian Orogen. The Ordos Basin exhibits a high S-wave anomaly, particularly in the northern part of the basin.
At a depth of 40 km (Figure 4c), the Hetao Basin, northern Ordos Basin, and Qinling Orogen show high S-wave velocities, implying a thin crust in these areas, as observed in Figure 3. With relatively low vS values, the Alxa and southern Ordos Blocks have begun to reach the mantle at this depth. In contrast, the northeastern Qinghai-Xizang Plateau, composed of the SPGZ and the Qilian Orogen, is still in the crust at this depth with a much lower S-wave velocity. The southwestern margin of the Ordos Block shows relatively lower velocity anomalies than the northern Ordos.
At a depth of 60 km, the SPGZ Block, North Qilian Orogen, and western part of the Qinling Orogen in the study area showed low-velocity anomalies (Figure 4d), whereas high S-wave velocities were present in most parts of the Alxa and Ordos Blocks. As shown in Figure 4e, the S-wave velocities at a depth of 80 km are well correlated with the block boundaries. Low S-wave velocities are generally observed in the Qilian Orogen, SPGZ, and western part of the Qinling Orogen. The eastern part of the Qinling Orogen and the entire Ordos and Alxa Blocks exhibit obvious high-velocity anomalies, whereas some low S-wave velocity anomalies remain at the boundary between the Ordos and Alxa Blocks.
At a depth of 100 km (Figure 4f), the Ordos and Sichuan Basins are characterized by high velocities, and the South Qilian Orogen also presents a higher S-wave velocity. In contrast, the SPGZ, western part of the North Qilian Orogen, and western part of the Alxa Block reveal obvious low-velocity anomalies.
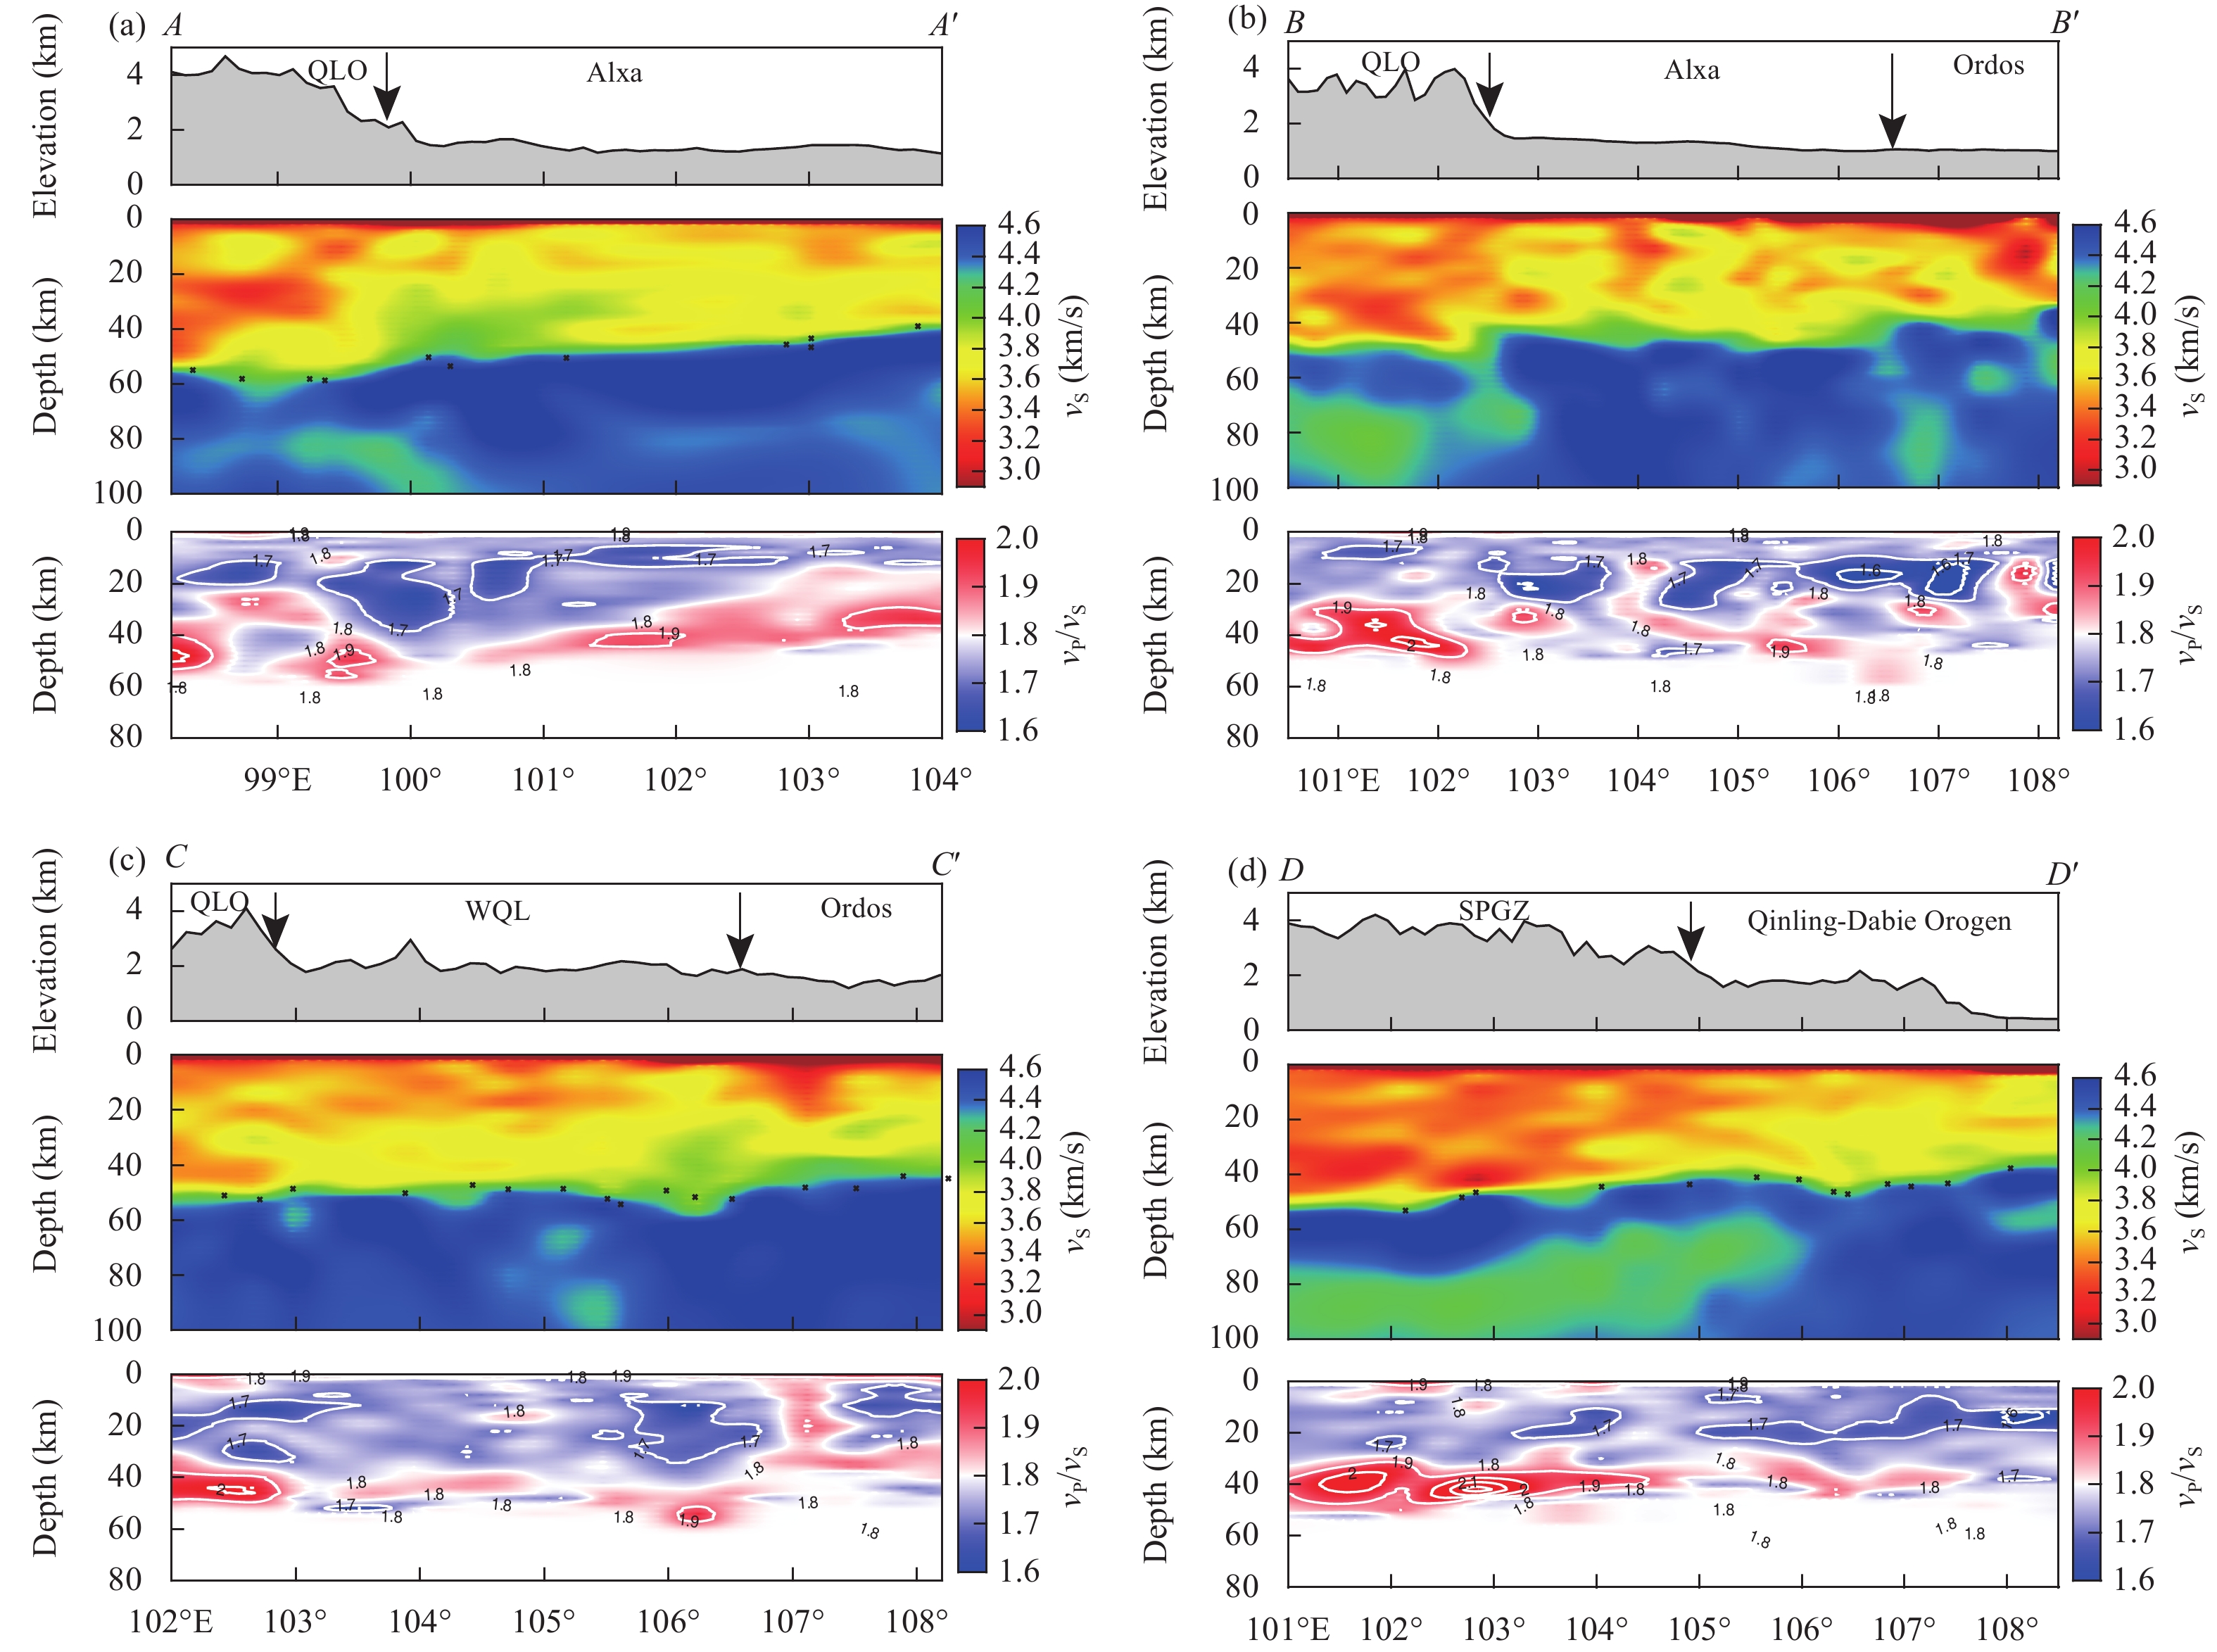
To better demonstrate the variations of the S-wave velocity and vP/vS ratio with depth, we plotted several vertical slices of the 3-D velocity model, as shown in Figure 5. The locations of the profiles were chosen to be nearly orthogonal to the Qinghai-Xizang Plateau orogeny margin (Figure 1). For the Qilian Orogen, massive low-velocity anomalies in the crust and uppermost mantle are evident in Figure 5a, 5b, and 5c, respectively. From west to east in the western Qilian Orogen, the S-wave velocity increases slightly, and the low-velocity crustal material becomes thinner. The southern Qilian Orogen not only contains low-velocity anomalies in the crust and uppermost mantle but also high vP/vS ratios in its mid-lower crust, indicating the presence of weak and ductile materials (Figure 5b).
Figure
5.
Vertical slices of the vS and vP/vS models (color) along selected profiles (a) AA′, (b) BB′, (c) CC′, and (d) DD′. The locations of the profiles are shown in Figure 1. The topography (top) and the Moho depth beneath each station (black crosses) are also plotted. Abbreviations: QLO: Qilian Orogen; WQL: western Qinling; SPGZ: Songpan-Ganzi terrane.
For the Alxa Block, S-wave velocities in the mid-lower crust show distinct features east and west of 103°E (Figure 5a and 5b). Beneath the western Alxa Block, S-wave velocity is significantly high, and the Moho is notably deep. The eastern part of the Alxa Block is closer to the stable Ordos Basin and has a stronger middle and lower crust. Overall, the Alxa Block exhibits a low crustal vP/vS ratio, except in the northeast, where the mid-lower crust shows relatively high vP/vS anomalies. In addition, the crustal thickness of the Alxa Block gradually decreases from west to east and south to north. There is a significant uplift of the Moho interface from the northern Qilian Orogen and east towards the boundary of the Alxa Block (Figure 5a and 5b), which corresponds with the undulation of the topography.
Our joint inversion model reveals a remarkable contrast between the SPGZ and Qinling-Dabie orogens (Figure 5d). Beneath the SPGZ in the west, crustal low-velocity anomalies are accompanied by high vP/vS ratios (>1.9) in the mid-lower crust. In contrast, the eastern Qinling-Dabie Orogen is characterized by higher crustal velocities and lower vP/vS ratios. Furthermore, a prominent LVZ (vS < 4.2 km/s) residing in the uppermost mantle is present beneath the SPGZ at depths of 70–100 km (Figure 5d). The high-velocity mass beneath the Qinling-Dabie Orogen indicates material with a high mechanical strength. Based on the apparent differences in velocity and vP/vS ratios, the boundary between the two tectonic elements can be confidently confirmed.
3.3
Three-dimensional crustal vP/vS
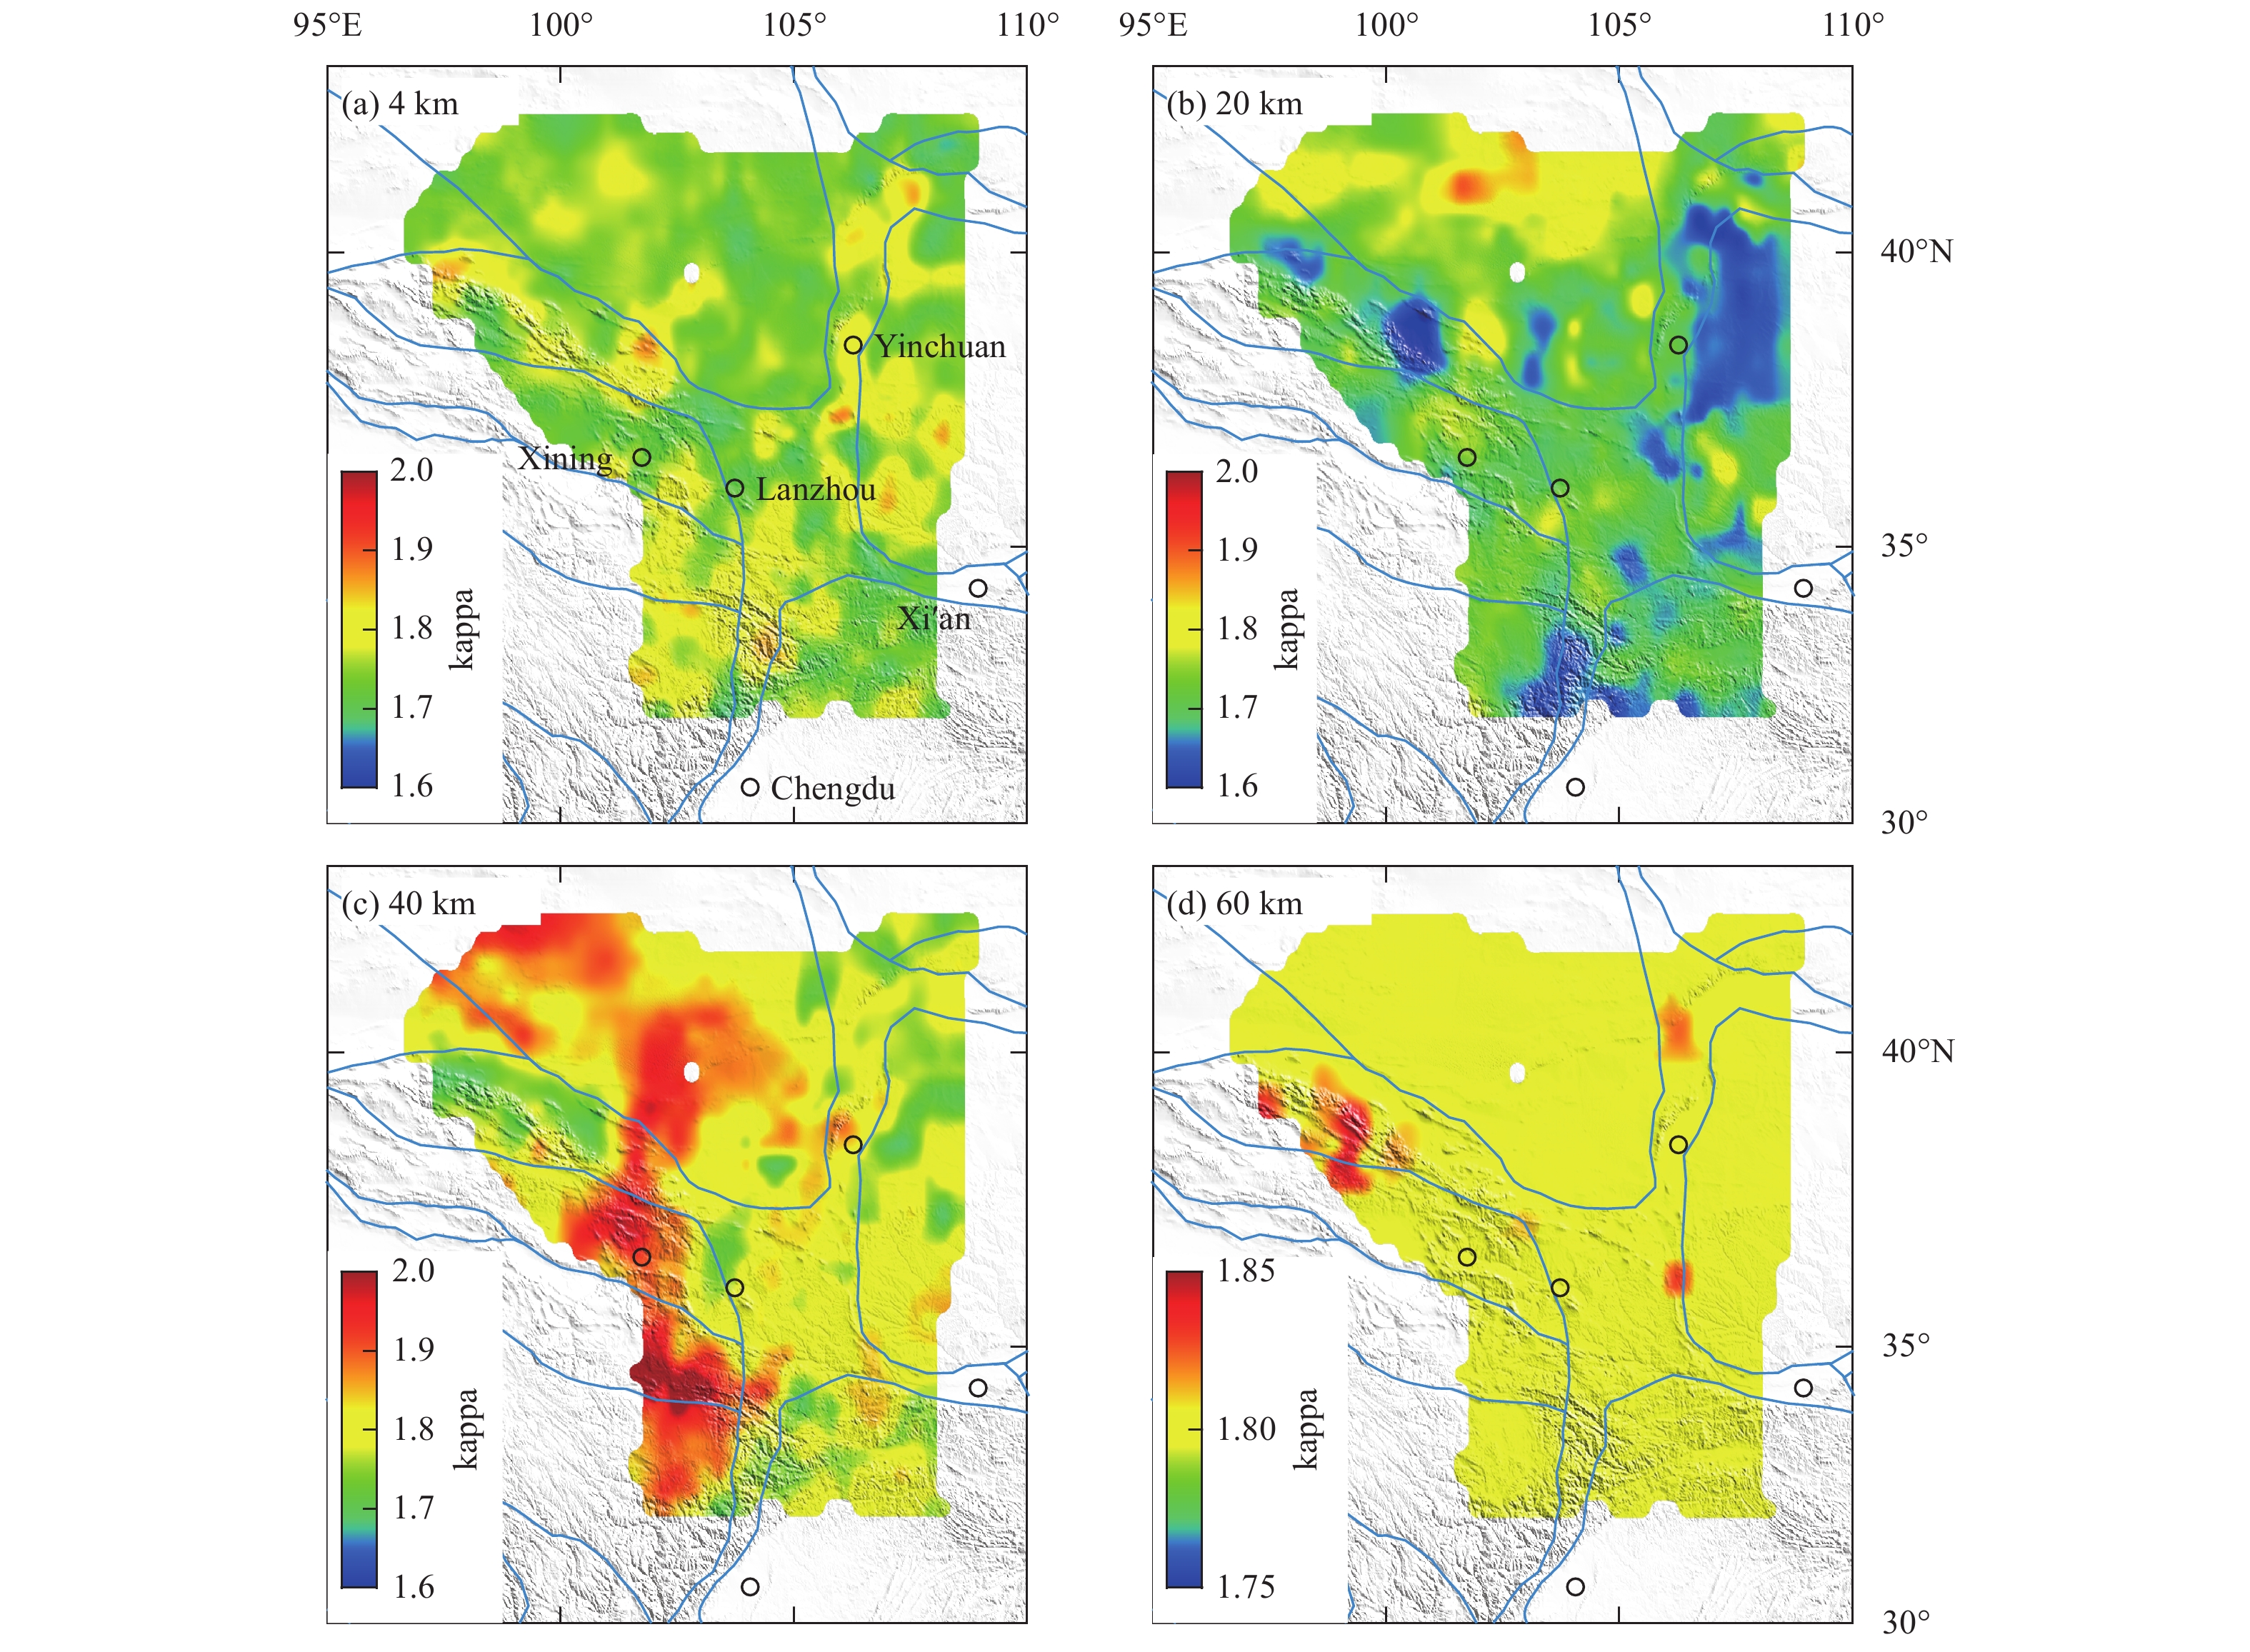
Studies of laboratory data have indicated that the vP/vS ratio is related to rock types and can be used to constrain the average bulk composition of the crust (e.g., Christensen, 1996). To shed light on the components of the crust, a 3D crustal vP/vS model was derived using joint inversion with P-wave velocity constraints. Figure 6 depicts the characteristics of vP/vS ratios at depths of 4, 20, 40, and 60 km.
Figure
6.
Horizontal slices of the vP/vS ratios (color) at depths of (a) 4 km, (b) 20 km, (c) 40 km, and (d) 60 km. Dark blue lines represent the main block boundaries. Note that the color bar in (d) presents a different scale to better indicate the variation in vP/vS ratios between crust and mantle.
At a shallow depth of 4 km (Figure 6a), the vP/vS ratio is fairly uniform (~1.7) across most of the study area. High vP/vS ratios can be seen below the SPGZ Block, western Qinling Orogen, and southern Ordos Block. Some high vP/vS ratios occur along the western Qilian Orogeny, coinciding with sedimentary basins. The upper crust slice (Figure 6b) plotted at a depth of 20 km reveals significantly low vP/vS anomalies in the northern Ordos Block, west of the Qilian Orogen, and below the northern Sichuan Basin. The northern Alxa Block shows high vP/vS anomalies (>1.8). Uniform vP/vS ratios can be observed in the remainder of the study area.
At a depth of 40 km (Figure 6c), vP/vS ratios in the lower crust vary significantly between the different blocks. The SPGZ Block, southern Qilian Orogen, and central Alxa Block show high vP/vS ratios (>1.9), implying the existence of partial melting in these areas, which correlates well with the low velocities shown in Figure 4c. The southern Ordos Block and Qinling Orogen possess relatively high vP/vS ratios (~1.8). Low vP/vS ratios (~1.7) were observed in the northern Ordos Block and western Qilian orogeny.
Because the mantle vP/vS ratio was fixed at the global average of 1.8 (e.g., Li JT et al., 2017; Ye Z et al., 2017), the horizontal slice at a depth of 60 km (Figure 6d) shows a fairly constant vP/vS ratio of 1.8 across the Alxa Block, Ordos Block, and Qinling Orogen. The northeastern Qinghai-Xizang Plateau, composed of the Songpan-Ganzi Block and the Qilian Orogen, also exhibits high vP/vS ratios (≥1.8), as most of this material lies in the mantle. High vP/vS ratios (>1.8) beneath the western Qilian Orogen imply that the Orogen is still in the crust at this depth, which is consistent with the thick Moho in Figure 3b.
4.
Discussion
4.1
Crustal LVZs in the northeastern Qinghai-Xizang Plateau
Recent seismic tomographic and active source images (e.g., Bao XW et al., 2015a, b; Li HY et al., 2014; Ye Z et al., 2015; Zhang ZJ et al., 2013; Zheng C et al., 2016) have revealed low-velocity anomalies in the crust and uppermost mantle beneath the Qilian Orogen (Figure 5a and 5b). Yang YJ et al. (2012) established that an S-wave velocity below 3.4 km/s at a 30 km depth serves as the criterion for partial melting. These low-velocity anomalies have been interpreted as indicative of partial melting or fluid formation in the Qilian crust. During the uplift process, the eastern and western segments undergo varying forms of deformation (e.g., Li HL et al., 2022). The low-velocity crustal materials in the western Qilian Orogen gradually thin from west to east, accompanied by a slight increase in the shear wave velocity. In contrast, no obvious low-velocity features are discernible in the crust of the eastern Qilian Orogen (e.g., Zheng C et al., 2016; Zhao PP et al., 2021). The low-velocity anomalies in the middle and lower crust below the Qilian Orogen may stem from delamination or thermal erosion of the lithosphere triggered by hot asthenospheric flow (e.g., Deng YF et al., 2018; Li HL et al., 2022).
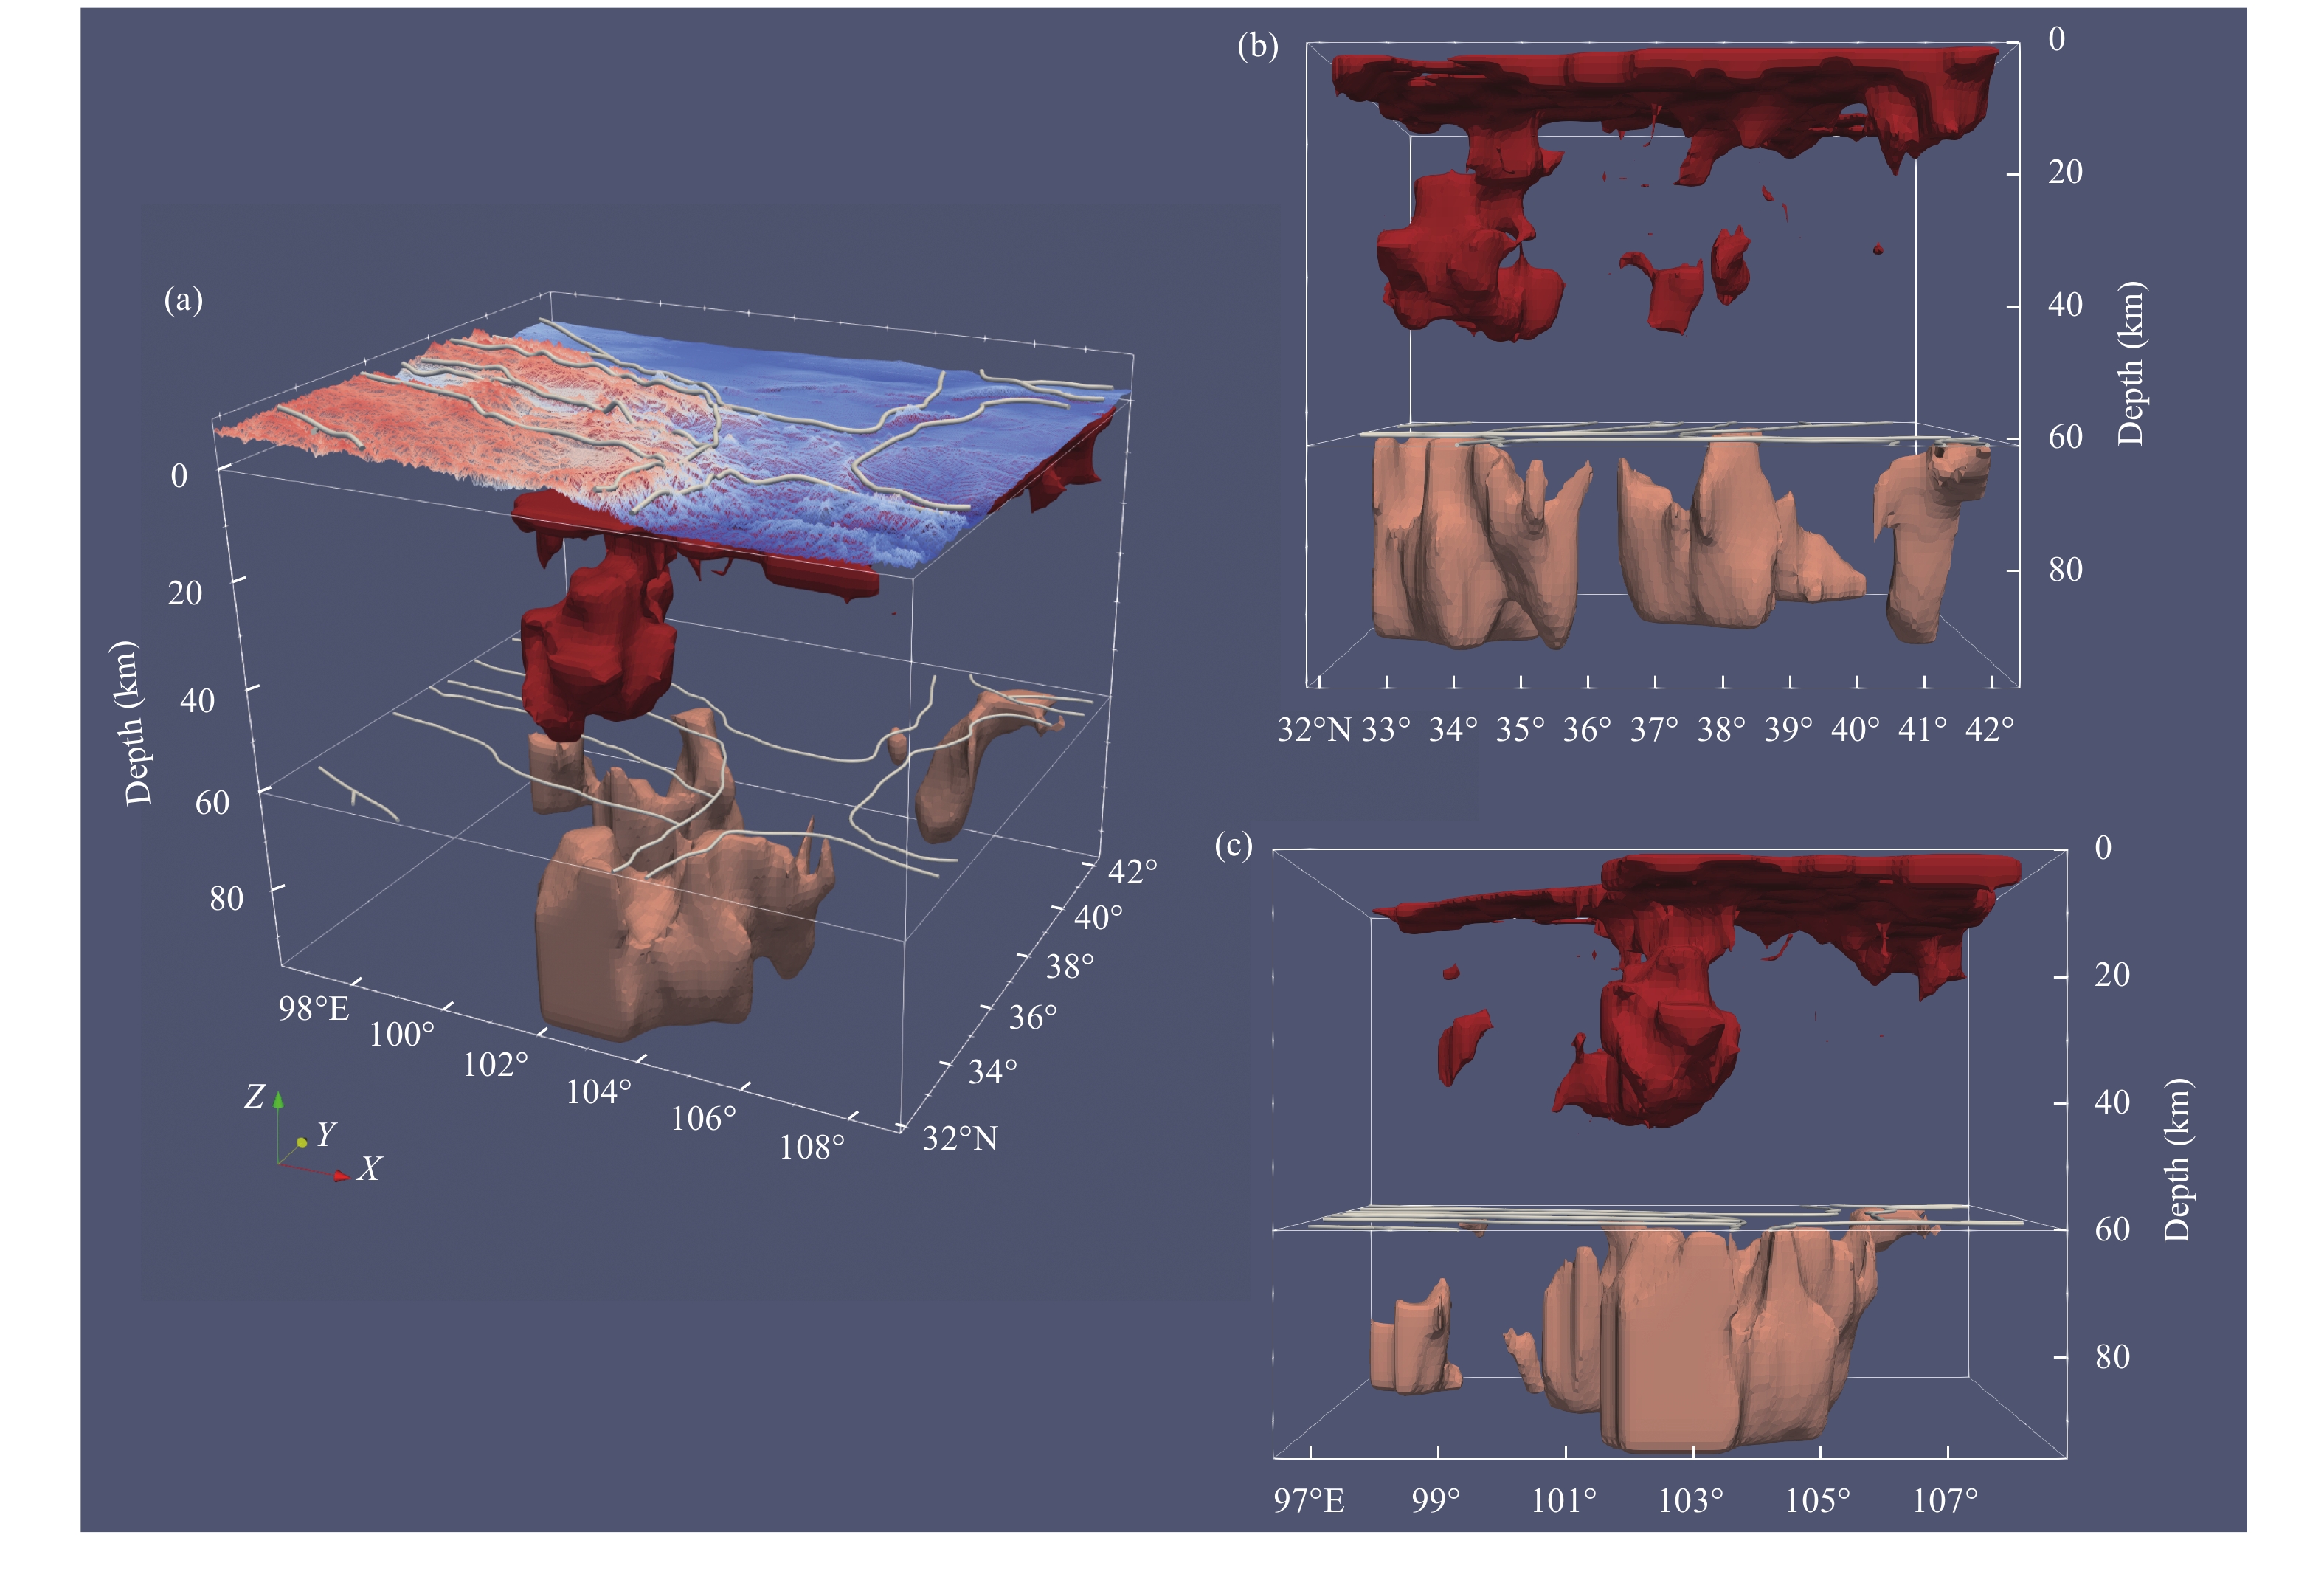
Our joint inversion model reveals a notable LVZ within the middle to lower crust of the SPGZ (Figure 5d). This substantial intracrustal LVZ gradually thins eastward, concluding at the SPGZ-Qinling boundary. High vP/vS ratios (>1.9) indicate the presence of weak materials (partial melts) in the lower crust beneath the SPGZ. The vS and vP/vS structures in the SPGZ may support the existence of partial melting and even the mid-lower crustal flow model (e.g., Royden et al., 2008). Seismic tomography (e.g., Li C and van der Hilst, 2010; Liang XF et al., 2012; Liu M et al., 2004) has revealed a pervasive and continuous upper mantle LVZ at asthenospheric depths from the central and northern Qinghai-Xizang Plateau to the eastern Qinghai-Xizang Plateau, indicating the eastward migration of this asthenospheric flow, a phenomenon corroborated by SKS anisotropy analysis (e.g., León Soto et al., 2012). Combined with previous seismic tomography and RF studies (e.g., Lei JS and Zhao DP, 2016; Zhang ZJ et al., 2010), we infer that delamination or thermal erosion of the lithosphere triggered by hot asthenospheric flow contributed to the observed uppermost mantle LVZ in the SPGZ (Figure 7).
Figure
7.
3D views of the LVZs beneath the northeastern Qinghai-Xizang Plateau and surroundings. (a) Perspective view; (b) side view along latitude; and (c) side view along longitude. Red masses indicate crustal LVZs with vS < 3.4 km/s, and brown masses represent lithospheric mantle LVZs with vS < 4.2 km/s. White lines indicate the major geological boundaries. Surface topography is shown in (a).
To examine the LVZs and their connectivity, Figure 7 presents a 3D sketch of the low-velocity masses in the crust and upper mantle. The crustal LVZs with vS < 3.4 km/s and the lithospheric mantle LVZs with vS < 4.2 km/s are indicated in red and brown, respectively. Low-velocity anomalies are widespread in the crust and the uppermost mantle beneath the northeastern Qinghai-Xizang Plateau. The correlation between crustal and uppermost mantle velocities is evident in the SPGZ and Qilian Orogen (Figure 7a and 7b). The crustal LVZs beneath the SPGZ are massive and have high vP/vS ratios, which may imply a weak and ductile mid-lower crust. However, the absence of low-velocity anomalies and intermediate-to-low vP/vS values (≤1.8) within the crust of the Qinling Orogen may signify its relative strength. Consequently, these findings contest the notion of the Qinling Orogen serving as a conduit for lower crustal flow escaping from the interior of the Qinghai-Xizang Plateau to the east (e.g., Ye Z et al., 2017). A LVZ gap between 36°N and 37°N (Figure 7b) implies that the strong lithosphere of Kunlun-West Qinling hinders the northward movement of Qinghai-Xizang’s material. Located in the middle of the Qilian Orogen (Figure 7c), this LVZ gap suggests a discrepancy in the lithospheric structure and deformation mechanism between the eastern and western Qilian Orogen (e.g., Li HL et al., 2022).
4.2
Crustal deformation in the northeastern Qinghai-Xizang Plateau
While certain previous tomography studies (e.g., Cheng B et al., 2016; Jiang CX et al., 2014; Li HY et al., 2014) supported the crustal flow model (Royden et al., 1997; Clark and Royden, 2000) in the northeastern Qinghai-Xizang Plateau, wherein crustal thickening arises from the extrusion of ductile mid-to-lower crustal materials from the center to the margin, our joint inversion results are incompatible with the crustal flow model across significant areas of the northeastern Qinghai-Xizang Plateau. Prominent LVZs are mainly present in the mid-lower crust beneath the SPGZ and the Qilian Orogen. Despite exhibiting high vP/vS ratios, these LVZs are not interconnected (Figure 7b and 7c). The absence of connected LVZs in the mid-lower crust within much of the northeastern Qinghai-Xizang Plateau indicates that possible partial melts in this region are all localized and isolated. Additional geophysical factors, including high electrical resistivity (e.g., Xiao QB et al., 2016), moderate heat flow (e.g., Hu SB et al., 2000), and low-to-intermediate Poisson’s ratios (e.g., Li YH et al., 2006; Pan SZ and Niu FL, 2011; Wang XC et al., 2017), observed across extensive parts of the northeastern Qinghai-Xizang Plateau, further deviate from the crustal flow model applicable to this region.
The Moho depth serves as a key parameter for characterizing crustal structure and deformation (e.g., Zandt and Ammon, 1995). The substantial lateral variations in the Moho depth (Figure 3a and 3b) indicate the complexity of the crustal structure beneath the northeastern Qinghai-Xizang Plateau and its adjacent regions. The strength contrast across the plateau boundary plays an important role in crustal/lithospheric deformation and topographic evolution (e.g., Chen L et al., 2017; Clark et al., 2005; Sun YJ and Liu M, 2018). The crust and uppermost mantle beneath the Alxa Block exhibit significantly high vS values (Figure 5a and 5b). Distinct high-velocity mantle lithosphere extending to a depth of ~250 km has recently been revealed by P-wave travel-time tomography (e.g., Guo HL et al., 2017). Based on S-wave RF data, Zhang HS et al. (2012) delineated a notably thick lithosphere in this region. Collectively, these findings indicate that the Alxa Block possesses a robust lithosphere that resists deformation despite substantial compression from the Qilian Orogen. Consequently, a convex front in crustal thickness materializes. In contrast, the Qilian Orogen is marked by low velocities in the lower crust and uppermost mantle (e.g., Guo HL et al., 2017; Li YH et al., 2017; Wang XC et al., 2017) and elevated heat flow (e.g., Hu SB et al., 2000; Tao W and Shen ZK, 2008), yielding a thin and fragile lithosphere that serves as the mechanical foundation for overall lithospheric shortening.
We argue that whole-lithosphere shortening is a more reasonable explanation for crustal thickening in the NE margin of the Qinghai-Xizang Plateau, based on the crustal thickness and strength of the lithosphere, as revealed by the vS and vP/vS ratios. Lithospheric strength plays a pivotal role in the shortening process, with weaker blocks being more susceptible to deform. In response to crustal thickening and deformation, horizontal shear zones may form within the mid-lower crustal LVZs (e.g., Nabelek et al., 2010; Chen L et al., 2019; Bao XW et al., 2020). The scale of the shear zone indicates the stage of the lithospheric deformation and its strength. The large-scale LVZs in the SPGZ and Qilian Orogen reflect the deformation history of these terranes, which have resulted in a weak lithosphere (e.g., Deng YF et al., 2018; Bao XW et al., 2020). Interestingly, the crust’s low velocity closely corresponds with that of the uppermost mantle (Figure 7). Similarly, correlations between crustal and uppermost mantle velocities were also discovered in the eastern Qinghai-Xizang Plateau (e.g., Ye Z et al., 2017), northeastern Qinghai-Xizang Plateau (e.g., Deng YF et al., 2019; Li HL et al., 2022) and southeastern Qinghai-Xizang Plateau (e.g., Liu QY et al., 2014). These correlations also suggest that the crust and mantle are coupled as a lithospheric block, supporting the interpretation of coupled lithospheric-scale deformation in this region (e.g., Deng YF et al., 2018; Xu XM et al., 2018). This is also supported by seismic anisotropy through XKS splitting analysis, which suggests that the lithosphere beneath the NE margin of the Qinghai-Xizang Plateau deforms coherently and approximately parallel to the direction of surface GPS motion (e.g., Chang LJ et al., 2017; Hao M et al., 2019; Xu XM et al., 2018).
5.
Conclusions
In summary, our investigation encompassed a joint inversion of RFs and surface wave dispersions within the northeastern Qinghai-Xizang Plateau and its surrounding areas, alongside an independent vP model. This approach yielded high-resolution images of vS, vP/vS ratios, and crustal thickness, which unearthed shallow low vS anomalies that correlate substantially with sedimentary basins, and demonstrated a decrease in crustal thickness outward from the northeastern Qinghai-Xizang Plateau. The Qilian Orogen, SPGZ, and southwestern Ordos Block exhibited elevated average vP/vS ratios, while the Alxa Block and interior of the Ordos Block were pervaded by low vP/vS ratios. Despite featuring low vS and high vP/vS ratios, potential partial melts within the SPGZ’s middle to lower crust remain confined and do not extend across the Xizang-Qinling boundary. Notably, velocity coherence between the crust and uppermost mantle within the northeastern Qinghai-Xizang Plateau was remarkable, indicative of unified lithospheric-scale deformation in this region.
Acknowledgements
Waveform data were obtained from the Data Management Center of the China Seismic Array at the Institute of Geophysics, China Earthquake Administration (ChinArray DMC, https://doi.org/10.12001/ChinArray.Data). Most figures were produced using GMT (Wessel et al., 2019). This work was supported by the Natural Science Basic Research Program of Shaanxi (No. 2023-JC-QN-0306), the Special Fund of the Institute of Geophysics, China Earthquake Administration (No. DQJB21B32) and the National Natural Science Foundation of China (No. 42174069).
Conflict of interest
Prof. Xiaodong Song and Prof. Jiangtao Li serve as editorial board members for Earthquake Science and were not involved in the editorial review or the decision-making process for this article. All authors declare that they have no competing interests.
Bao XW, Song XD, Xu MJ, Wang LS, Sun XX, Mi N, Yu DY and Li H (2013). Crust and upper mantle structure of the North China Craton and the NE Tibetan Plateau and its tectonic implications. Earth Planet Sci Lett 369: 129–137 https://doi.org/10.1016/j.jpgl.2013.03.015.
Bao XW, Sun XX, Xu MJ, Eaton DW, Song XD, Wang LS, Ding ZF, Mi N, Li H, Yu DY, Huang ZC and Wang P (2015a). Two crustal low-velocity channels beneath SE Tibet revealed by joint inversion of Rayleigh wave dispersion and receiver functions. Earth Planet Sci Lett 415: 16–24 https://doi.org/10.1016/j.jpgl.2015.01.020.
Bao XW, Song XD and Li JT (2015b). High-resolution lithospheric structure beneath Mainland China from ambient noise and earthquake surface-wave tomography. Earth Planet Sci Lett 417: 132–141 https://doi.org/10.1016/j.jpgl.2015.02.024.
Bao XW, Song XD, Eaton DW, Xu YX and Chen HL (2020). Episodic lithospheric deformation in eastern Tibet inferred from seismic anisotropy. Geophys Res Lett 47(3): e2019GL085721 https://doi.org/10.1029/2019gl085721.
Chang LJ, Ding ZF, Wang CY and Flesch LM (2017). Vertical coherence of deformation in lithosphere in the NE margin of the Tibetan plateau using GPS and shear-wave splitting data. Tectonophysics 699: 93–101 https://doi.org/10.1016/j.tecto.2017.01.025.
Chen L, Capitanio FA, Liu LJ and Gerya TV (2017). Crustal rheology controls on the Tibetan plateau formation during India-Asia convergence. Nat Commun 8: 15992 https://doi.org/10.1038/ncomms15992.
Chen L, Song XD, Gerya TV, Xu T and Chen Y (2019). Crustal melting beneath orogenic plateaus: Insights from 3-D Thermo-mechanical modeling. Tectonophysics 761: 1–15 https://doi.org/10.1016/j.tecto.2019.03.014.
Cheng B, Zhao DP, Cheng SY, Ding ZT and Zhang GW (2016). Seismic tomography and anisotropy of the Helan-Liupan tectonic belt: Insight into lower crustal flow and seismotectonics. J Geophys Res: Solid Earth 121(4): 2608 –2635 https://doi.org/10.1002/2015jb012692.
Christensen NI (1996). Poisson’s ratio and crustal seismology. J Geophys Res:Solid Earth 101(B2): 3139 – 3156 https://doi.org/10.1029/95jb03446.
Clark MK and Royden LH (2000). Topographic ooze: Building the eastern margin of Tibet by lower crustal flow. Geology 28(8): 703 – 706 https://doi.org/10.1130/0091-7613(2000)28<703:TOBTEM>2.0.CO;2. doi: 10.1130/0091-7613(2000)28<703:TOBTEM>2.0.CO;2
Clark MK, Bush JWM and Royden LH (2005). Dynamic topography produced by lower crustal flow against rheological strength heterogeneities bordering the Tibetan Plateau. Geophys J Int 162(2): 575 – 590 https://doi.org/10.1111/j.1365-246x.2005.02580.x.
Deng YF, Li JT, Song XD and Zhu LP (2018). Joint inversion for lithospheric structures: Implications for the growth and deformation in Northeastern Tibetan Plateau. Geophys Res Lett 45(9): 3951 – 3958 https://doi.org/10.1029/2018gl077486.
Deng YF, Li JT, Song XD, Li HY and Xu T (2019). The lithospheric-scale deformation in NE Tibet from joint inversion of receiver function and surface wave dispersion. Terr Atmos Ocean Sci 30(1): 127 – 137 https://doi.org/10.3319/tao.2019.01.18.03.
England P and Houseman G (1986). Finite strain calculations of continental deformation: 2. Comparison with the India-Asia collision zone. J Geophys Res:Solid Earth 91(B3): 3664 – 3676 https://doi.org/10.1029/jb091ib03p03664.
Guo HL, Ding ZF and Xu XM (2017). Upper mantle structure beneath the northern South-Nouth Seismic Zone from teleseismic traveltime data. Chin J Geophys 60(1): 86 – 97 https://doi.org/10.6038/cjg20170108 (in Chinese with English abstract).
Han SC, Zhang HJ, Xin HL, Shen WS and Yao HJ (2022). USTClitho2.0: Updated unified seismic tomography models for Continental China lithosphere from joint inversion of body-wave arrival times and surface-wave dispersion data. Seismol Res Lett 93(1): 201 – 215 https://doi.org/10.1785/0220210122.
Hao M, Li YH and Zhuang WQ (2019). Crustal movement and strain distribution in East Asia revealed by GPS observations. Sci Rep 9: 16797 https://doi.org/10.1038/s41598-019-53306-y.
Huang ZC, Tilmann F, Xu MJ, Wang LS, Ding ZF, Mi N, Yu DY and Li H (2017). Insight into NE Tibetan Plateau expansion from crustal and upper mantle anisotropy revealed by shear-wave splitting. Earth Planet Sci Lett 478: 66– 75 https://doi.org/10.1016/j.jpgl.2017.08.030.
Jiang CX, Yang YJ and Zheng Y (2014). Penetration of mid-crustal low velocity zone across the Kunlun Fault in the NE Tibetan Plateau revealed by ambient noise tomography. Earth Planet Sci Lett 406: 81– 92 https://doi.org/10.1016/j.jpgl.2014.08.040.
Julià J, Ammon CJ, Herrmann RB and Correig AM (2000). Joint inversion of receiver function and surface wave dispersion observations. Geophys J Int 143(1): 99– 112 https://doi.org/10.1046/j.1365-246x.2000.00217.x.
Lei JS and Zhao DP (2016). Teleseismic P-wave tomography and mantle dynamics beneath Eastern Tibet. Geochem Geophys Geosyst 17(5): 1861 – 1884 https://doi.org/10.1002/2016gc006262.
León Soto G, Sandvol E, Ni JF, Flesch L, Hearn TM, Tilmann F, Chen J and Brown LD (2012). Significant and vertically coherent seismic anisotropy beneath eastern Tibet. J Geophys Res:Solid Earth 117(B5): B05308 https://doi.org/10.1029/2011jb008919.
Li C and Van der hilst RD (2010). Structure of the upper mantle and transition zone beneath Southeast Asia from traveltime tomography. J Geophys Res:Solid Earth 115(B7): B07308 https://doi.org/10.1029/2009jb006882.
Li HL, Huang XF, Gao R and Ye Z (2022). The lithospheric structure differences between the western and eastern Qilian in the northeastern Tibetan Plateau. Chin J Geophys 65(5): 1581 – 1594 https://doi.org/10.6038/cjg2022p0735 (in Chinese with English abstract).
Li HY, Shen Y, Huang ZX, Li XF, Gong M, Shi DN, Sandvol E and Li AB (2014). The distribution of the mid-to-lower crustal low-velocity zone beneath the northeastern Tibetan Plateau revealed from ambient noise tomography. J Geophys Res:Solid Earth 119(3): 1954 – 1970 https://doi.org/10.1002/2013jb010374.
Li J, Wang XJ and Niu FL (2011). Seismic anisotropy and implications for mantle deformation beneath the NE margin of the Tibet plateau and Ordos plateau. Phys Earth Planet Inter 189(3-4): 157 – 170 https://doi.org/10.1016/j.pepi.2011.08.009.
Li JT, Song XD, Zhu LP and Deng YF (2017). Joint inversion of surface wave dispersions and receiver functions with P velocity constraints: Application to Southeastern Tibet. J Geophys Res:Solid Earth 122(9): 7291 – 7310 https://doi.org/10.1002/2017jb014135.
Li JT, Song XD, Wang P and Zhu LP (2019). A generalized H-κ method with harmonic corrections on Ps and its crustal multiples in receiver functions. J Geophys Res:Solid Earth 124(4): 3782 – 3801 https://doi.org/10.1029/2018jb016356.
Li JT and Song XD (2021). Crustal structure beneath the Hi-CLIMB seismic array in the central-western Tibetan Plateau from the improved H-κ-c method. Earthq Sci 34(3): 199 – 210 https://doi.org/10.29382/eqs-2021-0002.
Li MK, Song XD, Li JT and Bao XW (2022). Crust and upper mantle structure of East Asia from ambient noise and earthquake surface wave tomography. Earthq Sci 35(2): 71 – 92 https://doi.org/10.1016/j.eqs.2022.05.004.
Li XF, Santosh M, Cheng SH, Xu XM and Zhong WX (2015). Crustal structure and composition beneath the northeastern Tibetan plateau from receiver function analysis. Phys Earth Planet Inter 249: 51 – 58 https://doi.org/10.1016/j.pepi.2015.10.001.
Li YH, Wu QJ, An ZH, Tian XB, Zeng RS, Zhang RQ and Li HG (2006). The Poisson ratio and crustal structure across the NE Tibetan Plateau determined from receiver functions. Chin J Geophys 49(5): 1359 – 1368 https://doi.org/10.3321/j.issn:0001-5733.2006.05.015 (in Chinese with English abstract).
Li YH, Pan JT, Wu QJ and Ding ZF (2017). Lithospheric structure beneath the northeastern Tibetan Plateau and the western Sino-Korea Craton revealed by Rayleigh wave tomography. Geophys J Int 210(2): 570 – 584 https://doi.org/10.1093/gji/ggx181.
Li YH, Tang HH and Shi L (2023). Constraining the crustal structure under the central and western Tian Shan based on teleseismic receiver functions and gravity anomalies. Earthq Sci 36(1): 1 – 14 https://doi.org/10.1016/j.eqs.2023.02.005.
Liang XF, Sandvol E, Chen YJ, Hearn T, Ni J, Klemperer S, Shen Y and Tilmann F (2012). A complex Tibetan upper mantle: A fragmented Indian slab and no south-verging subduction of Eurasian lithosphere. Earth Planet Sci Lett 333: 101 – 111 https://doi.org/10.1016/j.jpgl.2012.03.036.
Ligorría JP and Ammon CJ (1999). Iterative deconvolution and receiver-function estimation. Bull Seismol Soc Amer 89(5): 1395 – 1400 https://doi.org/10.1785/bssa0890051395.
Liu M, Cui XJ and Liu FT (2004). Cenozoic rifting and volcanism in eastern China: a mantle dynamic link to the Indo–Asian collision? Tectonophysics 393(1-4): 29 – 42 https://doi.org/10.1016/j.tecto.2004.07.029.
Liu MJ, Mooney WD, Li SL, Okaya N and Detweiler S (2006). Crustal structure of the northeastern margin of the Tibetan plateau from the Songpan-Ganzi terrane to the Ordos basin. Tectonophysics 420(1-2): 253 – 266 https://doi.org/10.1016/j.tecto.2006.01.025.
Liu QY, Van Der Hilst RD, Li Y, Yao HJ, Chen JH, Guo B, Qi SH, Wang J, Huang H and Li SC (2014). Eastward expansion of the Tibetan Plateau by crustal flow and strain partitioning across faults. Nat Geosci 7(5): 361 – 365 https://doi.org/10.1038/ngeo2130.
Molnar P and Tapponnier P (1975). Cenozoic tectonics of Asia: Effects of a continental collision: Features of recent continental tectonics in Asia can be interpreted as results of the India-Eurasia collision. Science 189(4201): 419 – 426 https://doi.org/10.1126/science.189.4201.419.
Nabelek PI, Whittington AG and Hofmeister AM (2010). Strain heating as a mechanism for partial melting and ultrahigh temperature metamorphism in convergent orogens: Implications of temperature-dependent thermal diffusivity and rheology. J Geophys Res:Solid Earth 115(B12): B12417 https://doi.org/10.1029/2010jb007727.
Pan SZ and Niu FL (2011). Large contrasts in crustal structure and composition between the Ordos plateau and the NE Tibetan plateau from receiver function analysis. Earth Planet Sci Lett 303(3-4): 291 – 298 https://doi.org/10.1016/j.jpgl.2011.01.007.
Royden LH, Burchfiel BC, King RW, Wang E, Chen ZL, Shen F and Liu YP (1997). Surface deformation and lower crustal flow in eastern Tibet. Science 276(5313): 788 – 790 https://doi.org/10.1126/science.276.5313.788.
Royden LH, Burchfiel BC and van der Hilst RD (2008). The geological evolution of the Tibetan Plateau. Science 321(5892): 1054 – 1058 https://doi.org/10.1126/science.1155371.
Shen WS, Ritzwoller MH, Schulte-Pelkum V and Lin FC (2013). Joint inversion of surface wave dispersion and receiver functions: a Bayesian Monte-Carlo approach. Geophys J Int 192(2): 807 – 836 https://doi.org/10.1093/gji/ggs050.
Shi YT, Gao Y and Lu LY (2021). Receiver function structures beneath the Haiyuan fault on the northeastern margin of the Tibetan plateau. Earthq Sci 34(4): 367 – 377 https://doi.org/10.29382/eqs-2020-0055.
Sun YJ and Liu M (2018). Rheological control of lateral growth of the Tibetan Plateau: Numerical results. J Geophys Res:Solid Earth 123(11): 10124–10141 https://doi.org/10.1029/2018jb016601.
Tapponnier P, Xu ZQ, Roger F, Meyer B, Arnaud N, Wittlinger G and Yang JS (2001). Oblique stepwise rise and growth of the Tibet Plateau. Science 294(5547): 1671 – 1677 https://doi.org/10.1126/science.105978.
Teng JW, Zhang ZJ, Zhang XK, Wang CY, Gao R, Yang BJ, Qiao YH and Deng YF (2013). Investigation of the Moho discontinuity beneath the Chinese mainland using deep seismic sounding profiles. Tectonophysics 609: 202 – 216 https://doi.org/10.1016/j.tecto.2012.11.024.
Wang CY, Sandvol E, Zhu L, Lou H, Yao ZX and Luo XH (2014). Lateral variation of crustal structure in the Ordos block and surrounding regions, North China, and its tectonic implications. Earth Planet Sci Lett 387: 198 – 211 https://doi.org/10.1016/j.jpgl.2013.11.033.
Wang Q, Niu FL, Gao Y and Chen YT (2016). Crustal structure and deformation beneath the NE margin of the Tibetan plateau constrained by teleseismic receiver function data. Geophys J Int 204(1): 167 – 179 https://doi.org/10.1093/gji/ggv420.
Wang WL, Wu JP, Fang LH, Lai GJ and Cai Y (2017). Sedimentary and crustal thicknesses and Poisson’s ratios for the NE Tibetan Plateau and its adjacent regions based on dense seismic arrays. Earth Planet Sci Lett 462: 76 – 85 https://doi.org/10.1016/j.jpgl.2016.12.040.
Wang XC, Li YH, Ding ZF, Zhu LP, Wang CY, Bao XW and Wu Y (2017). Three-dimensional lithospheric S wave velocity model of the NE Tibetan Plateau and western North China Craton. J Geophys Res:Solid Earth 122(8): 6703 – 6720 https://doi.org/10.1002/2017jb014203.
Wessel P, Luis JF, Uieda L, Scharroo R, Wobbe F, Smith WHF and Tian D (2019). The generic mapping tools version 6. Geochem Geophys Geosyst 20(11): 5556 – 5564 https://doi.org/10.1029/2019gc008515.
Xiao QB, Shao GH, Yu G, Cai JT and Wang JJ (2016). Electrical resistivity structures of the Kunlun-Qaidam-Qilian system at the northern Tibet and their tectonic implications. Phys Earth Planet Inter 255: 1 – 17 https://doi.org/10.1016/j.pepi.2016.03.011.
Xu XM, Niu FL, Ding ZF and Chen QF (2018). Complicated crustal deformation beneath the NE margin of the Tibetan plateau and its adjacent areas revealed by multi-station receiver-function gathering. Earth Planet Sci Lett 497: 204 – 216 https://doi.org/10.1016/j.jpgl.2018.06.010.
Xu ZJ, Song XD and Zhu LP (2013). Crustal and uppermost mantle S velocity structure under Hi-CLIMB seismic array in central Tibetan Plateau from joint inversion of surface wave dispersion and receiver function data. Tectonophysics 584: 209 – 220 https://doi.org/10.1016/j.tecto.2012.08.024.
Yang YJ, Ritzwoller MH, Zheng Y, Shen WS, LevShin AL and Xie ZJ (2012). A synoptic view of the distribution and connectivity of the mid-crustal low velocity zone beneath Tibet. J Geophys Res:Solid Earth 117(B4): B04303 https://doi.org/10.1029/2011jb008810.
Ye Z, Gao R, Li QS, Zhang HS, Shen XZ, Liu XZ and Gong C (2015). Seismic evidence for the North China plate underthrusting beneath northeastern Tibet and its implications for plateau growth. Earth Planet Sci Lett 426: 109 – 117 https://doi.org/10.1016/j.jpgl.2015.06.024.
Ye Z, Li JT, Gao R, Song XD, Li QS, Li YK, Xu X, Huang XF, Xiong XS and Li WH (2017). Crustal and uppermost mantle structure across the Tibet-Qinling transition zone in NE Tibet: Implications for material extrusion beneath the Tibetan plateau. Geophys Res Lett 44(20): 10316–10323 https://doi.org/10.1002/2017gl075141.
Yin A, Dang YQ, Zhang M, Chen XH and McRivette MW (2008). Cenozoic tectonic evolution of the Qaidam basin and its surrounding regions (Part 3): Structural geology, sedimentation, and regional tectonic reconstruction. GSA Bull 120(7-8): 847–876 https://doi.org/10.1130/b26232.1.
Yuan XH, Ni J, Kind R, Mechie J and Sandvol E (1997). Lithospheric and upper mantle structure of southern Tibet from a seismological passive source experiment. J Geophys Res: Solid Earth 102(B12): 27491–27500 https://doi.org/10.1029/97JB02379.
Zandt G and Ammon CJ (1995). Continental crust composition constrained by measurements of crustal Poisson’s ratio. Nature 374(6518): 152–154 https://doi.org/10.1038/374152a0.
Zhang HS, Teng JW, Tian XB, Zhang ZJ, Gao R and Liu JQ (2012). Lithospheric thickness and upper-mantle deformation beneath the NE Tibetan Plateau inferred from S receiver functions and SKS splitting measurements. Geophys J Int 191(3): 1285 – 1294 https://doi.org/10.1111/j.1365-246x.2012.05667.x.
Zhang PZ, Shen ZK, Wang M, Gan WJ, Bürgmann R, Molnar P, Wang Q, Niu ZJ, Sun JZ, Wu JC, Sun HR and You XZ (2004). Continuous deformation of the Tibetan Plateau from global positioning system data. Geology 32(9): 809 – 812 https://doi.org/10.1130/g20554.1.
Zhang ZJ, Yuan XH, Chen Y, Tian XB, Kind R, Li XQ and Teng JW (2010). Seismic signature of the collision between the east Tibetan escape flow and the Sichuan Basin. Earth Planet Sci Lett 292(3-4): 254 – 264 https://doi.org/10.1016/j.jpgl.2010.01.046.
Zhang ZJ, Klemperer S, Bai ZM, Chen Y and Teng JW (2011). Crustal structure of the Paleozoic Kunlun orogeny from an active-source seismic profile between Moba and Guide in East Tibet, China. Gondwana Res 19(4): 994 – 1007 https://doi.org/10.1016/j.gr.2010.09.008.
Zhang ZJ, Bai ZM, Klemperer SL, Tian XB, Xu T, Chen Y and Teng JW (2013). Crustal structure across northeastern Tibet from wide-angle seismic profiling: Constraints on the Caledonian Qilian orogeny and its reactivation. Tectonophysics 606: 140 – 159 https://doi.org/10.1016/j.tecto.2013.02.040.
Zhao PP, Chen JH, Liu QY, Chen YF and Li Y (2021). Growth of northern Tibet: Insights from the crustal shear wave velocity structure of the Qilian Shan orogenic belt. Geochem Geophys Geosyst 22(9): e2021GC009968 https://doi.org/10.1029/2021gc009968.
Zheng C, Ding ZF and Song XD (2016). Joint inversion of surface wave dispersion and receiver functions for crustal and uppermost mantle structure in Southeast Tibetan Plateau. Chin J Geophys 59(9): 3223 – 3236 https://doi.org/10.6038/cjg20160908 (in Chinese with English abstract).

 DownLoad: