Duan LF, Zhao CP, Du XZ and Zhou LQ (2023). Machine learning-based automatic construction of earthquake catalog for reservoir areas in multiple river basins of Guizhou province, China. Earthq Sci 36(2): 132–146,. DOI: 10.1016/j.eqs.2023.03.002
Citation:
Duan LF, Zhao CP, Du XZ and Zhou LQ (2023). Machine learning-based automatic construction of earthquake catalog for reservoir areas in multiple river basins of Guizhou province, China. Earthq Sci 36(2): 132–146,. DOI: 10.1016/j.eqs.2023.03.002
Duan LF, Zhao CP, Du XZ and Zhou LQ (2023). Machine learning-based automatic construction of earthquake catalog for reservoir areas in multiple river basins of Guizhou province, China. Earthq Sci 36(2): 132–146,. DOI: 10.1016/j.eqs.2023.03.002
Citation:
Duan LF, Zhao CP, Du XZ and Zhou LQ (2023). Machine learning-based automatic construction of earthquake catalog for reservoir areas in multiple river basins of Guizhou province, China. Earthq Sci 36(2): 132–146,. DOI: 10.1016/j.eqs.2023.03.002
• Based on observation data from four reservoir-monitoring networks deployed along rivers, we obtained a high-resolution earthquake catalog of western Guizhou province using the machine learning-based LOC-FLOW workflow and verified its generalization capacity in reservoir areas.
• The newly obtained earthquake catalog for western Guizhou province has a completeness magnitude of 0.8, with a b-value of 1.25. The seismicity pattern indicates that earthquake characteristics around the large reservoirs in western Guizhou province are related to the dam height, reservoir capacity, impoundment duration, as well as the seismotectonic setting of the reservoir area.
Abstract
Large reservoirs have the risk of reservoir induced seismicity. Accurately detecting and locating microseismic events are crucial when studying reservoir earthquakes. Automatic earthquake monitoring in reservoir areas is one of the effective measures for earthquake disaster prevention and mitigation. In this study, we first applied the automatic location workflow (named LOC-FLOW) to process 14-day continuous waveform data from several reservoir areas in different river basins of Guizhou province. Compared with the manual seismic catalog, the recall rate of seismic event detection using the workflow was 83.9%. Of the detected earthquakes, 88.9% had an onset time difference below 1 s, 81.8% has a deviation in epicenter location within 5 km, and 77.8% had a focal depth difference of less than 5 km, indicating that the workflow has good generalization capacity in reservoir areas. We further applied the workflow to retrospectively process continuous waveform data recorded from 2020 to the first half of 2021 in reservoir areas in multiple river basins of western Guizhou province and identified five times the number of seismic events obtained through manual processing. Compared with manual processing of seismic catalog, the completeness magnitude had decreased from 1.3 to 0.8, and a b-value of 1.25 was calculated for seismicity in western Guizhou province, consistent with the b-values obtained for the reservoir area in previous studies. Our results show that seismicity levels were relatively low around large reservoirs that were impounded over 15 years ago, and there is no significant correlation between the seismicity in these areas and reservoir impoundment. Seismicity patterns were notably different around two large reservoirs that were only impounded about 12 years ago, which may be explained by differences in reservoir storage capacity, the geologic and tectonic settings, hydrogeological characteristics, and active fault the reservoir areas. Prominent seismicity persisted around two large reservoirs that have been impounded for less than 10 years. These events were clustered and had relatively shallow focal depths. The impoundment of the Jiayan Reservoir had not officially begun during this study period, but earthquake location results suggested a high seismicity level in this reservoir area. Therefore, any seismicity in this reservoir area after the official impoundment deserves special attention.
Reservoir construction is significant for irrigation, power generation, and flood control, but it is associated with a risk of reservoir induced seismicity (RIS). To date, more than 100 reservoirs around the globe have been confirmed to induce earthquakes, including at least four
MW > 6.0 earthquakes which have been recognized as RIS ( Yang QY et al., 1996). Spatially, RIS tend to occur in clusters with generally shallow focal depths. Since most reservoirs are built in regions with high mountains and deep valleys, earthquakes in such areas can easily trigger secondary disasters such as landslides and debris flows. Commonly, small earthquakes and serious consequences are the main characteristics of reservoir induced earthquakes. Therefore, a high-resolution earthquake catalog is necessary for subsequent seismicity analysis, earthquake type identification, and risk assessment in a reservoir area. Monitoring earthquakes in reservoir regions is essential for tracking and forecasting RIS. It is also one of the most effective measures for preventing and mitigating earthquake disasters (Yang XY, 1999). However, available methods of reservoir earthquake monitoring and seismic data processing are typically based on human-computer interaction processing mode, and the output of seismic catalog is relatively lagging behind, and always failed to detected some microseismic events that is common in reservoir areas.
The methods of earthquake detection and location currently adopted by seismic networks are based on seismic arrival-time picking, and the earthquake catalog is constructed in three steps: earthquake detection, seismic phase picking, and earthquake location. Traditionally, seismic phase picking is conducted manually by the staff of each seismic network. Tiny earthquakes with low signal-to-noise ratios may be missed during this process. With the continuous deployment of (reservoir) earthquake monitoring networks, the volume of seismic data is increasing dramatically, and such manual data processing methods can no longer meet the requirements of earthquake disaster prevention and mitigation. More advanced methods available for rapidly producing complete earthquake catalogs are based on template matching (Gibbons and Ringdal, 2006; Song FX et al., 2010; Senkaya and Karslı, 2015; Zhang M and Wen LX, 2015). In these methods, several template earthquakes are selected, and the similarity between the template events and the observed continuous waveforms is evaluated using the waveform cross-correlation technique to detect and locate earthquakes. This type of method is sensitive to minor changes in the waveform and is thus suitable for detecting and locating microseismic events. However, the accuracy of this template matching process depends on the number of selected templates, and the computation is time-consuming, making it less suitable for real-time earthquake detection.
In recent years, with the rapid development of artificial intelligence (AI) technologies and the enhanced parallel compute capacity of graphics processing unit (GPU), many effective AI algorithms have been incorporated into geological studies, and machine learning-based seismic phase picking models have attracted widespread attention. Gentili and Michelini (2006) constructed a shallow neural network, which performs significantly better than the traditional short-term average/long-term average (STA/LTA) method at low signal-to-noise ratios. Two major types of neural networks have been developed: convolutional neural networks (CNNs) and recurrent neural networks (RNNs). Some scholars have built several seismic phase-picking models based on CNNs (Zhu WQ and Beroza, 2018; Woollam et al., 2019; Zhao M et al., 2019). Such models perform well in the extraction of waveform features and are even comparable to manual seismic phase picking. This approach has enhanced model accuracy, recall rate, and generalization capacity. The core function of RNNs is to find serial correlation between samples. As a continuous waveform can be treated as a time series, some researchers have developed seismic phase-picking models comprising both CNNs and RNNs (Zhou YJ et al., 2019; Mousavi et al., 2019, 2020; Soto and Schurr, 2021). In general, these approaches use a large number of labeled data to train the model so that the trained model can automatically detect earthquakes and identify seismic phases. These methods are more efficient and have higher recall than the other seismic phase-picking methods, so they present a promising solution to the issue of real-time reservoir earthquake monitoring. PhaseNet (Zhu WQ and Beroza, 2018) is one of the most widely used seismic phase-picking models, comprising a U-shaped CNNs trained with more than 700,000-labeled data from Northern California. It has been applied in combination with traditional earthquake location methods to produce high-resolution earthquake catalogs. Liu M et al. (2020) used PhaseNet to construct a catalog of the 2019 Ridgecrest earthquake sequence in California, and the number of seismic events obtained after relocation was twice that in the manual catalog. Their results revealed the spatial-temporal pattern of earthquake migration and clearly delineated the distribution of several faults involved in this seismic sequence. Zhao M et al. (2021) used the PhaseNet model obtained after transfer learning to build a foreshock catalog of the Changning earthquakes. In this catalog, the number of detected earthquakes with a magnitude below 1.0 was 8 times that in the manual catalog. This catalog revealed the spatial-temporal evolution of the frequent microseismic events leading up to the mainshock. Zhou LQ et al. (2021) built a catalog of the 2020
MS5.0 Qiaojia earthquake and revealed its seismogenic mechanism. Zhang M et al. (2022) constructed an automatic location workflow (named LOC-FLOW) based on the PhaseNet model. Liao SR et al. (2021) developed an intelligent real-time seismic data processing system to achieve the automatic and real-time production of regional earthquake catalogs. The resulting catalogs contain highly accurate earthquake locations and are advantageously complete and consistent, showing that the deep learning-based model of seismic phase picking performs well in real-time seismology studies.
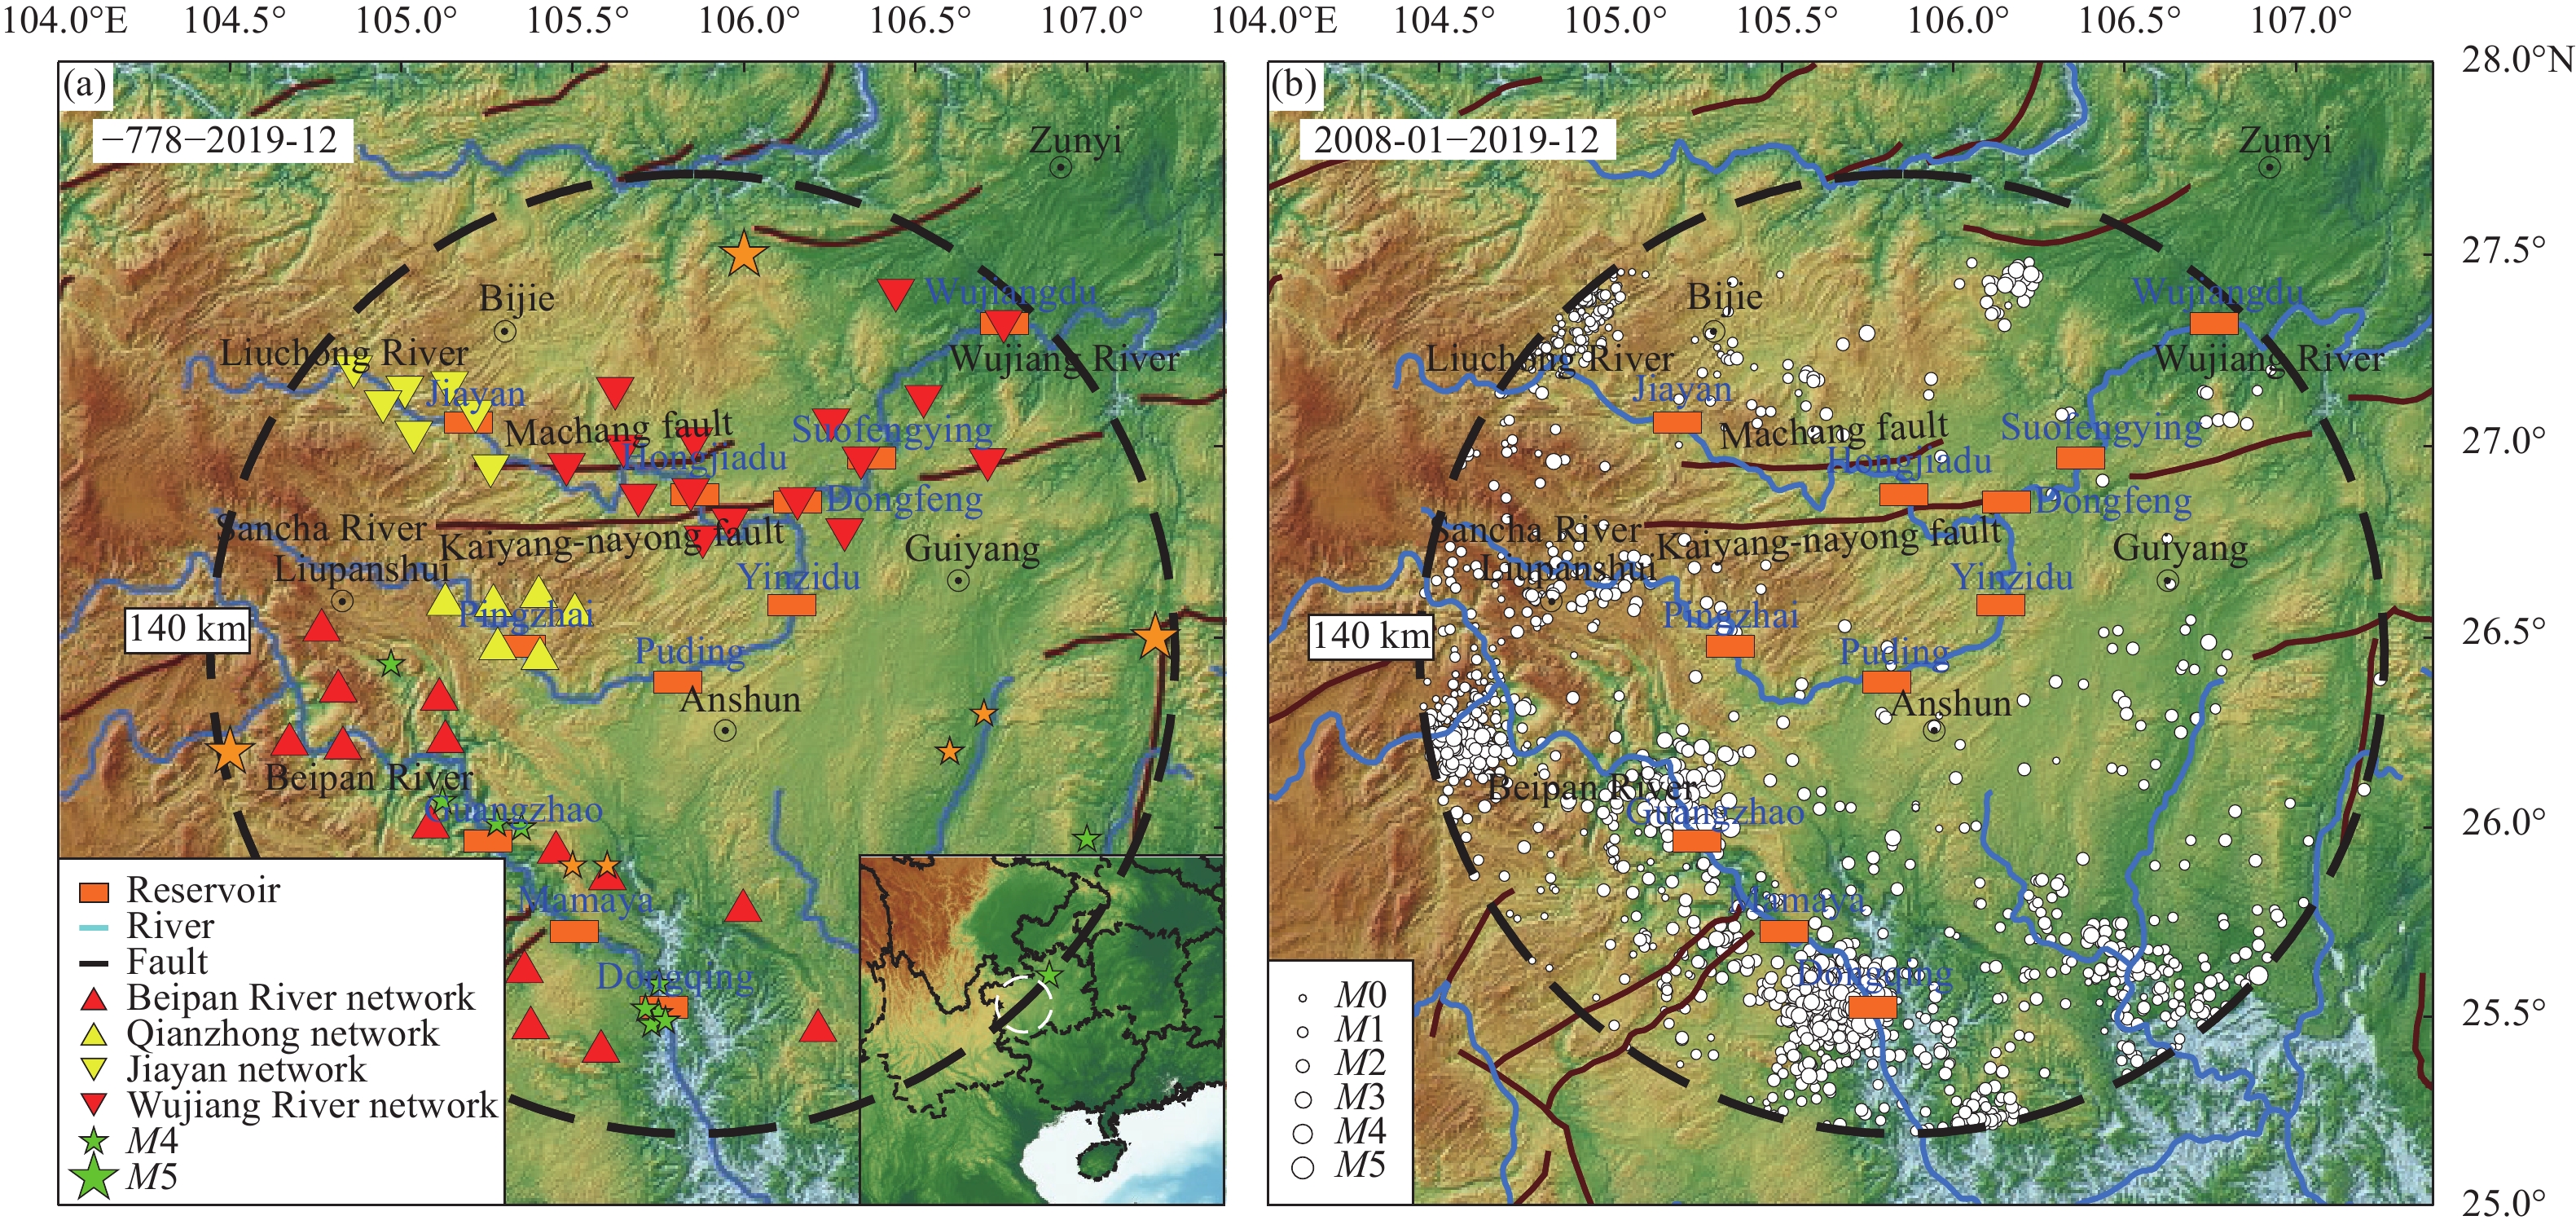
The study area examined in this article is located in western Guizhou province, and regional historical earthquake records were retrieved from the China national unified catalog (Figure 1). Eight earthquakes of magnitude 5 or above and 15 earthquakes of magnitude 4 or above were recorded between 778 BC and December 1969; no earthquakes of magnitude 5 or above and 11 earthquakes of magnitude 4 or above were recorded between January 1970 and December 2019, of which eight events were located near large reservoirs. A total of 2,414 earthquakes were recorded in the study area from January 2008 to December 2019, including 1,733 events with magnitudes less than 1. A large number of earthquakes were clustered near the Dongqing and Guangzhao Reservoirs in the Beipan River Basin. Wang SY (2015) demonstrated that this area has a low level of tectonic seismicity, while the risk of reservoir-induced earthquakes is relatively high. Cascade reservoirs have been constructed in the Beipan River Basin and Wujiang River Basin, where RIS-monitoring networks also have been deployed. The seismic stations in each network are distributed along the river within a 20-km-wide area. Data recorded prior to 2020 by each reservoir-monitoring network were processed independently. To make more effective use of this monitoring data and to obtain a more complete and accurate earthquake catalog for western Guizhou province, we applied LOC-FLOW to process continuous seismic observations collected from multiple RIS-monitoring networks in several river basins of western Guizhou province. Since the continuous waveform data from four networks were jointly processed manually in 2021, our experiment involved first combining 14-day continuous observations, recorded from August 10 to August 23, 2021 by 44 stations in four independent RIS-monitoring networks (Figure 1). The earthquake catalog produced by LOC-FLOW was compared with a manually processed catalog to determine the synthetic monitoring capacity of this workflow when processing seismic data from multiple RIS-monitoring networks in several river basins of Guizhou province, e.g., whether the completeness and accuracy of the catalog had been improved. Finally, the continuous waveform data recorded by the four RIS-monitoring networks from 2020 to the first half of 2021 were retrospectively processed to construct a regional earthquake catalog, and the seismicity patterns in the reservoir areas of western Guizhou province during the study period were analyzed based on the obtained high-resolution earthquake catalog.
Figure
1.
Study area and historical earthquake distribution. (a) Extent of the study area and epicenters of historical earthquakes with magnitude 4 or above (778 BC–Dec 2019); (b) Distribution of historical earthquakes in the study area (Jan 2008–Dec 2019). The dashed black circle with a radius of 140 km delineates the extent of the study area; blue and brown curves represent the rivers and known faults, respectively; orange rectangles mark the dams; triangles denote the seismic stations with color and shape indicating which network they belong to; stars represent the historical earthquakes of magnitude 4 or above in the study area, with green ones representing the events between 778 BC and December 2019 and orange ones representing the events between January 1970 and December 2019, and size indicating earthquake magnitude; white circles denote the historical earthquakes in the study area, with size indicating earthquake magnitude.
As shown in Figure 1, several cascade reservoirs have been constructed in the Beipan River Basin and Wujiang River Basin in western Guizhou province, where several RIS-monitoring networks have also been deployed, including those monitoring the Guangzhao Reservoir and Dongqing Reservoir on the Beipan River, the Jiayan and Qianzhong networks in the upper Wujiang River Basin, and the Wujiang network monitoring the lower Liuchong River and the mainstream of the Wujiang River. In this study, we combined the continuous waveform data recorded by these seismic networks from 2020 to the first half of 2021 to conduct machine learning-based earthquake identification and location. A total of 44 stations equipped with DS-2A short-period seismometers were deployed along the rivers in the study area. Most of these sensors were distributed along the river, forming typical RIS-monitoring networks. The application of the LOC-FLOW to processing seismic data from the reservoir areas in multiple river basins of western Guizhou province was conducted for the following two purposes. First, the stations in each network were linearly distributed along the river, monitoring an area that extends 20 km to the either side of the reservoir, and the data of each network were commonly processed independently to determine earthquake locations. This linear distribution pattern of seismic stations has certain shortcomings when monitoring and locating the earthquakes within a reservoir area, and has not played the role of seismic monitoring in the entire region. Hence, we combined the data of all stations in the four networks and employed a machine learning-based method to reconstruct a more reliable and complete earthquake catalog. The second aim of this approach was to verify the generalization capacity of the workflow in the reservoir area.
3.
Methods and analysis
3.1
Seismic phase picking
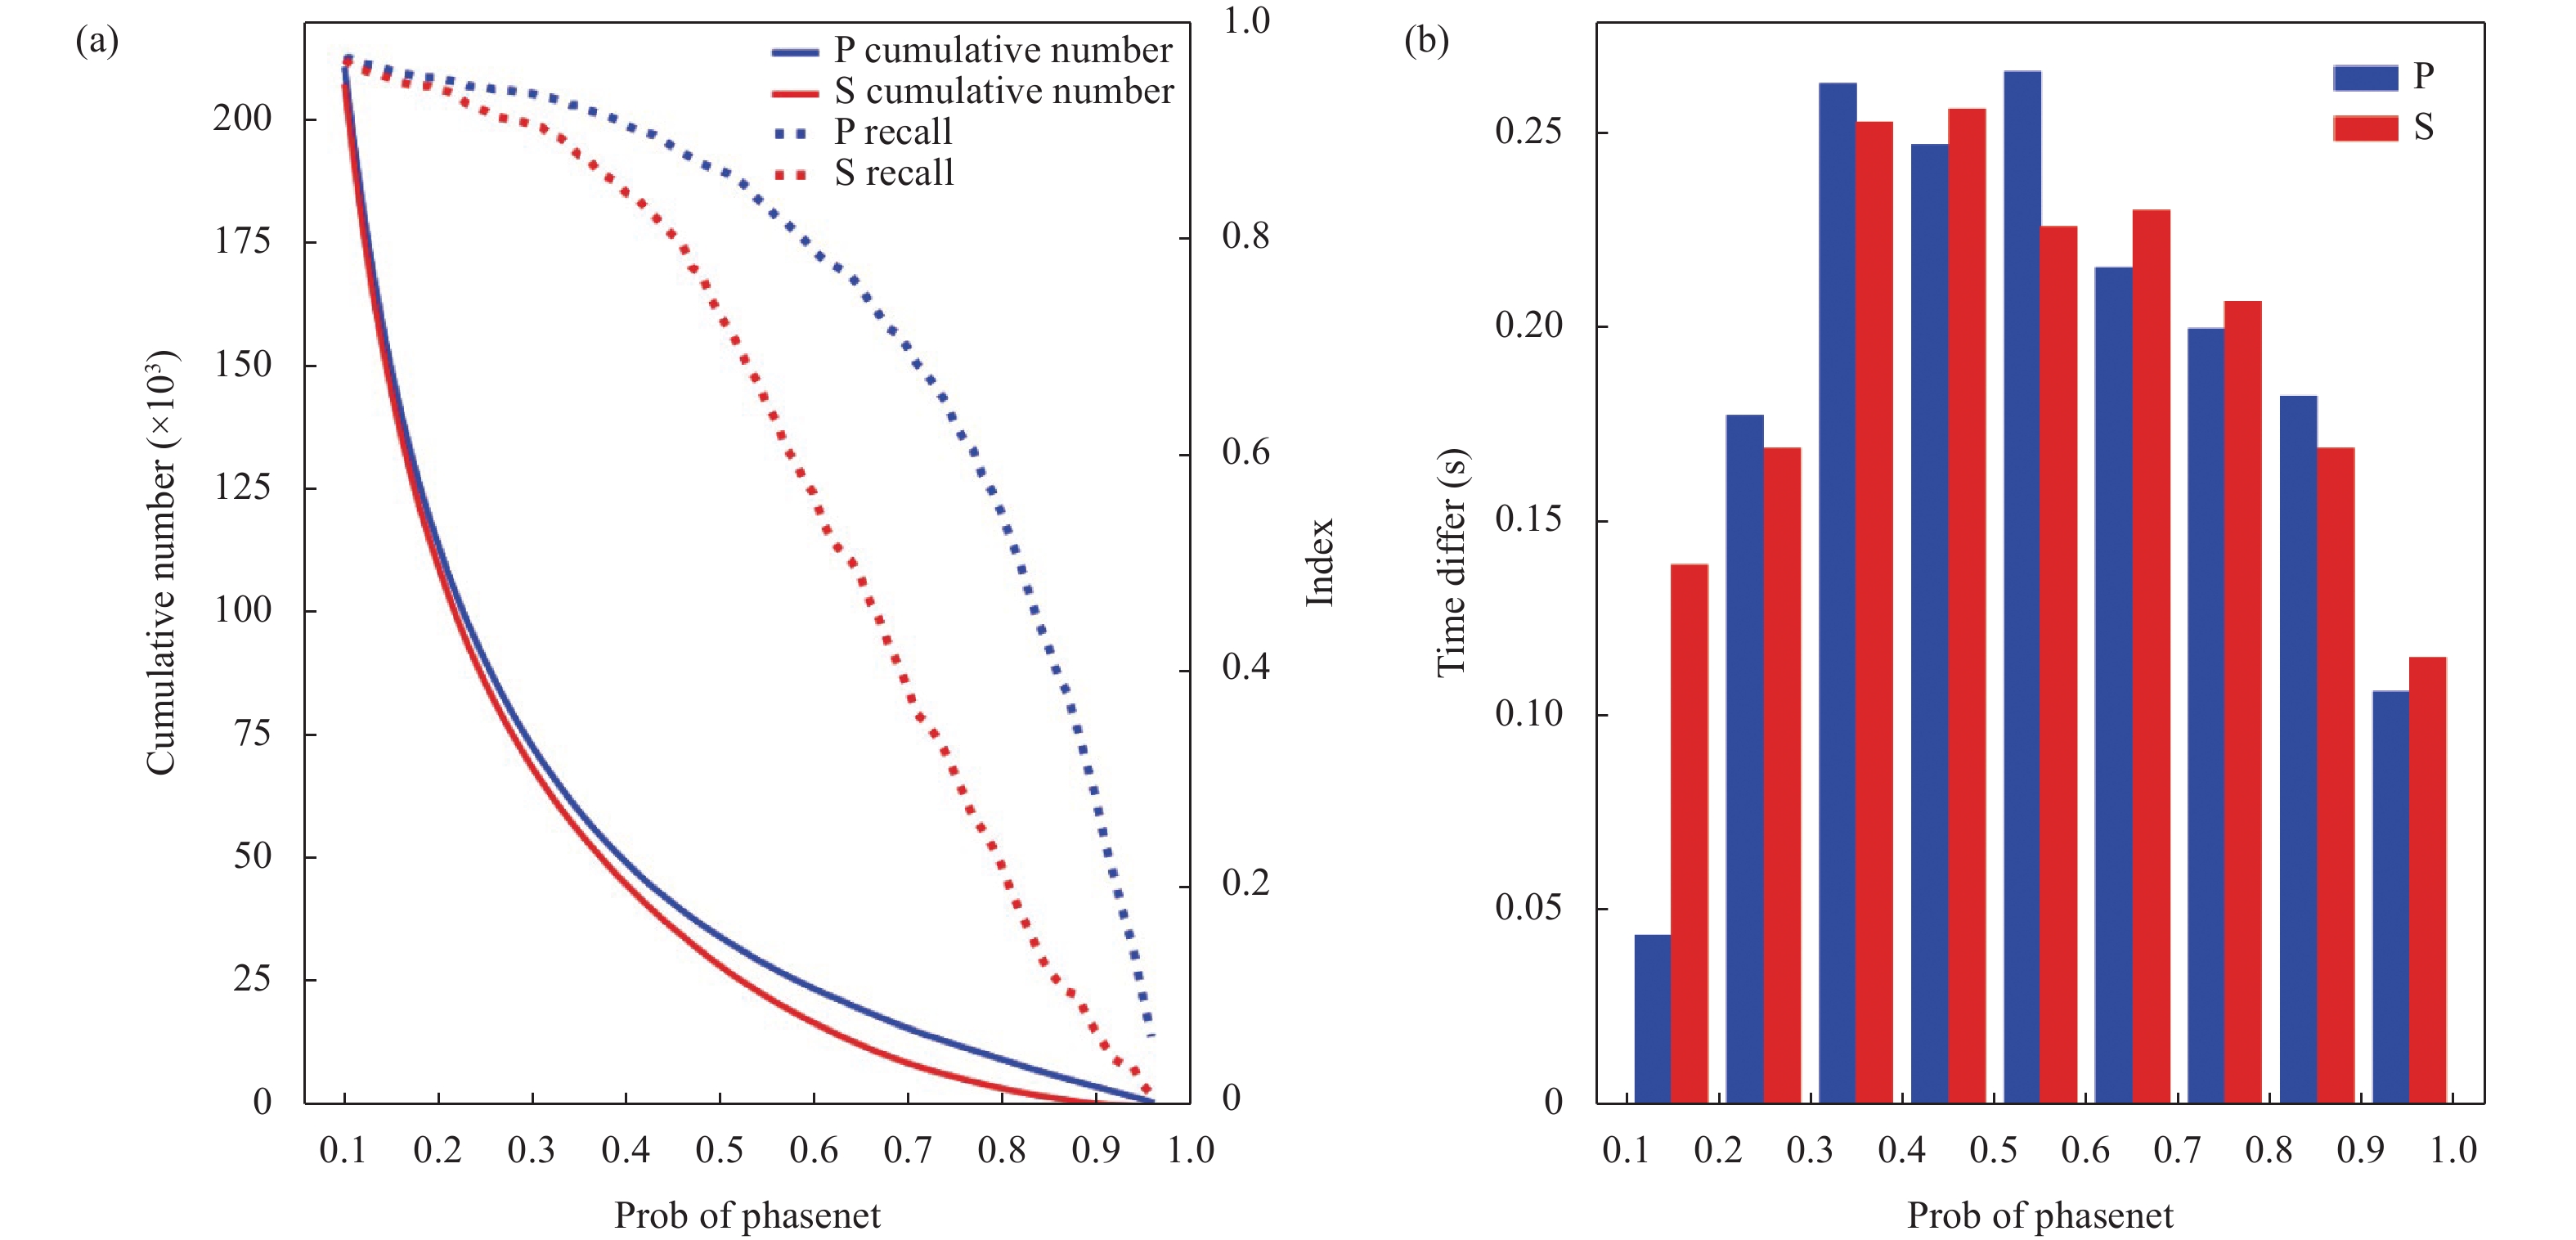
PhaseNet has only one external parameter, the threshold of pickup probability. To determine the appropriate probability threshold for the study area, we first used PhaseNet to process the 14-day continuous waveform data from August 10 to August 23, 2021, obtaining 209,930 P- and 206,488 S-wave phases with a probability above 0.1. All these seismic phases were compared with the 797 P- and 611 S-wave phases, which were manually picked (Figure 2). The recall (R), precision (P), and F1 score (F1) were obtained as follows:
Figure
2.
Seismic phases picked by PhaseNet in different probability intervals and comparison with manually picked seismic phases. (a) The solid and dotted lines delineate variation in the number of seismic phases picked by PhaseNet and the changes in recall under different probability thresholds, respectively; blue curves denote P-wave phases and red curves denote S-wave phases. (b) Average differences between the arrival time of the PhaseNet-picked seismic phases and that of manually picked seismic phases in different probability intervals (positive values represent a lagged arrival time of the PhaseNet-picked seismic phase).
where T (true) means that the actual result is consistent with the detection result; F (false) means that the actual result is not consistent with the detection result; p (positive) represents a positive event, usually representing a true event in seismic phase picking; n (negative) denotes a negative event which represents the noise in seismic phase picking. Increasing the threshold of pickup probability generally improves the precision but decreases the recall, thus affecting the completeness of the earthquake catalog; conversely, decreasing the threshold would influence the reliability of the earthquake catalog. The appropriate threshold value is usually determined using the F1 score to find a trade-off between recall and precision. However, not all possibly true seismic phases can be picked-up manually, so the precision is grossly underestimated, making it difficult to find a suitable threshold value using the F1 score. In this study, we inferred the appropriate probability threshold based on the relationship between the probability threshold and the number of picked-up seismic phases (Figure 2a) and the quality of picked-up seismic phases in different probability intervals (Figure 2b). The two diagrams in Figure 2 indicate that the appropriate threshold value should be 0.3 or 0.5. In the former case, the number of picked-up seismic phases grows at the maximum rate, and the recall approaches 1. In the latter case, the increase in the recall has slowed down, while the growth rate of the number of picked-up seismic phases starts to increase. Compared with the picked seismic phase manually, we determined that (1) the arrival time of the seismic phases picked up by PhaseNet lags behind the actual arrival time. Zhao M et al. (2021) applied PhaseNet to study the Changning region in Sichuan province, China and found that this time lag can be eliminated using the model obtained after transfer learning. Therefore, one of our future tasks is to collect more reliable seismic observations for transfer learning. (2) The seismic phases picked up with a probability threshold above 0.5 exhibit notably smaller differences than those picked up manually. Based on the choices of previous researchers, we ultimately chose a pickup probability threshold of 0.5.
3.2
Association and location
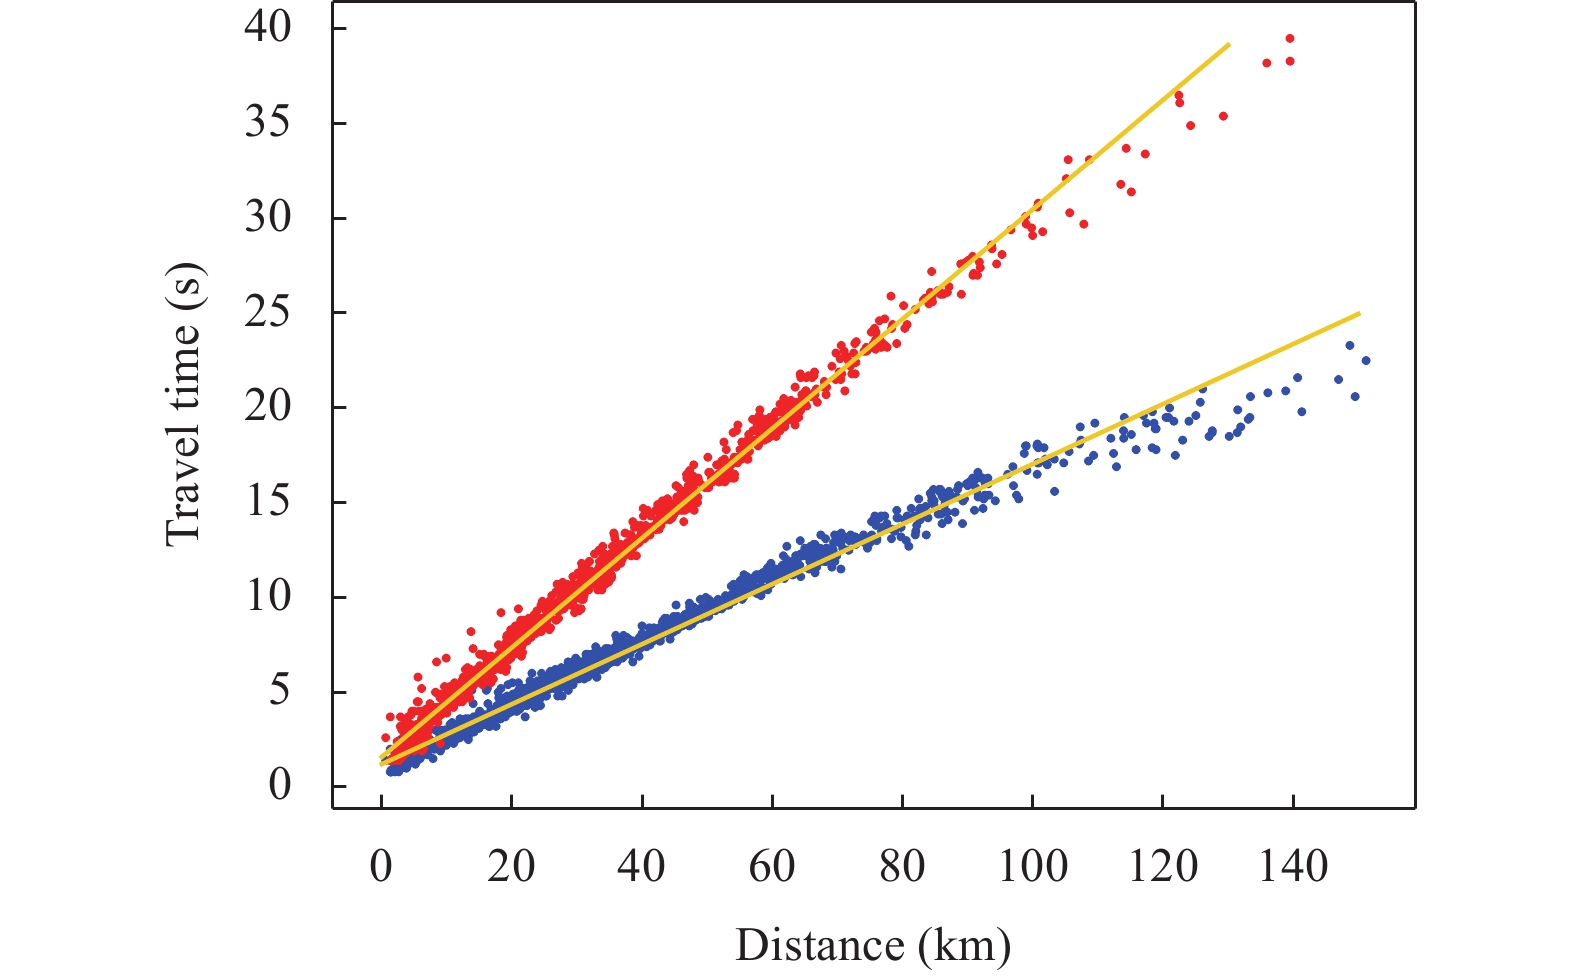
We adopted the rapid earthquake association and location (REAL) (Zhang M et al., 2019) method, based on grid search, to process the seismic phases obtained by PhaseNet with a pickup probability above 0.5. This method traces the seismic phases collected at the station back to a point in the grid according to the travel-time table, and the number of P- and S-wave phases associated with each point is calculated using the objective function. Finally, whether the constructed association corresponds to an actual seismic event is determined according to the objective function and the given constraints. Wang SY et al. (2017) believe that most earthquakes in western Guizhou province have a focal depth of less than 20 km. Chang TG and Hu X (2018) concluded that the epicenters of reservoir earthquakes are generally distributed around the reservoirs, no more than 10 km from the reservoir bank, and their depths are typically within 3–5 km. Therefore, considering the station deployment patterns, we set the initially picked seismic phase as the center point, began searching in a horizontal range of 0.4° and a vertical range of 0–20 km. The grid size was set to 0.2° × 0.2° × 2 km. We finally associated and located 553 seismic events; after eliminating those with a maximum azimuthal gap greater than 300°, 506 events remained. These 506 events have an average root mean square (RMS) travel-time residual of 0.26 s, with a median value of 0.23 s. To obtain more reliable earthquake locations, we determined the absolute locations using HYPOINVERSE (Lienert et al., 1986), eliminating the events with a maximum azimuthal gap greater than 300° and an RMS travel-time residual above 0.5 s. Finally, 426 events were selected for subsequent analysis. When the epicentral distance is less than 120 km, there is a clear linear relationship between the travel time of the seismic phases and the epicentral distance (Figure 3). When the epicentral distance is greater than 120 km, the travel-time curves exhibit significant deviations. Based on the minimum epicentral distance that allows the head wave to arrive earlier than the direct wave, as well as the crustal thickness in the study area (Cha XH et al., 2021), we speculate that when the epicentral distance is greater than 120 km, the first arrival picked up is the head wave, rather than the direct wave, which leads to the apparent deviation of the travel-time curve. Since we reduced the weights of the relatively remote seismic stations during absolute earthquake location, such deviations would not affect the reliability of our final location results. These 426 events have an average RMS travel-time residual of 0.12 s, with a median value of 0.11 s, indicating significant improvements compared to the REAL results. The average horizontal and vertical errors of the HYPOINVERSE results calculated with confidence ellipses were 1.76 and 3.17 km, and the median values were 1.01 and 1.36 km, respectively.
Figure
3.
Relationship between seismic arrival times and epicentral distance. The blue and red dots denote P- and S-wave phases, respectively. The straight yellow lines were obtained by fitting the epicentral distance and the arrival time of P- and S-waves, respectively, and their slopes represent the mean velocity of P- and S-waves, respectively.
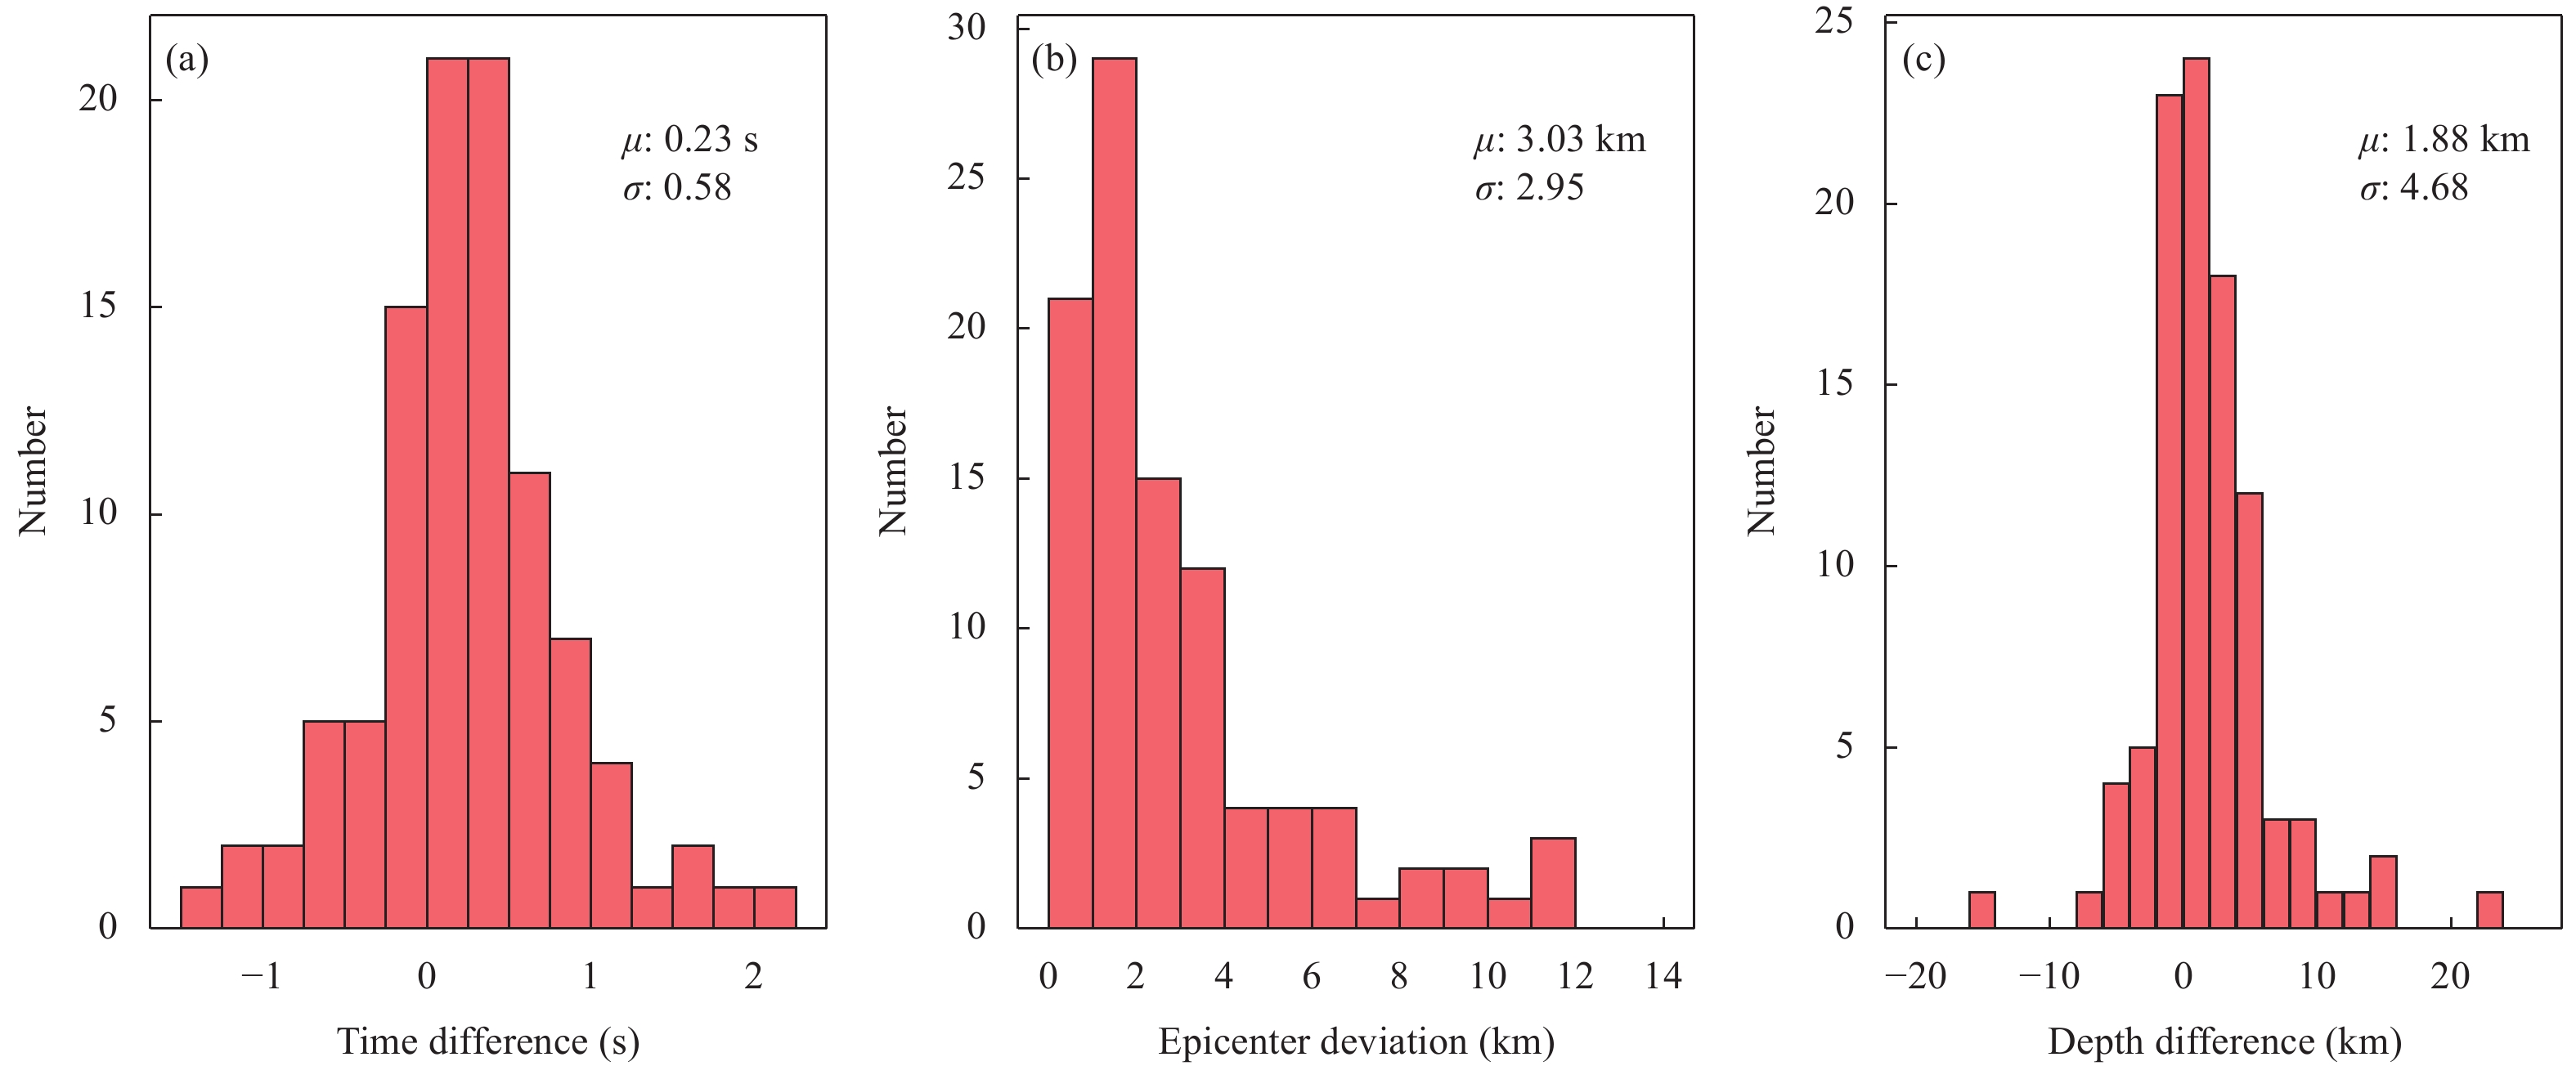
The earthquake location method currently adopted by RIS-monitoring networks in Guizhou province requires the real-time transmission of continuous waveforms from the stations where they are recorded to the network center. The staffs at the network centers pick up the seismic arrival times manually before conducting automatic earthquake location and magnitude determination, followed by the production of phase reports. According to the manually processed catalog, there were a total of 118 earthquakes during the 14 days from August 10 to August 23, 2021 (Figure 4a). We processed the same 14-day continuous waveform data using LOC-FLOW and obtained 426 seismic events (Figure 4b and 4c), of which 99 events matched with those obtained via manual location (the matching criteria include a travel-time difference <5 s and a deviation of epicenter location <15 km), indicating a recall rate of 83.9%. Comparing the basic epicentral parameters of these events ( Figure 5), we found that 88.9% of the earthquakes had an onset time difference within 1 s, 81.8% had a deviation in epicenter location of less than 5 km, and 77.8% had an absolute focal depth difference of less than 5 km.
Figure
4.
Comparison of earthquake locations for the events in the manual catalog, REAL catalog, and absolute location catalog. (a) Distribution of manually processed events; (b) distribution of events in the REAL catalog; (c) distribution of events in the absolute location catalog; (d) distribution of extra events detected by the automatic location method; (e) locations of the manually located events that matched with those in the REAL catalog; (f) locations of the manually located events that matched with those in the absolute location catalog. The black and cyan curves in the diagrams represent faults and rivers, respectively; orange rectangles indicate dams; green triangles denote seismic stations; circles represent seismic events, and the size of the circles in (a), (b), (c), and (d) indicate earthquake magnitude; blue and white circles denote the events in the manual and automatic catalogs, respectively, while yellow circles denote events in the manual catalog that are not present in the automatic catalog; red circle represents the location of Event A, and the red star represents the location of Event B; the pairs of blue and white circles connected by line segments in (e) and (f) represent the matched pairs of events in the manual and automatic catalogs, with the length of the connecting line indicating the deviation of the event′s location.
Figure
5.
Histograms comparing the basic epicentral parameters of the automatic and manual location results. (a) Histogram of the difference in seismic onset time (a positive value represents a lagged onset time for the absolute location result); (b) histogram of the deviation in epicenter location; (c) histogram of the difference in focal depth (a positive value indicates a greater depth for the absolute location result). μ and σ denote the mean and standard deviation, respectively, of the differences in basic epicentral parameters of the automatic and manual location results.
Most of the 19 events failed to be detected (Figure 4a) were distributed at the edge of the grid or beyond it. Four of these were failed because of the setting of the maximum azimuthal gap, and the other 15 include one with
ML3.0, one with
ML2.0, four with
ML1.0–
ML2.0, and nine with
ML < 1.0. Three of
ML < 2.0 events were excluded from the catalog during seismic phase picking but were included in the catalog when we lowered the seismic phase pickup threshold of PhaseNet to 0.3. We manually inspected the waveforms of these three events and found that their signal-to-noise ratios were relatively low. One event of
ML2.0 and one event of
ML1.5 were lost during phase association because their epicenters are more than 40 km from the nearest stations, beyond the search range. The
ML3.0 event was failed because in the manual and automatic catalogs, its epicenter deviates by more than 15 km, contravening the matching criterion. This event occurred at the head of the Dongqing Reservoir, and the two stations to the east could not be associated with it using the REAL method, leading to the significant deviation in its location in the different catalogs. One of the two stations could be associated if the association constraints were relaxed, while the other could never be associated. After inspection, we observed that most manually located events show large travel-time residuals when they are associated with this latter station. We speculated that there may have been failures in the time service system at this station or that a crustal velocity anomaly may have existed between the region where the
ML3.0 event occurred and the station. The exact reason needs to be explored further using a variety of seismological measures with more abundant observations. The seismic phase recorded by the abnormal station may be mixed with the accurate seismic phase to locate the earthquake by the staff, and result in the final location deviating from the actual cases. In contrast, the automatic location method follows a uniform operation standard so that discrete points are treated consistently.
We compared the distributions of seismic events in the manual, REAL, and absolute location catalogs obtained in the present study (Figure 4). The REAL and absolute location methods returned very similar results. Compared to the manual processed catalog, all events can be found at the same locations except for those unmatched events described above, e.g., at the edge of the region or affected by individual stations. We manually examined the waveforms of several seismic events and marked the one with the highest magnitude as Event A (Figure 4). The waveforms of Event A detected by automatic location (Figure 6a1, 6a2, and 6a3) showed that the arrival times of the seismic phases picked up by PhaseNet were relatively accurate, and the REAL association results are reliable. The automatic location method also revealed multiple low-magnitude earthquakes at the same locations, including those near the Qinglong fault and west of the Beipan River. Several tectonic earthquakes that were deeper than the events in the reservoir areas were also identified around the Machang fault and Kaiyang-Nayong fault. For the extra seismic events that were not in the manual catalog, 86.02% of them had
ML < 1.0, and the others had
ML < 2.0. These results are reasonable. We manually examined the waveforms of several events with magnitude >1.0 and marked the one with the highest magnitude as Event B (Figure 4b and 4c). The waveforms of this event (Figure 6b1, 6b2, and 6b3) showed that the P- and S-wave phases picked up by PhaseNet are reliable, and the relationship between this event′s epicentral distance and the seismic arrival times are reasonable. Thus, Event B is a real seismic event that is missing from the manual catalog. To determine whether the automatic location results are realistic and reliable, we manually checked the waveforms of all events in the absolute location catalog of the study area. We found that 386 events (90.6%) were real earthquakes, 13 events (3.1%) were attributed to blasting vibrations, 22 events (5.2%) were associated with karst collapse, and 5 events with a magnitude of approximately 0.1 (1.2%) were only recorded as clear seismic phases at adjacent stations.
Figure
6.
Waveforms and seismic phases of automatically located events. (a1), (a2), and (a3) are the Z-, E- and N-component waveforms of Event A obtained by automatic location, and this event was also obtained by manual processing; (b1), (b2), and (b3) are the Z-, E- and N-component waveforms of Event B obtained by automatic location, which was missing from the manually processed results. The vertical blue and red lines mark the arrival times of the P- and S-wave, respectively.
Based on the above experiment, we concluded that it is appropriate to select events with a maximum azimuthal gap of less than 300° and an RMS travel-time residual less than 0.5 s when jointly processing data from the four RIS-monitoring networks in river basins of western Guizhou province. These criteria will provide a trade-off between accurate and complete microseismic monitoring and a high-resolution earthquake catalog for the region covered by seismic stations.
4.
Characteristics of seismicity in the reservoir regions of western Guizhou province
4.1
Earthquake location results
After using the LOC-FLOW workflow to automatically process the combined seismic data, we found that the results of P- and S-wave pickings had relatively high accuracy, and the results of REAL and HYPOINVERSE absolute location were essentially the same. Most events in the REAL catalog were preserved in the HYPOINVERSE location results, after earthquakes at the edge of the region were eliminated. Most events in the manual catalog were accurately recalled at the same locations, with additional low-magnitude earthquakes identified. Therefore, we further applied LOC-FLOW to retrospectively process the continuous waveform data recorded from 2020 to the first half of 2021 in the multiple river basins of western Guizhou province, with the aim of obtaining a relatively complete earthquake catalog which could be used to analyze the characteristics of seismicity in the western Guizhou province during the study period.
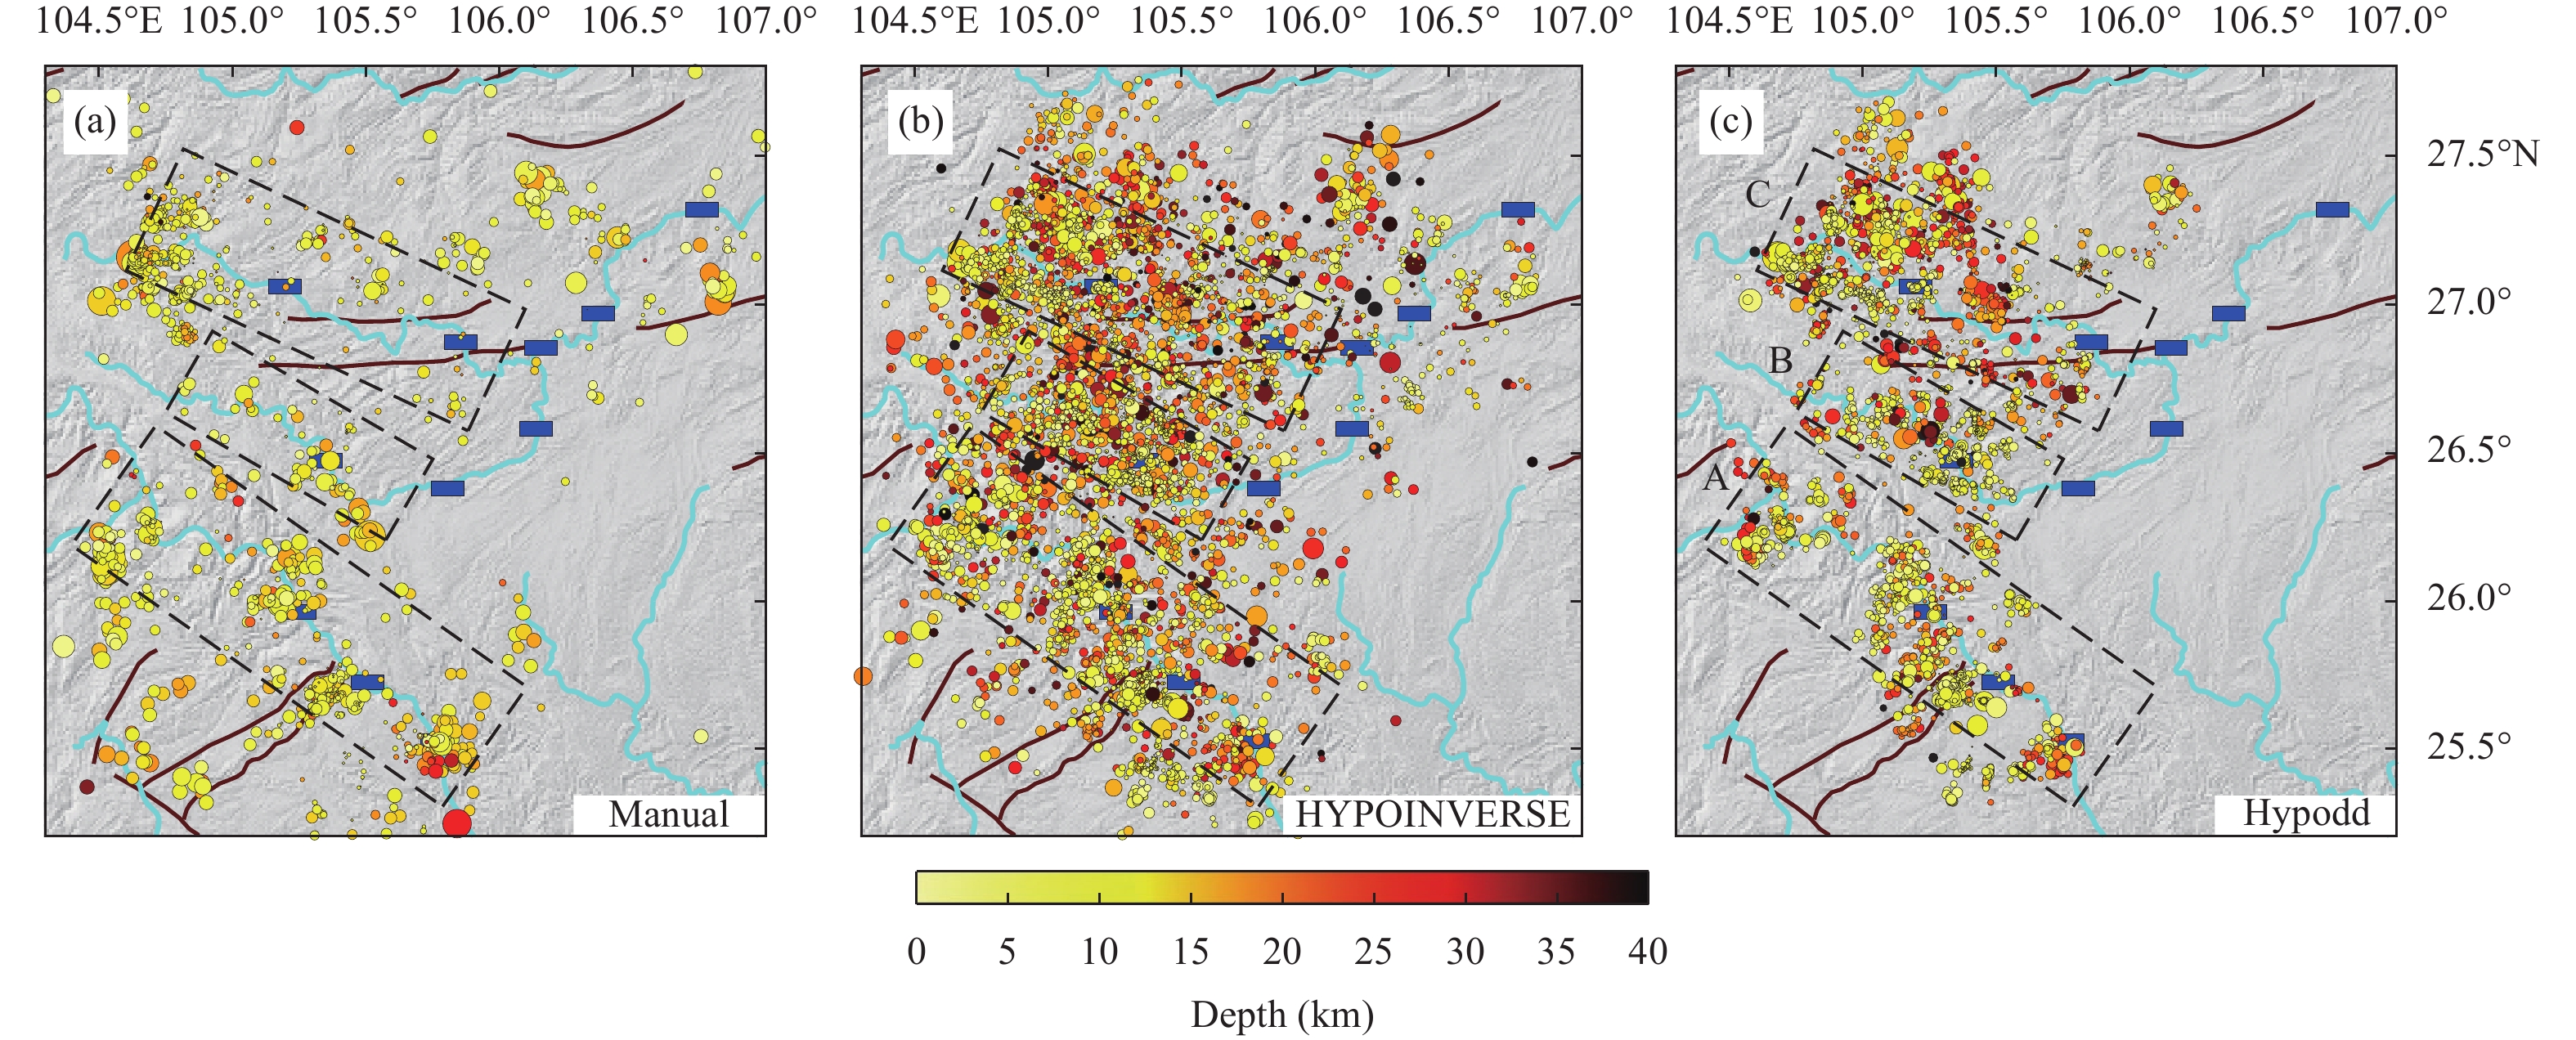
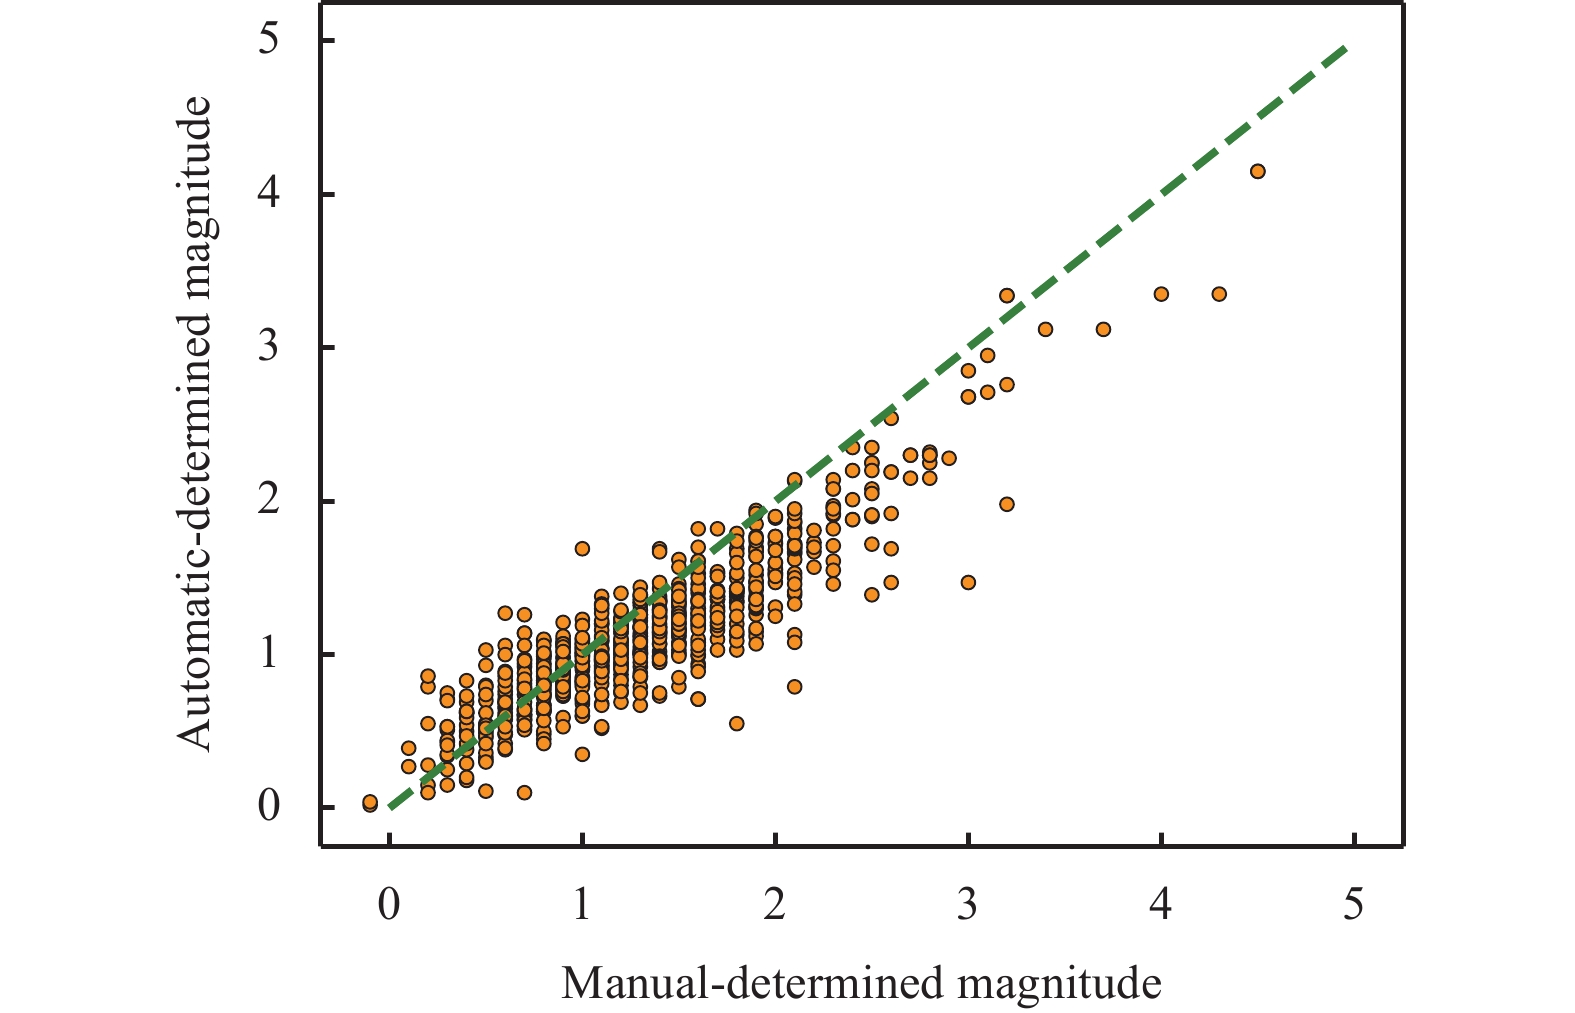
The manually processed earthquake catalog for this period contained 1,426 events (Figure 7a). Using absolute location based on the LOC-FLOW workflow, we obtained a new catalog that includes 7,179 events (Figure 7b), which is approximately five times the number of events in the manual catalog. Most of the new detected events were located around the manually located ones. Furthermore, according to the test above, roughly 90.6% of the 7,179 events, (i.e., 6,504 events) were real earthquakes, while the others may have been related to blasting or karst collapse. Comparing the magnitude of the events in the two catalogs (Figure 8), we can find that 87.5% of the events have a magnitude deviation within 0.5. For the events of magnitude >1.5, the automatically calculated magnitudes are all smaller than the manually determined magnitudes. We examined the events with a magnitude deviation of more than 0.5 and propose the following reasons for these considerable magnitude differences. (1) More seismic stations were involved, compared to the manual processing method, leading to a deviation in average magnitude. (2) In this study, the local earthquake magnitude was not calculated after being restored and simulated to DD-1 seismometer according to the requirements of national standards.
Figure
7.
Comparison of earthquake distribution patterns based on results of manual processing, LOC-FLOW absolute location, and relative location methods. Epicenter distribution of events in (a) the manual catalog, (b) the absolute location catalog and (c) the relocation catalog.The cyan and brown curves represent the rivers and faults, respectively; blue rectangles mark the dams; circles denote seismic events, with their size indicating earthquake magnitude and their color indicating focal depth; dashed black boxes delineate different zones, A: Beipan River Basin, B: Sancha River Basin, and C: Liuchong River Basin.
Figure
8.
Comparison of automatically and manually determined earthquake magnitudes. The horizontal axis represents the magnitude of events in the manual catalog, the vertical axis represents the automatically measured magnitude obtained in the present study, and the dashed green line indicates equal magnitudes.
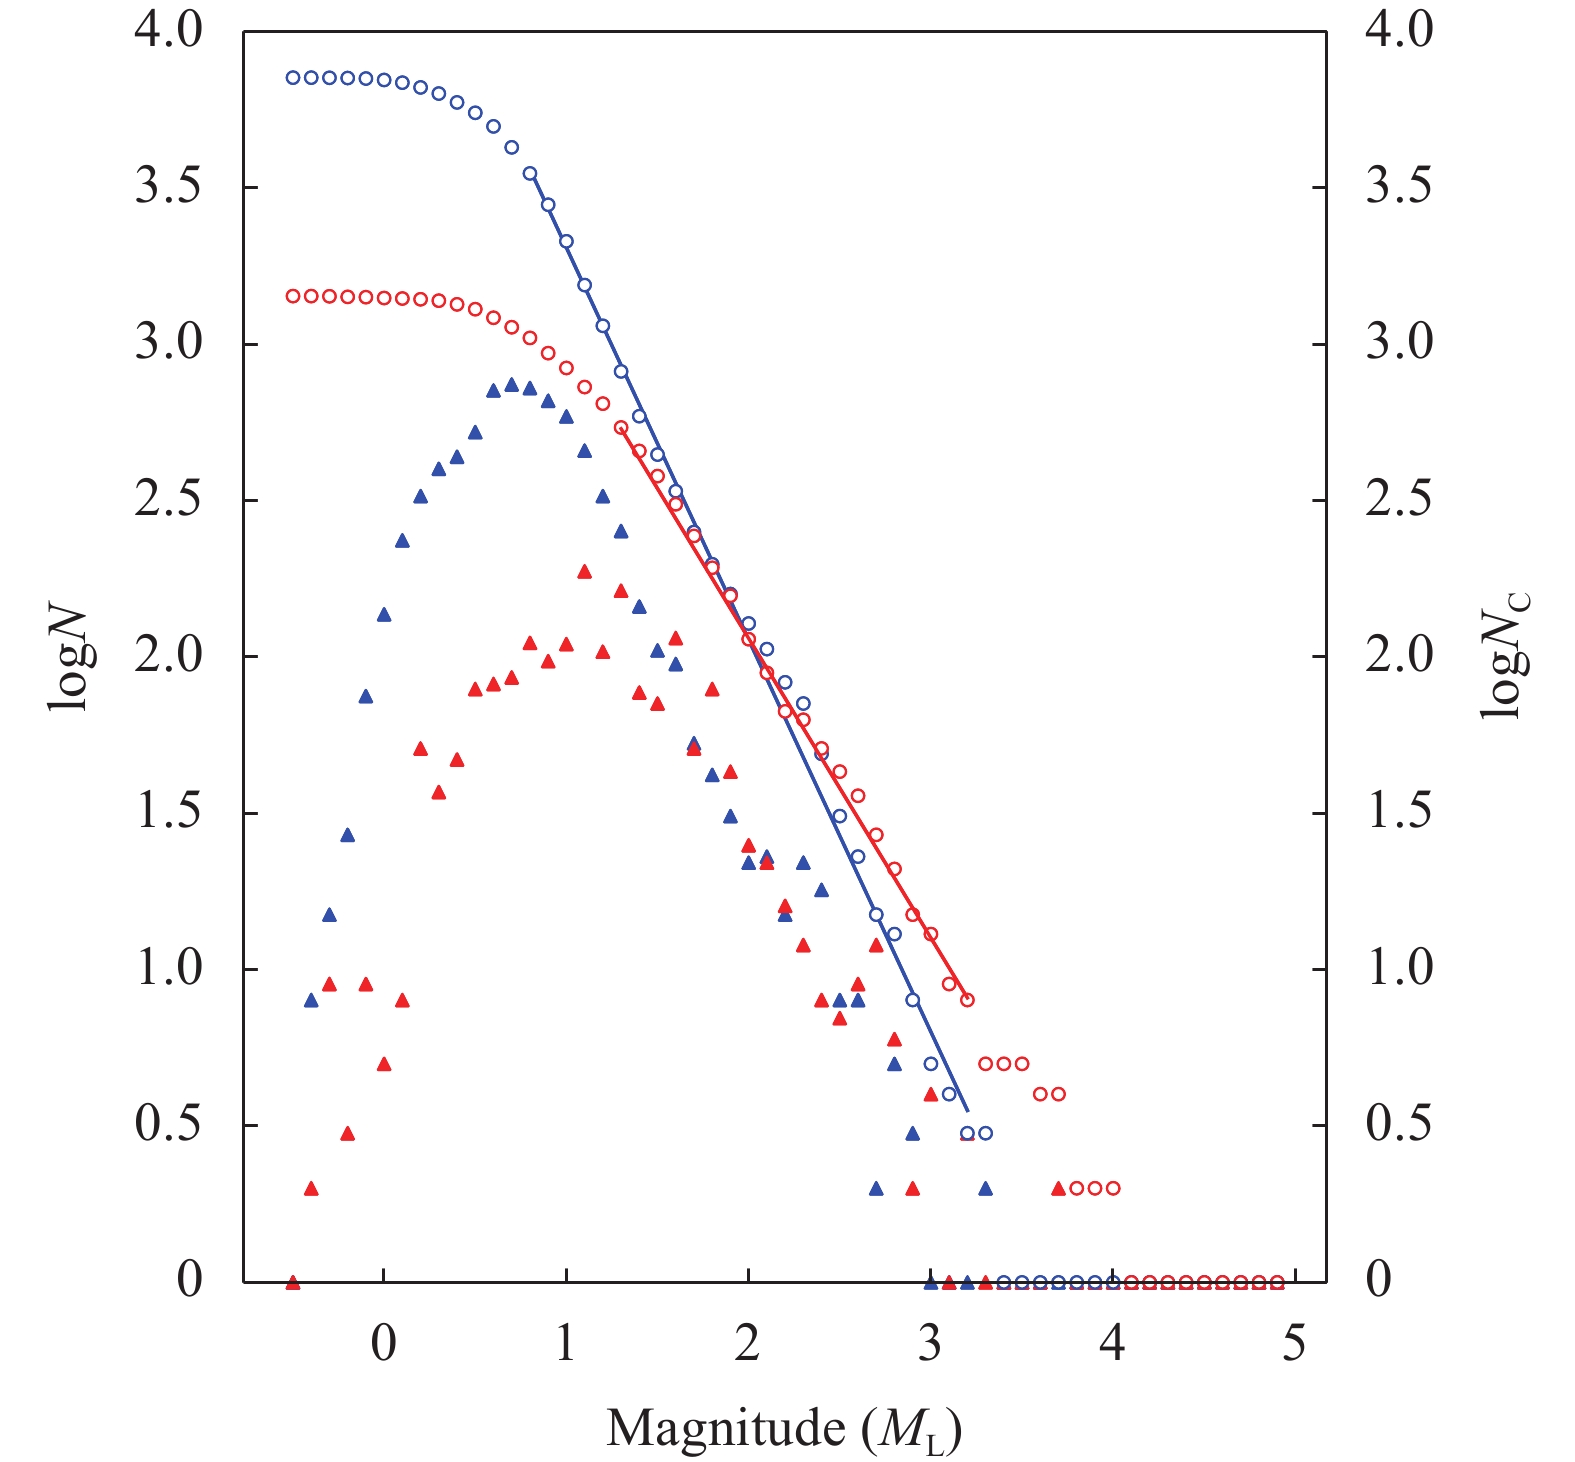
The b-value is an important parameter in seismicity analysis, and its calculation can be affected by incorrect completeness magnitude
MC (Wu G et al., 2019). Using the b-value stability method (Woessner and Wiemer, 2005), we obtained an
MC of approximately 1.3 for the manual catalog. The new catalog decreased the
MC to 0.8 (Figure 9). We then calculated the b-value for the entire study area based on the manual and automatic location catalogs, respectively. The corresponding values were 0.96 and 1.25, respectively. Researchers have found that the b-values of reservoir earthquakes are generally greater than 1 (Ma WT et al., 2013). Theoretically, as more microseismic events were detected and located by the automatic location method, the b-value calculated from the automatic catalog should be more reliable. Therefore, we believe that the b-value obtained in the present study is a more realistic reflection of the seismicity level in the study area than that obtained using the manual catalog.
Figure
9.
Comparison of
MC and b-value determined for the manual and automatic catalogs. N and NC represent the number of events and cumulative number of events, respectively. The unfilled circles represent the cumulative number of earthquakes of different magnitudes; the triangles represent the number of earthquakes of different magnitudes; the solid lines indicate the fitted relationship between earthquake magnitude and the cumulative number of events, and the absolute value of the slope is the b-value; red indicates the results of the manual processing method, and blue indicates the results of the automatic location workflow.
4.2
Spatial-temporal characteristics of seismic activities
Accurate earthquake locations are essential for reservoir earthquake studies (Jiang JZ et al., 2016). To obtain accurate focal depths of the seismic events, we adopted the HypoDD (Waldhauser and Ellsworth, 2000) and waveform cross-correlation methods for relative earthquake location and ultimately determined the hypocentral locations of 4,237 events (Figure 9c). Compared with the absolute location results, the relocated events were mainly distributed in clusters in the upper reaches of the Beipan River, the upper reaches of the Sancha River, and near the Liuchong River from south to north, and their focal depths were also more concentrated. Few earthquakes were identified around the four large reservoirs in the lower reaches of the Sancha River and on the mainstream of the Wujiang River. Previous research has shown that the areas around three of the four reservoirs, i.e., the Wujiangdu Reservoir (impoundment began in 1979), Dongfeng Reservoir (impoundment began in 1994), and Yinzidu Reservoir (impoundment began in 2003), exhibited significantly increased seismicity in the initial period of reservoir impoundment, with some prominent reservoir-induced earthquakes (Wang SY, 2015). The current earthquake location results suggested a low seismicity level near these three large reservoirs. We divided the studied region into three zones, based on river basins, i.e., zone A in the Beipan River Basin, zone B in the Sancha River Basin, and zone C in the Liuchong River Basin. We counted the number of earthquakes and calculated the corresponding b-values in the whole region and the three zones respectively, using the new absolute location catalog. The focal depths of the events were also counted according to HypoDD relocation catalog. The results were listed and compared in Table 1. From the relocated results we can see that the events in zones A and B were mainly distributed in the reservoir areas, with a b-value greater than 1. More than three quarters of these earthquakes had a focal depth within 10 km, and 90% had a focal depth within 15 km. The b-value of the seismic events in zone C was less than 1. About 42% of the earthquakes in zone C had a focal depth within 5 km, and roughly 15% had a focal depth greater than 15 km.
Table
1.
Number of earthquakes, b-value, and focal depth distribution in zones A, B, and C
Number of earthquakes
b-value
Proportion of events with
focal depth between
0 and 5 km
Proportion of events with
focal depth between
5 and 10 km
Proportion of events with
focal depth between
10 and 15 km
Zone A covers the Beipan River Basin and contains three large reservoirs: the Guangzhao Reservoir, Mamaya Reservoir, and Dongqing Reservoir. The Guangzhao Reservoir has a dam height of 200.5 m, a storage capacity of 3.245 billion m3, and impoundment began in 2009; the Mamaya Reservoir has a dam height of 109 m, a storage capacity of 136.5 million m3, and impoundment began in 2014; the Dongqing Reservoir has a dam height of 149.5 m, a storage capacity of 958 million m3, and impoundment began in 2007. The bedrock of the reservoir regions in the Beipan River Basin is dominated by carbonate rocks, featuring developed karst systems and underground rivers. Research has shown that areas with notable karst development are prone to earthquakes after reservoir impoundment (Hu YL and Chen XC, 1979). Wang SY (2015) demonstrated that the seismicity levels of the Guangzhao Reservoir and Dongqing Reservoir increased significantly after their impoundment. The double-difference earthquake location results (Figure 7c) revealed that earthquakes in the Beipan River Basin were mainly clustered on the right bank of the river. There are earthquake activities around the Dongqing dam, mostly with a deep focal depth. No earthquakes were recorded in the river section from Dongqing to Mamaya. Between Mamaya and Guangzhao, seismic events were generally distributed on the right bank (south side) of the river, with a predominant NE trend. This is consistent with the trend of the nearby Qinglong fault. Many earthquakes were distributed in the river valleys between the faults, with focal depths of less than 5 km. The earthquakes in Guangzhao reservoir area are distributed in two clusters. One is near the dam and the other at the intersection of upstream rivers to the west, with the section between the two clusters no seismicity. Fractures were developed in the Beipan River Basin, with a NE-trending fault nearby. Seismicity in this area may be related to reservoir impoundment and the geologic and tectonic settings of the reservoir areas.
Zone B includes a 20-km-wide area along the middle reaches of the Sancha River within the Wujiang River Basin. This area contains the Qianzhong Water Conservancy Project, a landmark project constructed by China′s Western Development Strategy in central Guizhou province. In this zone, the Pingzhai Reservoir is located in the middle and upper reaches of the Sancha River, on the river section bordering Liuzhi and Zhijin. The reservoir has a maximum dam height of 162.6 m, a storage capacity of 1.089 billion m3, and forms part of a Type-I large-scale water conservancy and hydropower project. Records from the reservoir-monitoring network of this project can be jointly processed with data from the seismic networks of the Qianxinan and Qianxibei Water Conservancy Projects to the south and north, which will significantly enhance seismic monitoring capacity in central Guizhou province. The impoundment of the Pingzhai Reservoir started at the end of April 2015. Local seismicity increased significantly after this impoundment, but the frequency of earthquake occurrence decreased after a period. According to the relative location results, from 2020 to the first half of 2021, earthquakes in zone B mainly occurred within 20 km-wide along the river, with a focal depth typically less than 5 km. In early 2020, a cluster of shallow earthquakes occurred near the Yinzidu Reservoir, a small and recently impounded reservoir. These earthquakes may be related to the impoundment of this reservoir. Karsts are very well-developed on the left bank of the Pingzhai Reservoir, with a total of five karst systems formed under lithologic and tectonic controls (Sun HM, 2014). This also explains why earthquakes are more frequent at the north than at the south of the river and are concentrated around several tributaries in its upper reaches.
Zone C covers an area across the Liuchong River, a mainstream section of the Wujiang River, where the Qianxibei Water Conservancy Project is constructed. The Hongjiadu Reservoir in this zone has a dam height of 179.5 m and a storage capacity of 4.925 billion m3. The region around the reservoir features karst development, with complex geological structures, numerous fractures, and relatively high tectonic stress (Jiang CS and Peng WL, 1991). The impoundment of this reservoir officially began on April 6, 2004, after which prominent earthquakes were induced (Wang SY, 2015). As shown in Figure 7c, 16 years after reservoir impoundment, the earthquakes occurring near the Hongjiadu Reservoir are far from the reservoir bank, and their focal depths are generally greater than 10 km, indicating a low seismicity level around the Hongjiadu Reservoir at present. The Jiayan Reservoir upstream of Hongjiadu has a dam height of 154 m, a storage capacity of 1.323 billion m3, and its impoundment officially started on December 28, 2021. The earthquake-monitoring period of this study was prior to the official impoundment of the Jiayan Reservoir, but there were already two obvious seismic clusters: one on the right bank of the reservoir and another on the left bank at the bend of the Liuchong River, about 40 km upstream of the dam. The focal depths of these earthquakes were mostly within 10 km. Two other events of magnitude 3.0 or above occurred 0.2 km from the reservoir bank. Both events had a focal depth of less than 10 km, and the difference between their onset times was approximately 4 min. The above findings indicate a generally high level of seismicity in the Jiayan reservoir area. Scattered tectonic earthquakes with relatively large focal depths also occurred approximately 50 km from the left bank of the reservoir.
5.
Discussion and conclusions
Large reservoirs are at risk of RIS. With the continuous construction of RIS-monitoring networks, the volume of seismic data is increasing rapidly. Manually processing seismic data that rely on human-computer interaction are no longer suitable for real-time earthquake monitoring in reservoir areas. In this study, we first applied the LOC-FLOW workflow to process the 14-day continuous waveform data recorded by stations in multiple river basins of western Guizhou province. These results show that the workflow has good generalization capacity in reservoir areas. Thus, the detection and location of microseismic events in reservoir areas can be achieved by setting reasonable model parameters for different station distribution patterns and monitoring targets. The accuracy of earthquake catalogs can be further improved by collecting additional localized observation data and training PhaseNet with the transfer learning method to obtain a local seismic phase-picking model. Future research will aim to develop a real-time seismic monitoring system for reservoir areas, based on LOC-FLOW.
Additionally, we used LOC-FLOW to process continuous waveform data recorded from 2020 to the first half of 2021 in the reservoir areas in multiple river basins of western Guizhou province. The data from four RIS-monitoring networks along three rivers (tributaries) in western Guizhou province were combined for automatic identification of seismic phases, to create a new earthquake catalog of western Guizhou province from January 2020 to June 2021. A total of 7,179 events were detected during this period, which is five times the number of events in the manual catalog. The newly identified earthquakes were mainly distributed in the Beipan River Basin and along the Sancha and Liuchong Rivers. The completeness magnitude of the regional earthquake catalog
MC decreased from approximately 1.3 to 0.8. The absolute location catalog was used to calculate a b-value of 1.25 for seismicity in the western Guizhou area.
Guizhou is a karst-developed area featuring multi-layer karst aquifers and complex cave systems. The region around the Qianxi Water Conservancy Project features alternating carbonate and non-carbonate rocks, typical of a multi-layered carbonate system. According to historical seismic records, reservoir impoundment can easily trigger earthquakes in reservoir areas with carbonate bedrock. Previous research has shown that the areas around the Wujiangdu Reservoir (impoundment began in 1979), Dongfeng Reservoir (impoundment began in 1994), and Yinzidu Reservoir (impoundment began in 2003) exhibited significantly increased seismicity in the initial period of reservoir impoundment, with some prominent RIS (Wang SY, 2015). Our earthquake location results reveal relatively low seismicity levels around these reservoirs that were impounded 15 years ago. The Dongqing Reservoir (dam height 149.5 m, storage capacity 958 million m3, impoundment began in 2009) and Guangzhao Reservoir (dam height 200.5 m, storage capacity 3.245 billion m3, impoundment began in 2007) were impounded at a similar time but show notably different patterns of seismicity. Relatively few earthquakes have occurred in the Dongqing reservoir area and are mainly distributed close to the dam; approximately half of these events have a focal depth greater than 15 km. Seismic events around the Guangzhao reservoir area are distributed in clusters, and their focal depths are generally within 10 km. Such differences may be related to the reservoir storage capacity, as well as the geologic and tectonic settings, hydrogeological characteristics, and distribution of active faults in the reservoir areas. Seismicity remains prominent around the Mamaya and Pingzhai Reservoirs, which were impoundment relatively recently (impoundment began in 2013 and 2015, respectively). Our study reveals that these seismic events are clustered, have shallow focal depths, and are mainly distributed near the tributaries upstream of the dam or along faults. The region around the Jiayan Reservoir, where impoundment officially began in December 2021, exhibited a high level of seismicity before the impoundment. Therefore, any changes in seismicity in this area after the official reservoir impoundment deserve special attention.
Acknowledgments
This study was funded by the Science and Technology Project of Power Construction Corporation of China Ltd. (No. DJ-ZDXM-2020-55). We thank Prof. Miao Zhang at Dalhousie University, Canada, for sharing the LOC-FLOW automatic location workflow (
https://github.com/Dal-mzhang/LOC-FLOW). We are grateful to the editors and reviewers for their valuable comments. All topographic maps in this paper were plotted using GMT6 (Wessel et al., 2019).
Cha XH, Lü J, Jiang CL, Tang LR, Dong FF, Bao ZC and Dong Q (2021). Study on crustal structure in south China and adjacent areas based on receiver function. J Geod Geodyn 41(1): 67–73 https://doi.org/10.14075/j.jgg.2021.01.013 (in Chinese with English abstract).
Chang TG and Hu X (2018). Research progress on reservoir induced earthquake. J Hydraul Eng 49(9): 1109 – 1122 https://doi.org/10.13243/j.cnki.slxb.20180654 (in Chinese with English abstract).
General Administration of Quality Supervision, Inspection and Quarantine of the People's Republic of China, and Standardization Administration of the People's Republic of China (2017). GB 17740-2017 General ruler for earthquake magnitude. Standards Press of China, Beijing (in Chinese).
Gibbons SJ and Ringdal F (2006). The detection of low magnitude seismic events using array-based waveform correlation. Geophys J Int 165(1): 149 – 166 https://doi.org/10.1111/j.1365-246X.2006.02865.x.
Hu YL and Chen XC (1979). Discussion on the reservoir-induced earthquakes in China and some problems related to their origin. Seismol Geol (4): 45– 57 (in Chinese with English abstract).
Jiang CS and Peng WL (1991). A preliminary study of reservoir-induced earthquake at Hongjiadu power station, Guizhou. J Seismol Res 14(1): 58– 64 (in Chinese with English abstract).
Jiang JZ, Fu H and Chen QF (2016). Characteristics of seismicity of the Xiaowan reservoir in an area of active tectonics from double-difference relocation analysis. Chin J Geophys 59(7): 2468 – 2485 https://doi.org/10.6038/cjg20160713 (in Chinese with English abstract).
Liao SR, Zhang HC, Fan LP, Li BR, Huang LZ, Fang LH and Qin M (2021). Development of a real-time intelligent seismic processing system and its application in the 2021 Yunnan Yangbi MS6.4 earthquake. Chin J Geophys 64(10): 3632 – 3645 https://doi.org/10.6038/cjg2021O0532 (in Chinese with English abstract).
Lienert BR, Berg E and Frazer LN (1986). HYPOCENTER: An earthquake location method using centered, scaled, and adaptively damped least squares. Bull Seismol Soc Am 76(3): 771 – 783 https://doi.org/10.1785/BSSA0760030771.
Liu M, Zhang M, Zhu WQ, Ellsworth WL and Li HY (2020). Rapid characterization of the July 2019 Ridgecrest, California, earthquake sequence from raw seismic data using machine-learning phase picker. Geophys Res Lett 47(4): e2019GL086189 https://doi.org/10.1029/2019GL086189.
Ma WT, Lin Y, Yuan JL, Li HO, Xu CP and Luo JH (2013). Comparison and analysis on the basic features of reservoir-induced seismicity. Seismol Geol 35(4): 914 – 929 https://doi.org/10.3969/j.issn.0253-4967.2013.04.020 (in Chinese with English abstract).
Mousavi SM, Zhu WQ, Sheng YX and Beroza GC (2019). CRED: A deep residual network of convolutional and recurrent units for earthquake signal detection. Sci Rep 9(1): 10267 https://doi.org/10.1038/s41598-019-45748-1.
Mousavi SM, Ellsworth WL, Zhu WQ, Chuang LY and Beroza GC (2020). Earthquake transformer—an attentive deep-learning model for simultaneous earthquake detection and phase picking. Nat Commun 11(1): 3952 https://doi.org/10.1038/s41467-020-17591-w.
Senkaya M and Karslı H (2015). A semi-automatic approach to identify first arrival time: the Cross-Correlation Technique. Earth Sci Res J 18(2): 107 – 113 https://doi.org/10.15446/esrj.v18n2.35887.
Song FX, Kuleli HS, Toksöz MN, Ay E and Zhang HJ (2010). An improved method for hydrofracture-induced microseismic event detection and phase picking. Geophysics 75(6): A47 – A52 https://doi.org/10.1190/1.3484716.
Soto H and Schurr B (2021). DeepPhasePick: A method for detecting and picking seismic phases from local earthquakes based on highly optimized convolutional and recurrent deep neural networks. Geophys J Int 227(2): 1268 – 1294 https://doi.org/10.1093/gji/ggab266.
Sun HM (2014). Analysis for karst corrosion on left bank of Pingzhai reservoir of water conservancy hub in middle of Guizhou. J Water Resour Archit Eng 12(3): 76 – 79 https://doi.org/10.3969/j.issn.1672-1144.2014.03.017 (in Chinese with English abstract).
Waldhauser F and Ellsworth WL (2000). A double-difference earthquake location algorithm: Method and application to the Northern Hayward Fault, California. Bull Seismol Soci Am 90(6): 1353 – 1368 https://doi.org/10.1785/0120000006.
Wang SY (2015). Studying on the reservoirs induced by earthquakes in Guizhou. Guizhou Sci 33(5): 1– 5 (in Chinese with English abstract).
Wang SY, Liang C, Ji XX, Luo YH, Hao J, Liu Y, Ou PZ and Zhang XW (2017). Seismic distribution, division and zonation of Guizhou province. Guizhou Geol 34(1): 1– 8 (in Chinese with English abstract).
Wessel P, Luis JF, Uieda L, Scharroo R, Wobbe F, Smith WHF and Tian D (2019). The generic mapping tools version 6. Geochem, Geophys, Geosyst 20(11): 5556 – 5564 https://doi.org/10.1029/2019GC008515.
Woessner J and Wiemer S (2005). Assessing the quality of earthquake catalogues: Estimating the magnitude of completeness and its uncertainty. Bull Seismol Soc Am 95(2): 684 – 698 https://doi.org/10.1785/0120040007.
Woollam J, Rietbrock A, Bueno A and de Angelis S (2019). Convolutional neural network for seismic phase classification, performance demonstration over a local seismic network. Seismol Res Lett 90(2A): 491 – 502 https://doi.org/10.1785/0220180312.
Wu G, Zhou Q and Ran HL (2019). The maximum likelihood estimation of b-value in magnitude-frequency relation and analysis of its influencing factors. Seismol Geol 41(1): 21 – 43 https://doi.org/10.3969/j.issn.0253-4967.2019.01.002 (in Chinese with English abstract).
Yang QY, Hu YL, Chen XC and Chen LY (1996). Catalogue of reservoir induced seismic events in the world. Seismol Geol 18(4): 453– 461 (in Chinese with English abstract).
Yang XY (1999). Summary of recent survey about reservoir induced earthquakes in our country. Seismol Geomagn Obs Res 20(2): 3– 15 (in Chinese with English abstract).
Zhang M and Wen LX (2015). An effective method for small event detection: match and locate (M&L). Geophys J Int200(3): 1523 – 1537 https://doi.org/10.1093/gji/ggu466.
Zhang M, Ellsworth WL and Beroza GC (2019). Rapid earthquake association and location. Seismol Res Lett 90(6): 2276 – 2284 https://doi.org/10.1785/0220190052.
Zhang M, Liu M, Feng T, Wang RJ and Zhu WQ (2022). LOC-FLOW: an end-to-end machine learning-based high-precision earthquake location workflow. Seismol Res Lett 93(5): 2426 – 2438 https://doi.org/10.1785/0220220019.
Zhao M, Chen S, Fang LH and Yuen DA (2019). Earthquake phase arrival auto-picking based on U-shaped convolutional neural network. Chin J Geophys 62(8): 3034 – 3042 https://doi.org/10.6038/cjg2019M0495 (in Chinese with English abstract).
Zhao M, Tang L, Chen S, Su JR and Zhang M (2021). Machine learning based automatic foreshock catalog building for the 2019 MS6.0 Changning, Sichuan earthquake. Chin J Geophys 64(1): 54 – 66 https://doi.org/10.6038/cjg2021O0271 (in Chinese with English abstract).
Zhou LQ, Zhao CP, Zhang M, Xu LS, Cui RS, Zhao C, Duan MQ and Luo J (2021). Machine-learning-based earthquake locations reveal the seismogenesis of the 2020 MW5.0 Qiaojia, Yunnan earthquake. Geophys J Int 228(3): 1637 – 1647 https://doi.org/10.1093/gji/ggab420.
Zhou YJ, Yue H, Kong QK and Zhou SY (2019). Hybrid event detection and phase-picking algorithm using convolutional and recurrent neural networks. Seismol Res Lett 90(3): 1079 – 1087 https://doi.org/10.1785/0220180319.
Zhu WQ and Beroza GC (2018). PhaseNet: a deep-neural-network-based seismic arrival-time picking method. Geophys J Int 216(1): 261 – 273 https://doi.org/10.1093/gji/ggy423.
Duan, L., Zhao, C., Zhou, L. et al. Unraveling the dynamics of seismicity in the Baihetan Reservoir Area with AI-based catalog. Tectonophysics, 2025.
DOI:10.1016/j.tecto.2024.230601
2.
Kuang, Y., Li, J. Machine learning-based aftershock seismicity of the 2015 Gorkha earthquake controlled by flat-ramp geometry and a tear fault. Earthquake Science, 2025, 38(1): 17-32.
DOI:10.1016/j.eqs.2024.05.002
3.
Costanzo, A.. A New Catalogue and Insights into the 2022 Adriatic Offshore Seismic Sequence Using a Machine Learning-Based Procedure. Sensors, 2025, 25(1): 82.
DOI:10.3390/s25010082
4.
Zhang, N., Zhou, L., Duan, M. et al. The temporal and spatial evolution characteristics of induced seismicity in the Changning shale gas field based on dense array. Scientific Reports, 2024, 14(1): 25287.
DOI:10.1038/s41598-024-77443-1
5.
Wang, F., Song, X., Li, J. Joint Inversion of Surface-Wave Dispersions and Receiver Functions Based on Deep Learning. Seismological Research Letters, 2024, 95(5): 3008-3020.
DOI:10.1785/0220240040
6.
Ray, P.P.. ChatGPT in transforming communication in seismic engineering: Case studies, implications, key challenges and future directions. Earthquake Science, 2024, 37(4): 352-367.
DOI:10.1016/j.eqs.2024.04.003
7.
Zhang, P., Sun, X., Zeng, Y. et al. South China Sea Typhoon Hagibis enhanced Xinfengjiang Reservoir seismicity. Earthquake Science, 2024, 37(3): 210-223.
DOI:10.1016/j.eqs.2024.03.003
8.
Fang, L., Li, Z. Preface to the special issue of Artificial Intelligence in Seismology. Earthquake Science, 2023, 36(2): 81-83.
DOI:10.1016/j.eqs.2023.03.003

 DownLoad: