Talebi M, Sivandi-Pour A, Ahmadi G, Farsangi E N, Esmaeili S, Banimahdi-Dehkordi M, Safizadeh H, Akbarpoor M, Ebrahimi E, Rad R S and Fallah M (2022). A reappraisal of active faults in central-east Iran (Kerman province). Earthq Sci 35(2): 122–137,. DOI: 10.1016/j.eqs.2022.05.001
Citation:
Talebi M, Sivandi-Pour A, Ahmadi G, Farsangi E N, Esmaeili S, Banimahdi-Dehkordi M, Safizadeh H, Akbarpoor M, Ebrahimi E, Rad R S and Fallah M (2022). A reappraisal of active faults in central-east Iran (Kerman province). Earthq Sci 35(2): 122–137,. DOI: 10.1016/j.eqs.2022.05.001
Talebi M, Sivandi-Pour A, Ahmadi G, Farsangi E N, Esmaeili S, Banimahdi-Dehkordi M, Safizadeh H, Akbarpoor M, Ebrahimi E, Rad R S and Fallah M (2022). A reappraisal of active faults in central-east Iran (Kerman province). Earthq Sci 35(2): 122–137,. DOI: 10.1016/j.eqs.2022.05.001
Citation:
Talebi M, Sivandi-Pour A, Ahmadi G, Farsangi E N, Esmaeili S, Banimahdi-Dehkordi M, Safizadeh H, Akbarpoor M, Ebrahimi E, Rad R S and Fallah M (2022). A reappraisal of active faults in central-east Iran (Kerman province). Earthq Sci 35(2): 122–137,. DOI: 10.1016/j.eqs.2022.05.001
• Providing a digitally-based active fault map of the central-east Iran.
• Investigating the relationship between the mapped fault and seismicity as well as GPS velocity fields.
• Satellite images have been integrated into geological maps published by the Geological Survey of Iran.
• Mapping the poorly exposed active faults, being able to produce strong events.
Abstract
Fault lineaments are the main input data in earthquake engineering and seismology studies. This study presents a digitally-based active fault map of the Kerman region in central-east Iran which experienced several devastating earthquakes on poorly exposed and/or not identified active faults. Using Landsat 8 data, we have carried out the image-based procedures of fault mapping, which include applying the contrast stretching technique, the principal component analysis, the color composite technique, the spectral rationing, and creating the false-color composite images. Besides, we have cross-checked the resulting map with the geological maps provided by the Geological Survey of Iran to decrease the associated uncertainties. The resulting map includes 123 fault segments, still, a part of which has been expressed in the previously compiled active-fault maps of Iran. Indeed, the new one is mapping the poorly exposed active faults, so-called secondary faults, which are able to produce strong events. These faults are primarily associated with poorly defined areas that accommodate low levels of seismicity; however, sporadic strong events are likely to occur. It has also been investigated that these kinds of faults are seismogenic and are able to produce destructive events. In total, the outcome of this study can also be jointed with seismic studies for investigating parts of the earthquake activity in central-east Iran, in particular for the fault-based approaches in impending earthquake-resistant buildings.
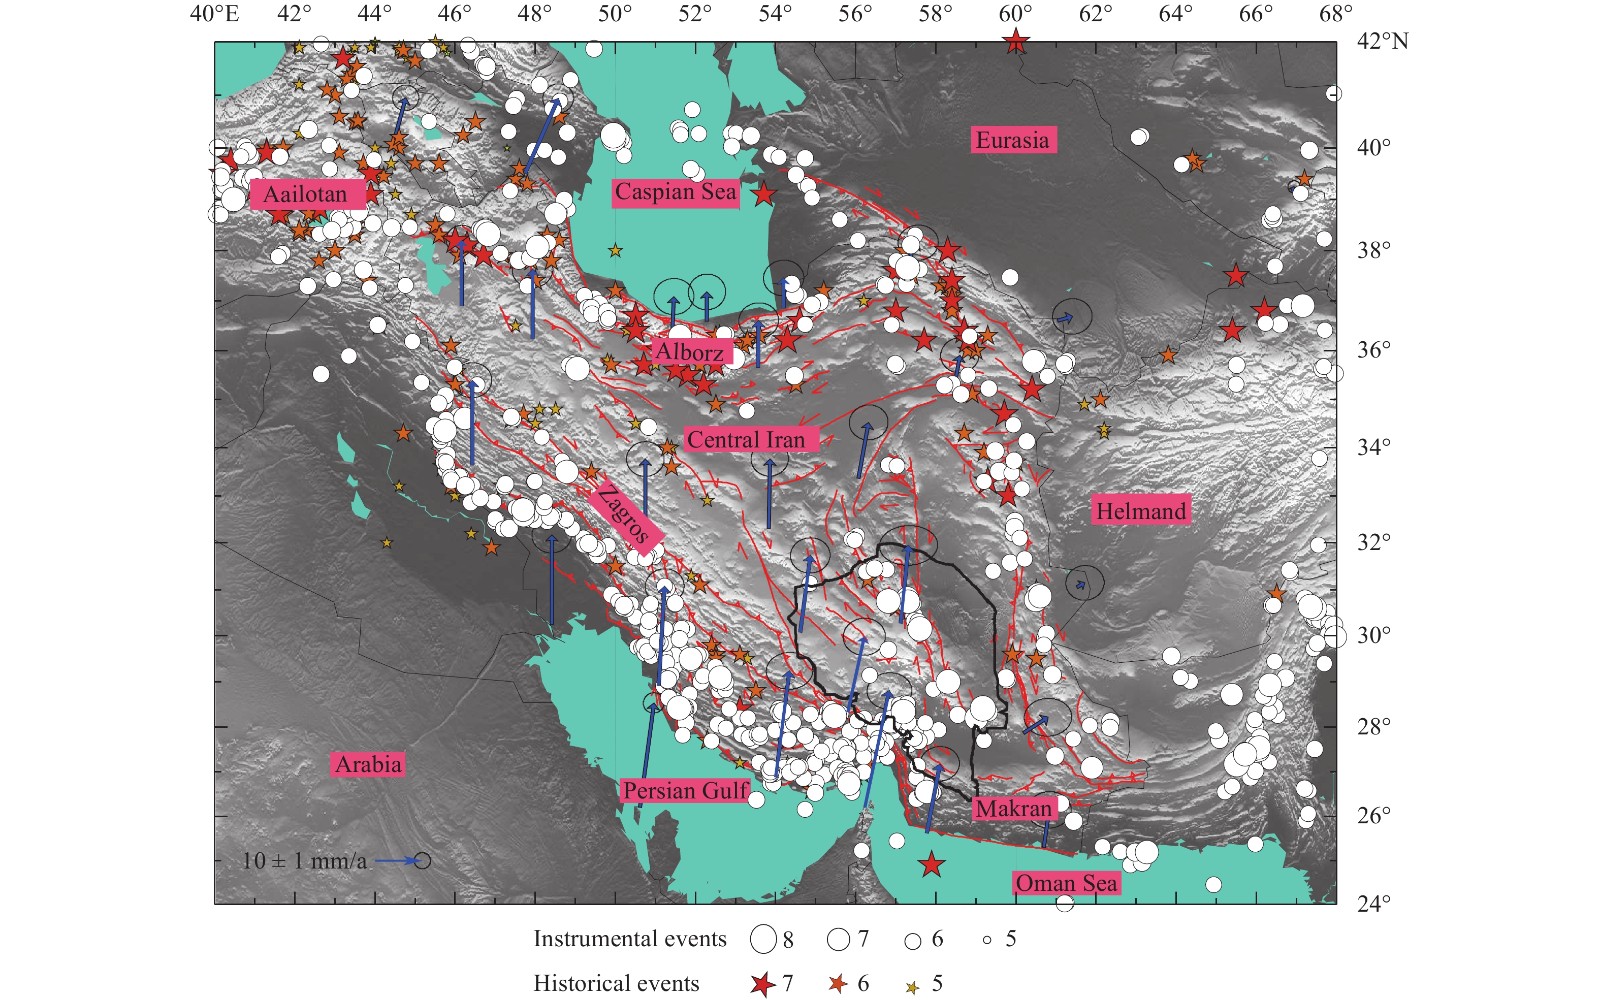
Kerman region, as the most extended political province in Iran, is situated in the central-east part of Iran between 26.5° and 32° north latitude and between 54.5° and 60° east longitude (Figure 1). The region is seismically active [e.g., it has experienced ~80 main earthquakes with moment magnitudes (MW) equal or greater than 5 in the last century] and has frequently been subjected by strong earthquakes, as exemplified by the events of 1981 Sirch MW7.1 (with ~3000 deaths; Raeesi et al., 2017), 1981 Golbaft MW6.7 (with ~3000 deaths; Raeesi et al., 2017), 1998 Fandogha MW6.6 (Mousavi-Bafrouei and Mahani, 2020), 2003 Bam MW6.6 (with ~31000 deaths; Raeesi et al., 2017), 2005 Zarand MW6.4 (with ~600 deaths; Raeesi et al., 2017), 2010 Rigan MW6.5 (Mousavi-Bafrouei and Mahani, 2020), 2011 Rigan MW6.2 (Mousavi-Bafrouei and Mahani, 2020), and 2017 Hojedk MW6.0 (Savidge et al., 2019).
Figure
1.
Illustration of the limits for the main seismotectonic zones, i.e., Zagros, Makran, and Central Iran, in and around the Kerman region (black polygon) (Mirzaei et al., 1998). Arrows illustrate the almost N-S convergent rates of the Iranian collision zone (Vernant et al., 2004), and solid red lines show major active faults (Hessami et al., 2003; Oveisi et al., 2016). Circles and stars also display the epicenter locations of main instrumental and historical MW≥5 earthquakes, respectively (Mousavi-Bafrouei and Mahani, 2020).
Despite an important topic throughout past researches, central-east Iran has experienced several devastating events, like 2003 Bam MW6.6, which occurred on poorly exposed and/or not identified active faults (e.g., Walker, 2006; Talebian et al., 2006; Nemati and Gheitanchi, 2011; Savidge et al., 2019). Indeed, before the occurrence of these earthquakes, which are hosted by so-called secondary faults (Walpersdorf et al., 2014), it was generally supposed that such events were not probably to occur where they did (e.g., Reza et al., 2014). This implies that the current view of the distribution of active faults in this region is still incomplete, and therefore novel knowledge is necessary to study seismic hazard posed by possible planar sources properly.
In this study, we have presented a digitally-based active fault map of the region. For a small-scale area, structural features, such as faults can locally be identified based on direct field observations. Anyway, for the purpose of the regional fault delineation associated with extensive areas, the image-based procedures of fault mapping are reasonable. Many studies in literature also argued the significance of remote sensing for regionally structural monitoring (e.g., Mountrakis et al., 1998; Gomez et al., 2005; Yassaghi, 2006; Taylor and Yin A, 2009; Ramli et al., 2010; Yazdi et al., 2011; Shah et al., 2018); especially for developing countries (Bocco et al., 2001). This seems to be mainly related to financial reasons as well as the availability and applicability of satellite image data; still, the outputs may naturally include some sorts of uncertainties (e.g., Shah et al., 2018).
The results show that the newly drawn faults are mostly associated with poorly defined areas; still, they can be considered as immature faults being able to create higher levels of stress drop compared to old faults (Manighetti et al., 2007). The history of Persian earthquakes shows that these kinds of faults can usually be seismogenic and are able to produce destructive events, when the major faults are quiescent (e.g., Talebian et al., 2004; Walpersdorf et al., 2014). The distribution of background seismicity in the study region also implies that most of the mapped faults are active.
In total, it seems that our resulting map can provide a basis for tectonics of the region (e.g., Koike et al., 1995) and be considered as a reference in future geological surveying. It can also supply a basis for seismic risk and hazard zonation assessments. Besides, it is able to join with seismicity studies as well as geophysical field works (e.g., Taylor and Yin A, 2009), so that it can improve our knowledge about the geological structures in the study region.
In the following sections, we first present a summary of the tectonic setting of the region. Then, we briefly describe the framework of the method and materials used for delineating lineaments. Finally, the delineated faults are presented and discussed using observational data (background seismicity and GPS velocity fields).
2.
Tectonic setting
The Iranian plateau is tectonically affected by the interaction between Arabian, Indian, and Eurasian plates. Active tectonics in Iran is associated with the distributed shortening over seismotectonic provinces of Zagros, Alborz, Makran, Kopeh Dagh, and central Iran (e.g., Mirzaei et al., 1998).
The Kerman region, situated in the central-east part of Iran, is tectonically influenced by active shallow crustal regions and subduction zones. The Central Iranian micro-continent is the main seismotectonic zone in the Kerman region, and the Zagros range and the Makran subduction region are around it (Figure 1). It is subdivided into some micro-blocks (Figure 2), namely Lut, Tabas, Kalmard, Posht-e-Badam, Bayaz-Bardsir, and Yazd blocks (Aghanabati, 2004), which may be due to sequential opening and closing of large oceanic systems or narrow marginal basins. These blocks have been divided by a set of large active faults, which have key roles in developing seismic patterns and deformation of the region. Indeed in this region, N-S to NW-SE-trending right-lateral strike-slip basement faults play the most important roles in accommodating the seismic deformation among the structural blocks (e.g., Berberian et al., 2001).
Figure
2.
Structural zones within the Kerman region (after Aghanabati, 2004).
Although there are few historically recorded seismic activities in this region (e.g., Ambraseys and Melville, 1982), most of the active faults within which have a clear expression of Quaternary fault displacements, so that the traces of the faults is visible in satellite imagery (e.g., Walker, 2006; Walker et al., 2010). Thus, the image-based procedures of fault mapping would be beneficial for this region in order to identify regionally geological features, such as faults, their movements, and their structural relations like pull-apart effects (e.g., Berberian et al., 2001). As mentioned by Walker (2006), this procedure is especially applicable in regions like eastern Iran, where usual fieldwork and accessibility to details of structures may be difficult. Moreover, such studies, the distribution of active faults, enable us to improve significantly the estimation of earthquake hazards posed by these faults.
In total, remote sensing can provide very useful information from available satellite images in a relatively simple, rapid, and inexpensive way. In particular, it makes a rather pragmatic approach to survey a large territory, quickly.
As the structural analysis from the satellite images has been presented in detail by the aforementioned references, we just describe a summary of the used procedure and materials.
The fault delineating procedure has been conducted, using Landsat 8 data, covering parts of the frames 159/39, 159/40, 160/38, and 160/39. The used images were recorded in 2019 and characterized with a ground resolution of 30 m × 30 m.
The mapping method basically aims to define structural features which have sharply different characteristics against their neighborhoods. Anyway, satellite image processing includes several steps, leading to an increase in the quality of the structural analysis.
We have considered the enhancing procedure to be consisting of preprocessing and progressive steps, which include applying the contrast stretching technique, the principal component analysis, color composite technique, the spectral rationing, and creating the false-color composite images.
Firstly, the preprocessing stage has been conducted through geometric, atmospheric, and radiometric calibrations. Then, the linear contrast stretching technique was used to provide better visual products. In order to create false-color composite images, two groups of spectral bands were used; the bands of 752 in the visible system and the bands of 321, which reflect the near-infrared one. Moreover, we have applied 3×3 directional high pass filters (N-S, E-W, NE-SW, and NW-SE) in order to do the edge sharpening procedure via using a function so-called Sobel operator. Besides, the method is known as “rationing of spectral bands” has also been tested in both grayscale and RGB spectral modes (we note that R, G, and B in RGB stand for red, green, and blue colors, respectively).
Overall, for delineating major lineaments corresponding to main faults, it can empirically be said that the false-color composite images with the spectral bands of 752 are more suitable for regions with rock outcrops. Besides, for regions of sedimentary deposits, implying the presence of concealed faults, using the directional high pass filters with the directions of E-W and NE-SW can be preferred. Figure 3 shows, as an example, a suite of materials used for delineating lineaments.
Figure
3.
Example of a suite of materials used for delineating lineaments in the area of the Nayband fault system. (a) A clip of geological quadrangle map (1:250000 series) of Lakar-Kuh (after Alavi Naini et al., 1981). (b) The false-color composite Landsat 8 image with the spectral bands of 752. In this panel, minor lineaments and two segments of the Nayband fault are shown with thin and bold red lines, respectively. (c) The enhanced Landsat 8 image by the E-W directed high pass filter. (d) The enhanced Landsat 8 image by NE-SW directed high pass filter.
Table
1.
List of the fault segments shown in Figure 4 in accordance with their numbers (No.). In the fault mechanism columns (FM), the letters N, R, DR, DS, and SS stand for normal, reverse (or thrust), dextral reverse, dextral strike-slip, and sinistral strike-slip, respectively. Each letter marked by ‘*’ indicates that the corresponding fault mechanism is suggested by remote sensing (e.g., evidence from abnormally geomorphologic features like displacement of drainage patterns or pull-apart basins), and no particular information has been found, in this regard, on neither official geological maps nor other published references; still, the faults are somehow traceable on the geological maps.
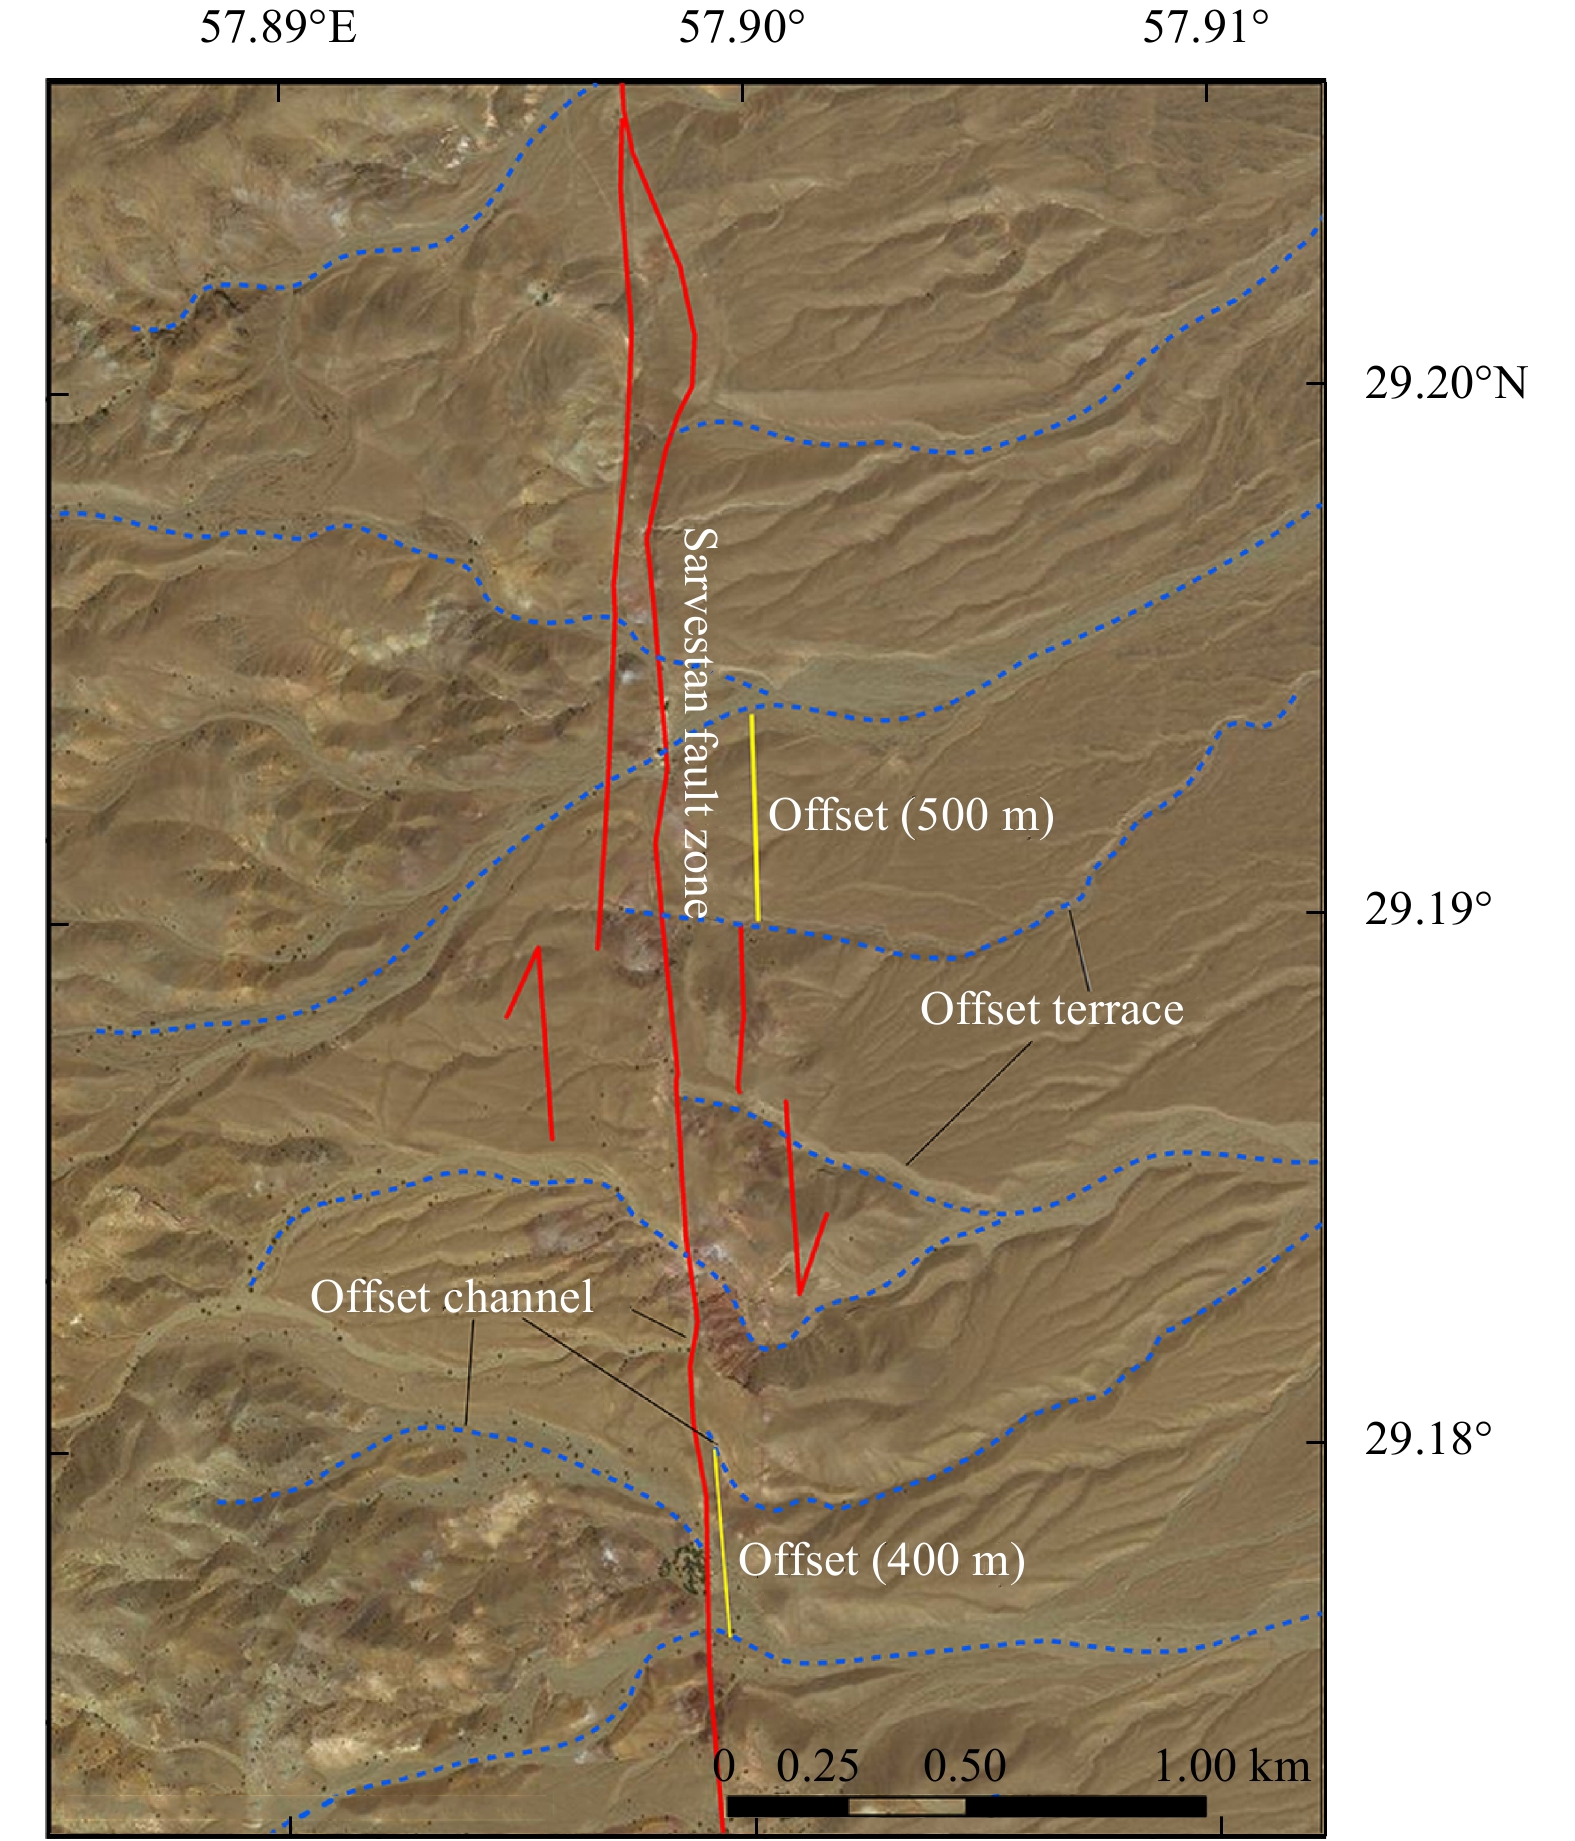
Accordingly, some of the faults in Figure 4 are delineated by considering abnormally geomorphologic features, including displacement or disruption of drainage patterns, river direction, or geological features. The Sarvestan fault system is one clear case implying right-slip shear, as explained by offset landforms with an offset of ~500 m (Figure 5). The Pedva and South-Lut fault systems also have similar characteristics.
Figure
5.
Northward looking view of the Sarvestan fault system implying right-slip shear, as explained by offset landforms with an offset of ~500 m. Data are from Bing (2021).
However, some of the mapped faults (e.g., Anar, Bam, Davaran, Dehshir, Gowk, Jirof, Kuhbanan, Lakarkun, Lalehzar, Nayband, Rafsanjan, Sabzevaran, Shahdad, and Shahr-e-Babak) have previously been identified as parts of the active fault maps of Iran by Hessami et al. (2003), Javadi et al. (2013), and Oveisi et al. (2016). These faults are of the most deep-seated crustal-scale basement faults, which have had significant roles in the present-day kinematics and structural geometry of the region. Indeed, these faults, known as the major faults, are assumed to load most of the strain and to slip at fast rates (Walpersdorf et al., 2014).
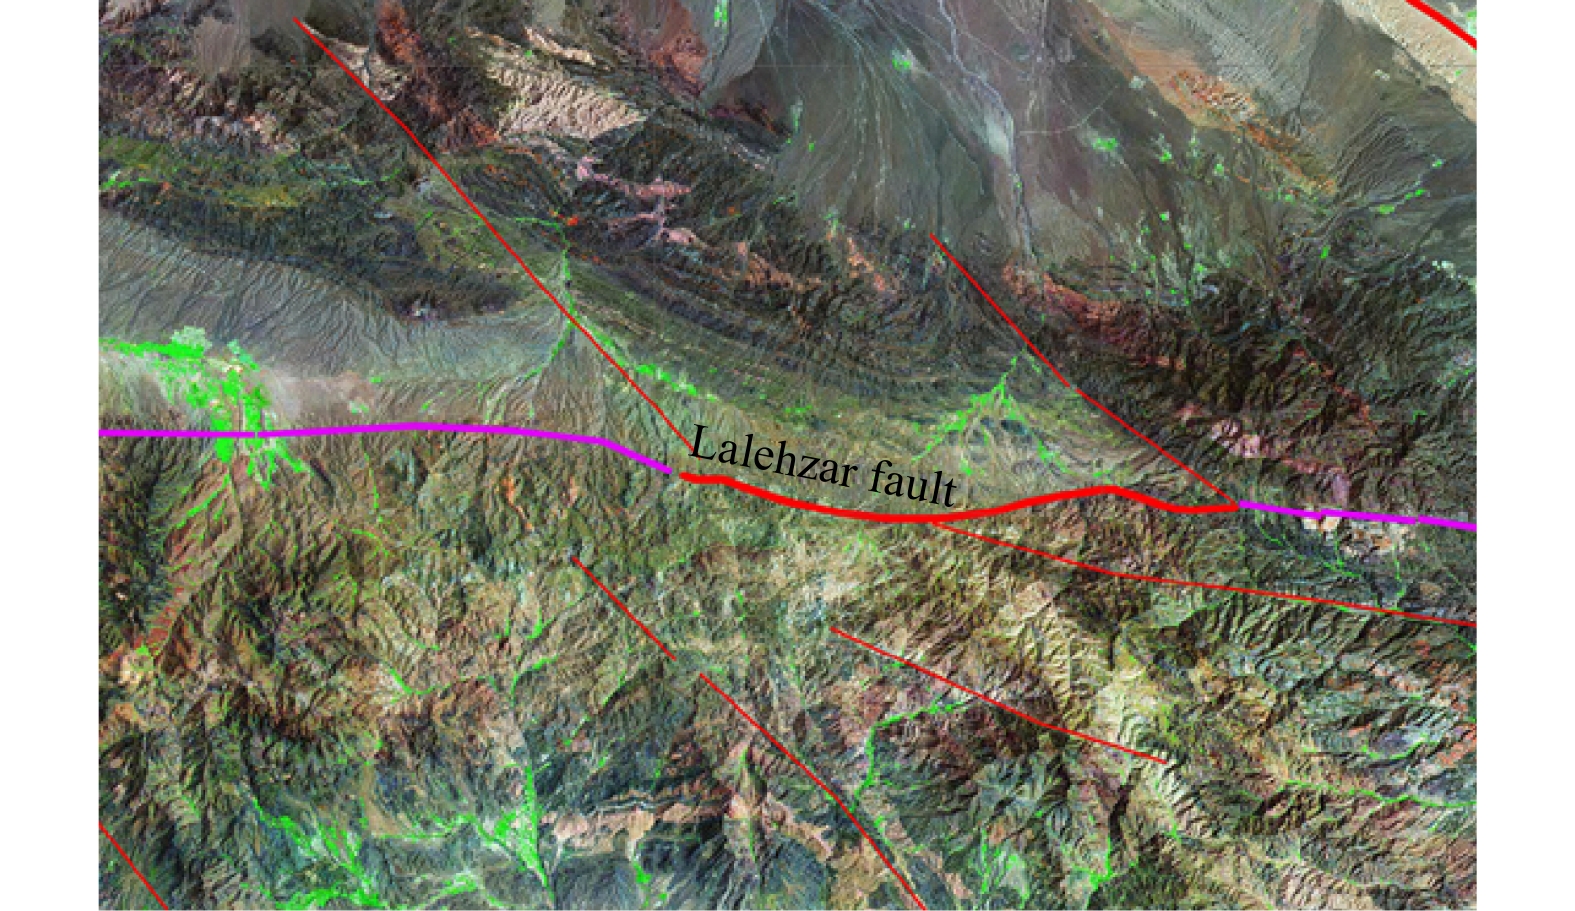
In terms of length, the positions for some of the previously mapped faults are overlapped with the traceable lineaments; thus, this implies that these faults can be mapped longer. The Lalehzar fault system, shown in Figure 6, is one of these cases. The Anar, Rafsanjan, and Gowk fault systems also are the other cases whose lengths seem to be longer.
Figure
6.
Example of the structural interpretation for the area of the Lalehzar fault system. As the positions for this previously mapped fault (thick red line) are overlapped with the traceable lineaments (purple lines), it implies that this fault can be mapped longer. This figure is limited to the coordinate ranges ~29.35˚N–29.7˚N and ~56.5˚E–57.4˚E. Minor lineaments are also shown with thin red lines.
Similar remakes have also been made about the West-Lut fault by Walpersdorf et al. (2014), investigating the present-day of kinematic in eastern Iran by using GPS data. They suggested that the West-Lut fault ranges further south of its Bam termination through the Sabzevaran fault.
The newly compiled fault map can serve wide implications for earthquake engineering studies such as seismic risk and hazard analyses (e.g., Baker, 2015), estimations of maximum credible earthquakes, and fault setback calculations for critical facilities (e.g., Batatian, 2002).
Using the framework of deterministic seismic hazard assessments (Baker, 2015), we provide an example of the calculations of peak ground acceleration (PGA) under rock conditions for a location in Faryab city being one of the most populous cities, located in the seismically active part of the region (28.09˚N, 57.22˚E).
The nearest active fault delineated on previously compiled maps (e.g., Oveisi et al., 2016) is a segment of the Main Zagros Reverse fault, with the maximum considered magnitude of 7.5 and the minimum epicentral distance of ~35 km. The second nearest fault in this regard is the Sabzevaran strike-slip fault with a minimum distance of ~48 km. By assuming ~50% of the total fault length as the rupture length and according to Wells and Coppersmith (1994), this fault is also able to produce a magnitude ~7.5 earthquake. This implies that the former fault produces larger spectral acceleration amplitudes at the location in comparison with the latter one; thus, we neglect the Sabzevaran fault for the following assessment. Using Akkar et al. (2014) attenuation model, a median PGA of ~0.16 g is estimated.
However, based on the new fault map, the nearest active fault to the considered site is the Mehr Gol fault with a minimum distance of ~9 km. According to Wells and Coppersmith (1994), this fault is capable of producing an M=6.9 event. It can also be noted that this fault experienced a strong MW=6.6 earthquake in 1999 (e.g., Mousavi-Bafrouei and Mahani, 2020). Anyway, the estimation of seismic hazard results in a median PGA of ~0.44 g, which is approximately two times more than the former estimate.
It seems that the new PGA value may be a more reasonable estimate for a location in such seismically active areas; thus, meaning the new fault map can improve the assessment of seismic hazard. It is also worth mentioning that the more distant larger-magnitude earthquake may produce larger acceleration at long fundamental periods (e.g., >0.8 s). Indeed, the estimations may somehow be rough; however, this does not affect the conclusion.
Overall, the fresh mapped faults are mostly neither short (<10 km) nor long (>100 km). According to Walpersdorf et al. (2014), this kind of fault seems to be created in response to stresses from block rotations during several million years; thus, they are somehow spatially associated with major ones. They can also be categorized as active (main) faults, based on evidence from geomorphologic features (e.g., Figure 5) and locations of past seismicity (Figure 7); still, they probably accommodate a smaller amount of strain and have a lower slip rate in comparison with the major faults. The history of earthquakes within Iran also indicates that these faults can usually be seismogenic and have produced many destructive events in Iran when the major faults were quiescent. Walpersdorf et al. (2014) highlighted some of these devastating earthquakes that occurred in central-east Iran, the strong events of 2003 Bam MW6.6 is a reasonable example for this case (e.g., Talebian et al., 2004). Indeed, these faults may be classified as young or immature ones, which are able to cause higher levels of stress drop compared to old faults (Manighetti et al., 2007).
Figure
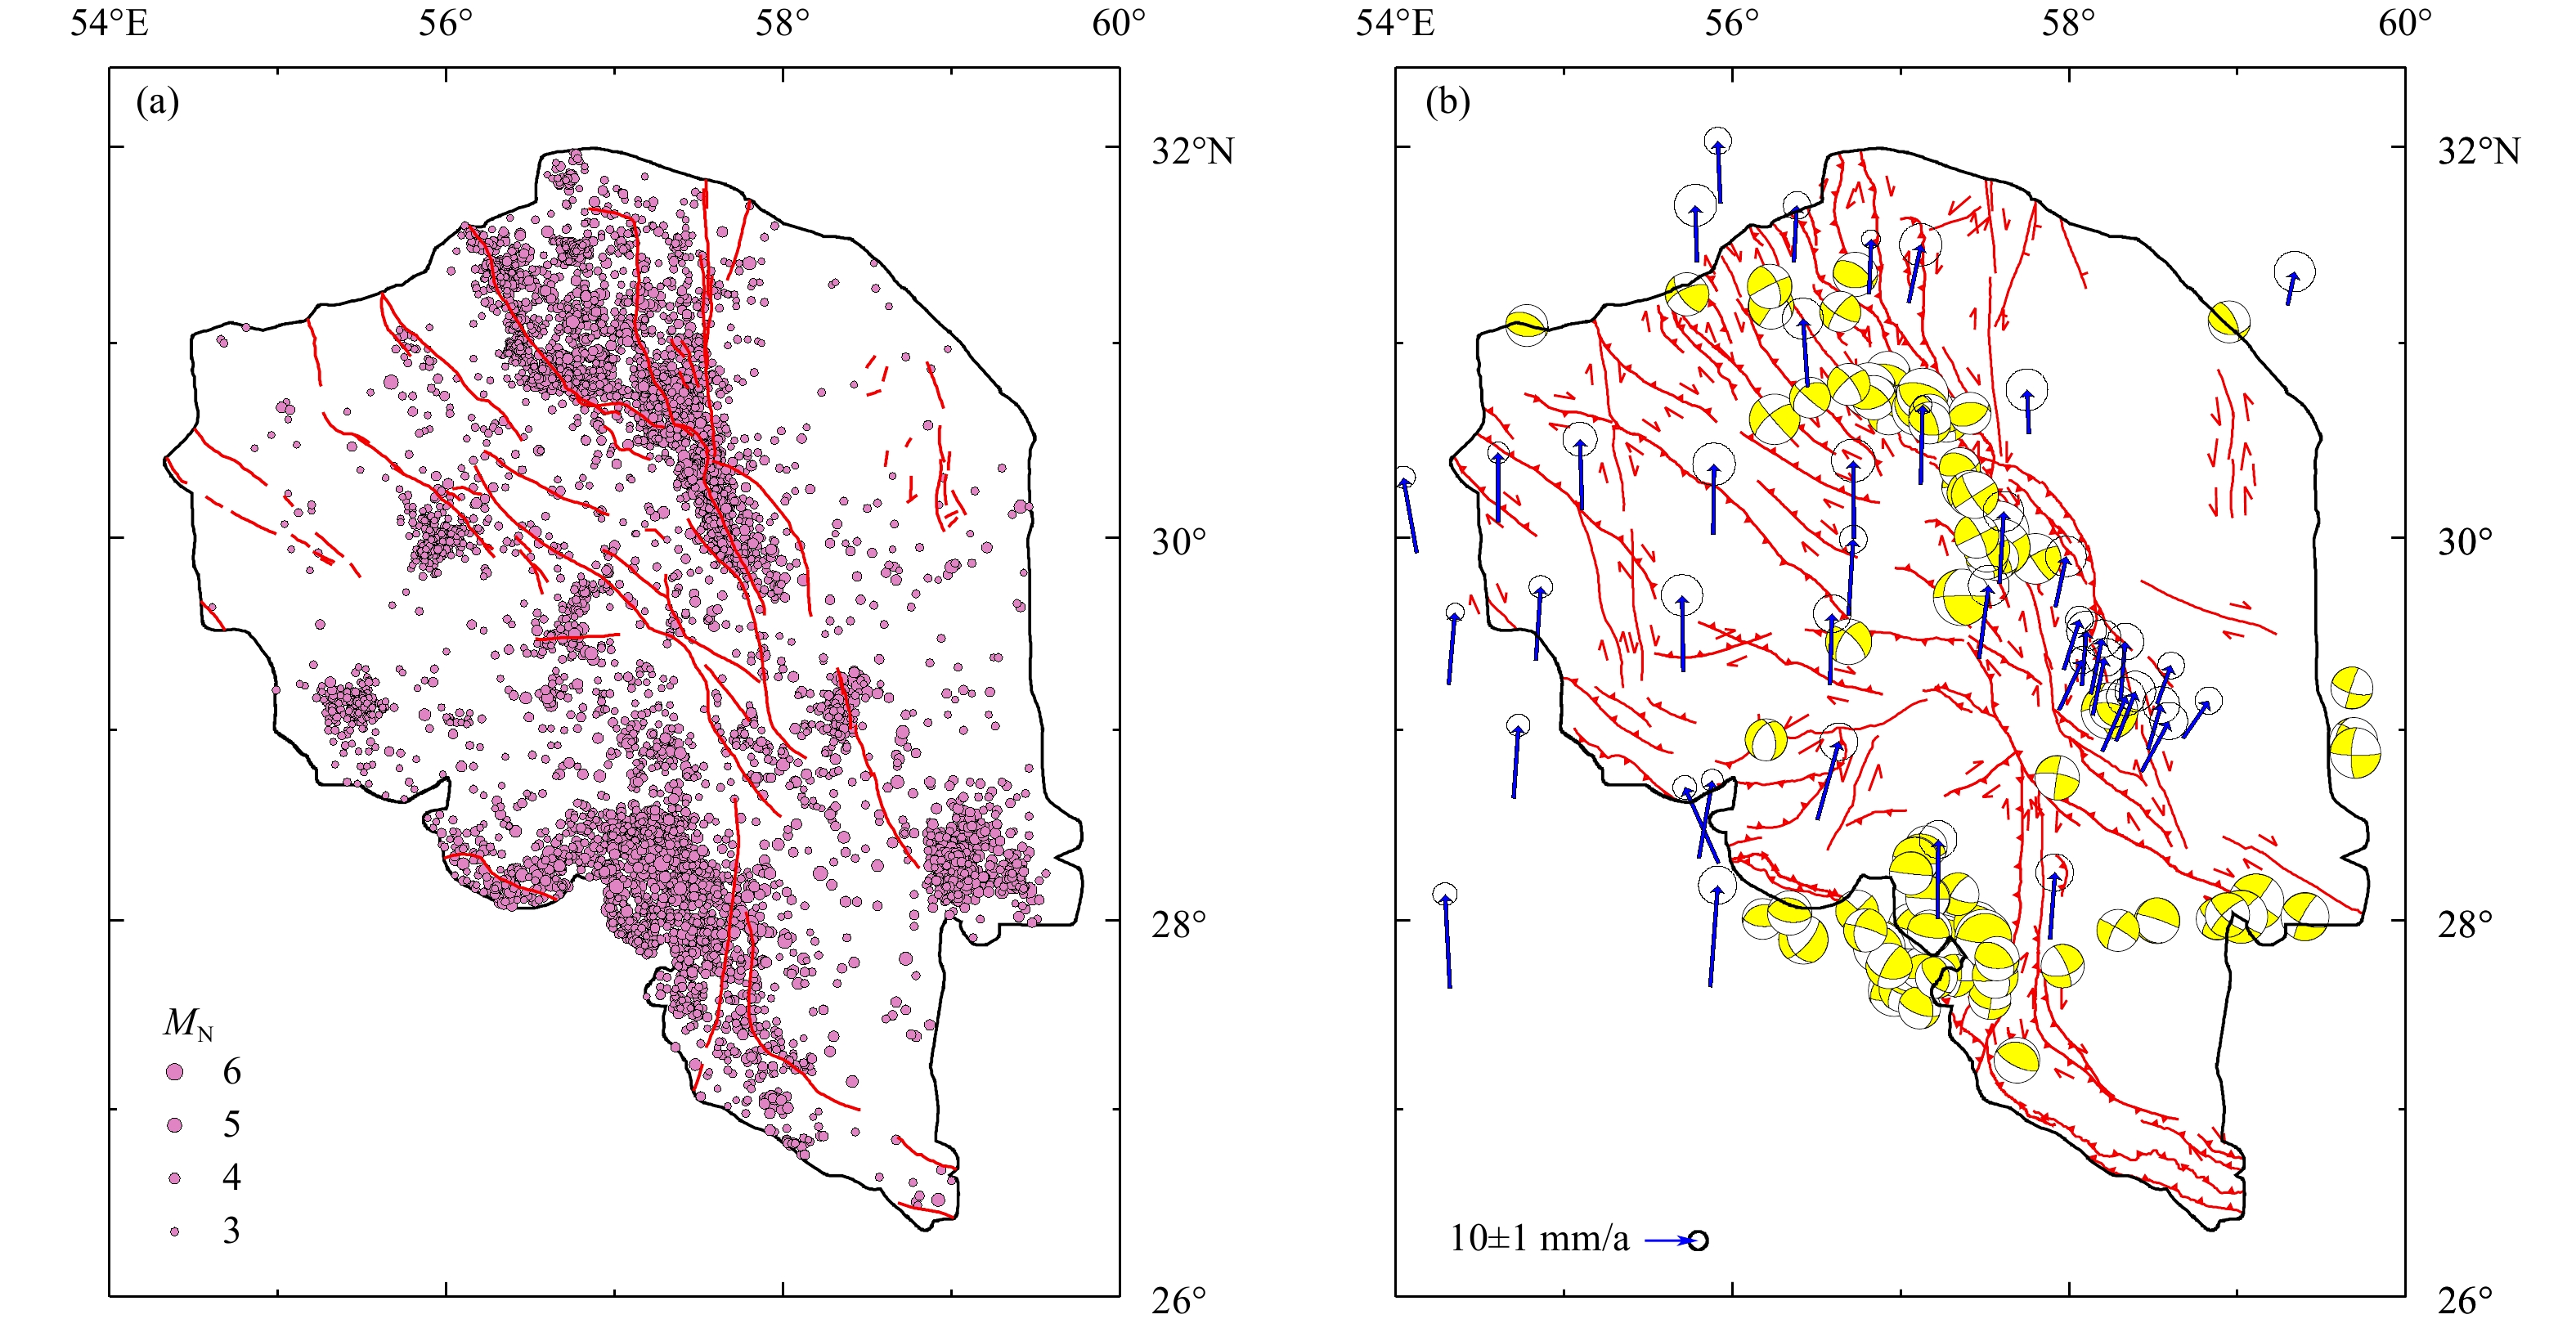
7.
Seismic map for the studied region. (a) The previously mapped active-faults (Hessami et al., 2003), which are overlain with recent background seismicity since 2006 with MN≥3 (~ 2900 events) from the Iranian Seismological Center. (b) The newly drawn faults overlain with Harvard centroid moment tensor (CMT) focal mechanisms (since 1977), and the velocity field data from Walpersdorf et al. (2014) and Zarifi et al. (2014).
4.2
Relationship between main faults and observed field data
Figure 7 shows the schematics for the maps of the previously mapped faults and the newly drawn ones. During the instrumental period (i.e., since 1900), the study region has experienced some destructive earthquakes. For instance, the Sirch MW7.3 event happened on the Sirch-Gowk fault in 1981 with ~3000 deaths, and more recently, the devastating Bam MW6.6 earthquake occurred on a high angle right-slip fault in the east part of the region (Berberian, 2005; Fu BH et al., 2004). This earthquake is the deadliest event (with ~31000 deaths) in Iran since the 1990 Rudbar MW7.4 earthquake. However, the recent background seismicity distributed in the entire region (Figure 7a) confirms that most of the faults in this region are more or less active. The statistics of seismic catalogs have also shown that earthquakes are mostly distributed in the upper part of the crustal thickness for central-east Iran (e.g., Engdahl et al., 2006).
The focal mechanisms shown in Figure 7b can imply that strike-slip faulting is more active in the study region. In particular, the focal mechanisms located at the upper-middle part of the region are associated with northwest-striking slip faults. Anyway, the events that happened in the southwest area have had a major dip-slip component; it seems to be dominantly organized by the compressive forces at the collision zone between Central Iran, Zagros, and Makran.
The newly mapped faults are associated with areas of both high and low levels of seismicity. For instance, the Rigan fault is located in the southwest region, where shows a relatively high seismic rate (Figure 7a). The southeast part of the study region is the other example of the areas with high levels of seismicity and poorly mapped faults.
Anyway, the newly drawn faults are mostly associated with partially defined areas, where accommodate low levels of seismicity. The northwest part of the region is one of these areas, over where the constancy of velocity rates (Figure 7b) can show that the deformation in this area is in a steady-state mode, and most of the structural units within which just move toward the north; still, sporadic strong events are likely to occur in this region (e.g., Foroutan et al., 2012). Based on GPS data (Walpersdorf et al., 2014), the ~NS shortening rate between the most lower and upper parts of the region is ~5 mm/a. To the east, arrows show an overall decrease in the north-directed velocity. The velocity rate is slower near the Lut block; still, this block is not completely rigid (Walpersdorf et al., 2014). For clarity, we have labeled the South and North Lut faults (numbers 117 and 92 in Figure 4, respectively); still, they are approximations and not exact borders. The Gowk-Nayband fault system (Walker and Jackson, 2002; Walker et al., 2010) can also be considered as the west limit of this block. Walpersdorf et al. (2014) also called this ~NS striking fault system the west Lut fault, divided into en-echelon segments implying lateral motion on the fault system. According to Naylor et al. (1986), it seems that reactivation of basement faults can yield the pattern of the en-echelon arrangement.
As a kind of geological structure, a fault network is one of the major controlling factors in hazard assessments (e.g., Baker, 2015). These kinds of structural discontinuities, often in active seismic zones, are expected to be areas of high seismic hazard. Indeed, the probability of seismic hazard, through time, can classically be considered to be greater in areas with rather high levels of seismic activity compared to those with low rates of seismicity. However, evidence from paleoseismology studies have expressed that faults in areas with low levels of seismic activity can also give the notably consequent threat of likely forthcoming strong events, depending on the status of their seismic cycles (e.g., Foroutan et al., 2012). Thus, this can support the necessity for geo-structural assessments in such regions, especially for the fault-based methodologies in impending earthquake-resistant buildings (e.g., Dehghan-Manshadi et al., 2020).
5.
Summary and conclusions
The focus of this investigation was to develop the active fault map in central-east Iran (Kerman province), using an approach so-called satellite image processing. In order to draw digitally-based faults, a suite of enhancing techniques has been applied to Landsat 8 data. As remote sensing cannot provide ideally structural maps and is no replacement for field mapping, we have alternatively verified the resulting map against the geological maps provided by the Geological Survey of Iran; this can reduce the associated uncertainties (Ramli et al., 2010).
The basis of the most faults presented in this study is by no means new, while parts of which have been systematized as parts of the previously compiled active-fault maps of Iran. Anyway, the new one is mapping the poorly exposed active faults, so-called secondary faults, being able to produce strong events.
The CMT focal mechanisms can imply that strike-slip faulting is more active in the study region, and the distribution of recent background seismicity approves that most of the regions of the faults are active. Besides, newly mapped faults are associated with areas of both high and low levels of seismicity; still, they are mostly located in poorly defined areas, where experienced low levels of seismicity.
As a final remark, it is believed that this kind of map can provide the basics for tectonics and future geological studies (e.g., Koike et al., 1995; Taylor and Yin A, 2009). It can take a significant impact on seismic risk and hazard zonation assessments. In particular, evidence from supplementary studies, such as paleoseismology investigations, can support the necessity for structural assessments in such a region, especially for the fault-based methodologies in impending earthquake-resistant structures.
Acknowledgments:
The authors would like to acknowledge the financial support of Kerman Provincial Gas Corporation & National Iranian Gas Company to conduct this research via Funding Sources of #062570 and #062571.
Aghanabati A, Eftekhar Nezhad J, Samimi Mamin M, Arshadi S, Manouchehri M, Afsharian Zadeh AM and Ghomashi A (1993a). Geological quadrangle map of Allahabad (1: 250000 series). Geological Survey of Iran, Tehran
Aghanabati A, Eftekhar Nezhad J, Hosseini AM, Afsharian Zadeh AM, Chaichi Z and Ghomashi A (1993b). Geological quadrangle map of Bam (1: 250000 series). Geological Survey of Iran, Tehran
Aghanabati A, Eftekhar Nezhad J, Samimi Mamin M, Arshadi S, Jamshidi K, Haddadan M and Afsharian Zadeh AM (1993c). Geological quadrangle map of Jahan Abad (1: 250000 series). Geological Survey of Iran, Tehran
Aghanabati A (2004). Geology of Iran. Geological Survey of Iran, Tehran
Akkar S, Sandıkkaya MA and Bommer JJ (2014). Empirical ground-motion models for point- and extended-source crustal earthquake scenarios in Europe and the Middle East. Bull Earthq Eng 12(1): 359–387. doi: 10.1007/s10518-013-9461-4
Alavi Naini F, Chance PN, Griffis RJ, Kluyvre HM, Meixner HM and Tirrul R (1981). Geological quadrangle map of Lakar Kuh (1: 250000 series). Geological Survey of Iran, Tehran
Ambraseys NN and Melville CP (1982). A History of Persian Earthquakes. Cambridge University Press, Cambridge, pp 219
Babakhani AR, Kholghi MH, Zadekabir H, Ghandchi M, Afsharian Zadeh AM, Jalilian M, Etemad N and Manouchehri M (1989). Geological quadrangle map of Ab-e-Sard (Nakhilab) (1: 250000 series). Geological Survey of Iran, Tehran
Babakhani AR, Alavi-Tehrani N, Valeh N, Yugoslavian GS, Ohanian T, Sabzei M, Afaghi A and Afsharian Zadeh AM (1992). Geological quadrangle map of Sabzevaran (1: 250000 series). Geological Survey of Iran, Tehran
Batatian D (2002). Minimum standards for surface fault rupture hazard studies, in Salt Lake County Geologic Hazards Ordinance. https://citeseerx.ist.psu.edu/index. Last accessed 1 January 2022
Berberian M, Jackson JA, Ghorashi M and Kadjar MH (1984). Field and teleseismic observations of the 1981 Golbaf-Sirch earthquakes in SE Iran. Geophys J Int 77(3): 809–838. doi: 10.1111/j.1365-246X.1984.tb02223.x
Berberian M, Jackson JA, Qorashi M, Talebian M, Khatib M and Priestley K (2000). The 1994 Sefidabeh earthquakes in eastern Iran: blind thrusting and bedding-plane slip on a growing anticline, and active tectonics of the Sistan suture zone. Geophys J Int 142(2): 283–299. doi: 10.1046/j.1365-246x.2000.00158.x
Berberian M, Jackson JA, Fielding E, Parsons BE, Priestley K, Qorashi M, Talebian M, Walker R, Wright TJ and Baker C (2001). The 1998 March 14 Fandoqa earthquake (MW6.6) in Kerman province, southeast Iran: re-rupture of the 1981 Sirch earthquake fault, triggering of slip on adjacent thrusts and the active tectonics of the Gowk fault zone. Geophys J Int 146(2): 371–398. doi: 10.1046/j.1365-246x.2001.01459.x
Berberian M (2005). The 2003 Bam urban earthquake: a predictable seismotectonic pattern along the western margin of the rigid Lut block, southeast Iran. Earthq Spectra 21(1S): 35–99.
Berberian M (2014). Earthquakes and Coseismic Surface Faulting on the Iranian Plateau: A Historical, Social, and Physical Approach. Elsevier, Oxford, pp 2–714
Bocco G, Mendoza M and Velázquez A (2001). Remote sensing and GIS-based regional geomorphological mapping—a tool for land use planning in developing countries. Geomorphology 39(3-4): 211–219. doi: 10.1016/S0169-555X(01)00027-7
Bonini M, Corti G, Sokoutis D, Vannucci G, Gasperini P and Cloetingh S (2003). Insights from scaled analogue modelling into the seismotectonics of the Iranian region. Tectonophysics 376(3-4): 137–149. doi: 10.1016/j.tecto.2003.07.002
Dehghan-Manshadi SH, Mirzaei N, Eskandari-Ghadi M, Shabani E and Mousavi-Bafrouei SH (2020). Time-dependent probabilistic seismic hazard assessment in Kerman and adjacent areas in the west of Lut block, Central-East Iran. Bull Eng Geol Environ 79(10): 5079 – 5094 . doi: 10.1007/s10064-020-01897-6
Engdahl ER, Jackson JA, Myers SC, Bergman EA and Priestley K (2006). Relocation and assessment of seismicity in the Iran region. Geophys J Int 167(2): 761 – 778 . doi: 10.1111/j.1365-246X.2006.03127.x
Fielding EJ, Wright TJ, Muller J, Parsons BE and Walker R (2004). Aseismic deformation of a fold-and-thrust belt imaged by synthetic aperture radar interferometry near Shahdad, southeast Iran. Geology 32(7): 577 – 580 . doi: 10.1130/G20452.1
Foroutan M, Meyer B, Sébrier M, Nazari H, Murray AS, Le Dortz K, Shokri MA, Arnold M, Aumaître G, Bourlès D, Keddadouche K, Solaymani Azad S and Bolourchi MJ (2014). Late Pleistocene-Holocene right slip rate and paleoseismology of the Nayband fault, western margin of the Lut block, Iran. J Geophys Res: Solid Earth 119(4): 3517 – 3560 . doi: 10.1002/2013JB010746
Foroutan M, Sébrier M, Nazari H, Meyer B, Fattahi M, Rashidi A, Le Dortz K and Bateman MD (2012). New evidence for large earthquakes on the Central Iran plateau: palaeoseismology of the Anar fault. Geophys J Int 189(1): 6 – 18 . doi: 10.1111/j.1365-246X.2012.05365.x
Fu BH, Ninomiya Y, Lei XL, Toda S and Awata Y (2004). Mapping active fault associated with the 2003 MW6.6 Bam (SE Iran) earthquake with ASTER 3D images. Remote Sens Environ 92(2): 153 – 157 . doi: 10.1016/j.rse.2004.05.019
Gomez C, Delacourt C, Allemand P, Ledru P and Wackerle R (2005). Using ASTER remote sensing data set for geological mapping, in Namibia. Phys Chem Earth, Parts A/B/C 30(1-3): 97 – 108 . doi: 10.1016/j.pce.2004.08.042
Hessami K, Jamali F and Abasi H (2003). Major active faults of Iran. International Institute of Earthquake Engineering and Seismology (IIEES), Tehran, Iran
Jackson J, Bouchon M, Fielding E, Funning G, Ghorashi M, Hatzfeld D, Nazari H, Parsons B, Priestley K, Talebian M, Tatar M, Walker R and Wright T (2006). Seismotectonic, rupture process, and earthquake-hazard aspects of the 2003 December 26 Bam, Iran, earthquake. Geophys J Int 166(3): 1270 – 1292 . doi: 10.1111/j.1365-246X.2006.03056.x
Javadi HR, Sheikholeslami MR, and Asadi Sarhar M (2013). Iran fault map on sedimentary-structural units (1∶1000000 Series). Geological Survey of Iran,Tehran
Karimzadeh S, Feizizadeh B and Matsuoka M (2017). From a GIS-based hybrid site condition map to an earthquake damage assessment in Iran: Methods and trends. Int J Disaster Risk Reduct 22: 23 – 36 . doi: 10.1016/j.ijdrr.2017.02.016
Koike K, Nagano S and Ohmi M (1995). Lineament analysis of satellite images using a Segment Tracing Algorithm (STA). Comput Geosci 21(9): 1091 – 1104 . doi: 10.1016/0098-3004(95)00042-7
Le Dortz K, Meyer B, Sébrier M, Nazari H, Braucher R, Fattahi M, Benedetti L, Foroutan M, Siame L, Bourlès D, Talebian M, Bateman MD and Ghoraishi M (2009). Holocene right-slip rate determined by cosmogenic and OSL dating on the Anar fault, Central Iran. Geophys J Int 179(2): 700 – 710 . doi: 10.1111/j.1365-246X.2009.04309.x
Mahdavi MA, Nazer NH, Aghanabati A, Soheili M, Mohajel M, Huckriede R, Haj Mola Ali A, Jamshidi K and Mohebbi AR (1996). Geological quadrangle map of Ravar (1: 250000 series). Geological Survey of Iran, Tehran
Manighetti I, Campillo M, Bouley S and Cotton F (2007). Earthquake scaling, fault segmentation, and structural maturity. Earth Planet Sci Lett 253(3-4): 429 – 438 . doi: 10.1016/j.jpgl.2006.11.004
Meyer B and Le Dortz K (2007). Strike-slip kinematics in central and eastern Iran: Estimating fault slip-rates averaged over the Holocene. Tectonics 26(5): TC5009.
Mirzaei N, Gao MT and Chen YT (1998). Seismic source regionalization for seismic zoning of Iran: major seismotectonic provinces. J Earthq Pred Res 7: 465– 495.
Mohajjel M (2009). Thin-skinned deformation near Shahdad, southeast Iran. J Asian Earth Sci 36(2-3): 146 – 155 . doi: 10.1016/j.jseaes.2009.05.002
Mountrakis D, Pavlides S, Zouros N, Astaras T, and Chatzipetros A (1998). Seismic fault geometry and kinematics of the 13 May 1995 Western Macedonia (Greece) earthquake. J Geodyn 26(2-4): 175–196
Mousavi-Bafrouei SH and Mahani AB (2020). A comprehensive earthquake catalogue for the Iranian Plateau (400 B. C. to December 31, 2018). J Seismol 24(3): 709 – 724 . doi: 10.1007/s10950-020-09923-6
Nakamura T, Suzuki S, Matsushima T, Ito Y, Hosseini SKT, Gandomi AJ and Aghda SMF (2004). Source fault of the 2003 Bam earthquake, southeastern Iran, inferred from aftershock distribution and its relation to the heavily damaged area: Existence of the Arg-e-Bam fault proposed. Geophys Res Lett 32(9): 1–5
Nalbant SS and Alptekin Ö (1995). The use of Landsat Thematic Mapper imagery for analysing lithology and structure of Korucu-Du[ggrave] la area in western Turkey. Int J Remote Sens 16(13): 2357 – 2374 . doi: 10.1080/01431169508954563
Naylor MA, Mandl G and Supesteijn CHK (1986). Fault geometries in basement-induced wrench faulting under different initial stress states. J Struct Geol 8(7): 737 – 752 . doi: 10.1016/0191-8141(86)90022-2
Nemati M and Gheitanchi MR (2011). Analysis of 2005 Dahuieh (Zarand) aftershock sequences in Kerman province, southeast Iran. J Earth Space Phys 37(1): 1– 9.
Oveisi B, Sadeghi M, Alikhanzadeh R, Sabour N and Heibati D (2016). Seismotectonic map of Iran. Geological Survey of Iran,Tehran
Ozturk B (2008). Preliminary seismic microzonation and seismic vulnerability assessment of existing buildings at the city of Nigde, Turkey. The 14th World Conference on Earthquake Engineering Beijing, China, pp 1–7
Ozturk B (2010). Seismic microzonation studies and vulnerability assessment of existing buildings at Nigde, Turkey. The 14th European Conference on Earthquake Engineering. Ohrid, N. Macedonia, pp 3638–3646
Ozturk B (2011). Application of preliminary microzonation and seismic vulnerability assessment in a city of medium seismic risk in Turkey. The 5th International Conference on Earthquake Geotechnical Engineering. Santiago, Chile, pp 1–11
Raeesi M, Zarifi Z, Nilfouroushan F, Boroujeni SA and Tiampo K (2017). Quantitative analysis of seismicity in Iran. Pure Appl Geophys 174(3): 793 – 833 . doi: 10.1007/s00024-016-1435-4
Ramli MF, Yusof N, Yusoff MK, Juahir H and Shafri HZM (2010). Lineament mapping and its application in landslide hazard assessment: a review. Bull Eng Geol Environ 69(2): 215 – 233 . doi: 10.1007/s10064-009-0255-5
Rashidi-Boshrabadi A, Khatib MM, Raeesi M, Mousavi SM and Djamour Y (2018). Geometric-kinematic characteristics of the main faults in the W-SW of the Lut Block (SE Iran). J Afr Earth Sci 139: 440 – 462 . doi: 10.1016/j.jafrearsci.2017.12.027
Regard V, Bellier O, Thomas JC, Bourlès D, Bonnet S, Abbassi MR, Braucher R, Mercier J, Shabanian E, Soleymani S and Feghhi K (2005). Cumulative right-lateral fault slip rate across the Zagros-Makran transfer zone: role of the Minab-Zendan fault system in accommodating Arabia-Eurasia convergence in southeast Iran. Geophys J Int 162(1): 177 – 203 . doi: 10.1111/j.1365-246X.2005.02558.x
Reza M, Abbasi MR, Javan-Doloei G and Sadidkhuy A (2014). Identifying fault of Mohammad Abad Rigan 20/12/2010 earthquake and its focal mechanism using aftershock analyses. Iran J Geophys 8(1): 59– 70.
Sabzehei M, Berberian M, Madjidi B, Hushmandzadeh A, Nowgole-Sadat MAA, Alavi-Tehrani N, Roshanravan J, Azizan H, Nazemzadeh M, Afaghi A, Afsharian Zadeh AM, Dehghani F and Ghomashi A (1994). Geological quadrangle map of Hadjiabad (1: 250000 series). Geological Survey of Iran, Tehran
Sahandi MR, Rahimzadeh F , Jamshidi K, Afsharian Zadeh AM and Manouchehri M (1992). Geological quadrangle map of Kerman (1: 250000 series). Geological Survey of Iran, Tehran
Sahandi MR, Soheili M, Mohajel M, Berberian M, Shahriari S, Hamzeh Pour B, Behruzi A, Hossein Khan Nazer N, Griffis R, Meixner H, Johns G, Abedian N, Hosseini Z, Afsharian Zadeh M and Chaichi Z (1993). Geological quadrangle map of Dehsalam (Chah Vak) (1: 250000 series). Geological Survey of Iran, Tehran
Samimi Mamin M, Morgan KH, McCall GJH, Huber H, Mohajer GA, Bailey PBH, Campe GC, Child R, Craik DI, Dalaei H, Elkington CR, Jones D, Kousha N, Locsei J, Mallett CW, McCormick CD, McKenzi A, Motamedi S, Novack V, Nunn GAG, Peterson MS, Pooyai N, Porter DJ, Power P, DeRosario PC, Smith GH, Swain CR, Wyatt JD, Simonian K, Deighton I, Peterson LW and Rudzinskas KK (1982). Geological quadrangle map of Taherui (1: 250000 series). Geological Survey of Iran, Tehran
Samimi Mamin M, Eftekhar Nezhad J, Arshadi S, Mahdavi M, Morgan KH, McCall GJH, Huber H, Bailey PBH, Campe GC, Child R, Craik DI, Dalaei H, Elkington CR, Jones D, Kousha N, Locsei J, Mallett CW, McCormick CD, McKenzi A, Motamedi S, Novack V, Nunn GAG, Peterson MS, Porter DJ, DeRosario PC, Wyatt JD, Simonian K, Deighton I, Peterson LW and Rudzinskas KK (1983a). Geological quadrangle map of Fannuj (1: 250000 series). Geological Survey of Iran, Tehran
Samimi Mamin M, Morgan KH, McCall GJH, Huber H, Bailey PBH, Campe GC, Child R, Craik DI, Dalaei H, Jones D, Mallett CW, McCormick CD, McKenzi A, Motamedi, Nunn GAG, Peterson MS, Pooyai N, Porter DJ, Power P, Smith GH, Swain CR, Wyatt JD, Simonian K, Deighton I, Peterson LW and Rudzinskas KK (1983b). Geological quadrangle map of Minab (1: 250000 series). Geological Survey of Iran, Tehran
Sarp G (2005). Lineament analysis from satellite images, north-west of Ankara. Dissertation, Middle East Technical University, Turkey
Savidge E, Nissen E, Nemati M, Karasözen E, Hollingsworth J, Talebian M, Bergman E, Ghods A, Ghorashi M, Kosari E, Rashidi A and Rashidi A (2019). The December 2017 Hojedk (Iran) earthquake triplet—sequential rupture of shallow reverse faults in a strike-slip restraining bend. Geophys J Int 217(2): 909 – 925 . doi: 10.1093/gji/ggz053
Shah AA, Zhafri MN, Delson J and Navakanesh B (2018). Major strike-slip faults identified using satellite data in central Borneo, SE Asia. Geosciences 8(5): 156 . doi: 10.3390/geosciences8050156
Sistanipour A and Arian M (2015). Geometric Analysis of Davaran Fault System, Central Iran. Open J Geol 5(6): 458 – 469 . doi: 10.4236/ojg.2015.56043
Soheili M and Yugoslavian Gs (1981). Geological quadrangle map of Anar (1: 250000 series). Geological Survey of Iran, Tehran
Soheili M, Yugoslavian Gs, Abdollahi MR, Eghlimi B, Sabzehei M, Eshraghi S, Roshan Ravan J. Mohaggel M, Khannazar N, Hosseini Z, Ghaemi J, Mohebbi AR and Ghomashi A (1995). Geological quadrangle map of Sirjan (1: 250000 series). Geological Survey of Iran, Tehran
Süzen ML and Toprak V (1998). Filtering of satellite images in geological lineament analyses: An application to a fault zone in Central Turkey. Int J Remote Sens 19(6): 1101 – 1114 . doi: 10.1080/014311698215621
Talebian M, Fielding EJ, Funning GJ, Ghorashi M, Jackson J, Nazari H, Parsons B, Priestley K, Rosen PA, Walker R and Wright TJ (2004). The 2003 Bam (Iran) earthquake: Rupture of a blind strike-slip fault. Geophys Res Lett 31(11): L11611.
Talebian M, Biggs J, Bolourchi M, Copley A, Ghassemi A, Ghorashi M, Hollingsworth J, Jackson J, Nissen E, Oveisi B, Parsons B, Priestley K and Saiidi A (2006). The Dahuiyeh (Zarand) earthquake of 2005 February 22 in central Iran: reactivation of an intramountain reverse fault. Geophys J Int 164(1): 137 – 148 . doi: 10.1111/j.1365-246X.2005.02839.x
Taylor M and Yin A (2009). Active structures of the Himalayan-Tibetan orogen and their relationships to earthquake distribution, contemporary strain field, and Cenozoic volcanism. Geosphere 5(3): 199 – 214 . doi: 10.1130/GES00217.1
Vahdati Daneshmand F, Eftekhar Nezhad J, Berberian M, Sahbaei M, Moghimi J, Afsharian Zadeh A and Manouchehri M (1990). Geological quadrangle map of Jaz Murian (1: 250000 series). Geological Survey of Iran, Tehran
Vahdati Daneshmand F, Zohrehbakhsh A, Djokovic I, Dimitrijevic MN, Srdic A, Jamshidi K, Afsharian Zadeh A, Dehghani F, Chaichi Z, Sahbaei M and Ghomashi A (1992). Geological quadrangle map of Rafsanjan (1: 250000 series). Geological Survey of Iran, Tehran
Valeh N, Alavi-Tehrani N, Sabzehei M, Majidi B, Watters WA, Etminan H, Ricou M, Amidi M and Ghorashi M (1985). Geological quadrangle map of Neiriz (1: 250000 series). Geological Survey of Iran, Tehran
Vernant PH, Nilforoushan F, Hatzfeld D, Abbassi MR, Vigny C, Masson F, Nankali H, Martinod J, Ashtiani A, Bayer R, Tavakoli F and Chéry J (2004). Present-day crustal deformation and plate Kinematics in the Middle East constrained by GPS measurements in Iran and northern Oman. Geophys J Int 157: 381 – 398 . doi: 10.1111/j.1365-246X.2004.02222.x
Walker F and Allen MB (2012). Offset rivers, drainage spacing and the record of strike-slip faulting: The Kuh Banan Fault, Iran. Tectonophysics (530–531): 251– 263.
Walker R and Jackson J (2002). Offset and evolution of the Gowk Fault, S. E. Iran: A major intra-continental strike-slip system. J Struct Geol 24(11): 1677 – 1698 . doi: 10.1016/S0191-8141(01)00170-5
Walker R and Jackson J (2004). Active tectonics and late Cenozoic strain distribution in central and eastern Iran. Tectonics 23(5): TC5010.
Walker RT (2006). A remote sensing study of active folding and faulting in southern Kerman province, S. E. Iran. J Struct Geol 28(4): 654 – 668 . doi: 10.1016/j.jsg.2005.12.014
Walker RT, Gans P, Allen MB, Jackson J, Khatib M, Marsh N and Zarrinkoub M (2009). Late Cenozoic volcanism and rates of active faulting in eastern Iran. Geophys J Int 177(2): 783 – 805 . doi: 10.1111/j.1365-246X.2008.04024.x
Walker RT, Talebian M, Sloan RA, Rasheedi A, Fattahi M and Bryant C (2010). Holocene slip-rate on the Gowk strike-slip fault and implications for the distribution of tectonic strain in eastern Iran. Geophys J Int 181(1): 221 – 228 . doi: 10.1111/j.1365-246X.2010.04538.x
Walpersdorf A, Manighetti I, Mousavi Z, Tavakoli F, Vergnolle M, Jadidi A, Hatzfeld D, Aghamohammadi A, Bigot A, Djamour Y, Nankali H and Sedighi M (2014). Present-day kinematics and fault slip rates in eastern Iran, derived from 11 years of GPS data. J Geophys Res: Solid Earth 119(2): 1359 – 1383 . doi: 10.1002/2013JB010620
Wells DL and Coppersmith KJ (1994). New empirical relationships among magnitude, rupture length, rupture width, rupture area, and surface displacement. Bull Seismol Soc Am 84(4): 974– 1002.
Yassaghi A (2006). Integration of Landsat imagery interpretation and geomagentic data on verification of deep-seated transverse fault lineaments in SE Zagros, Iran. Int J Remote Sens 27(20): 4529 – 4544 . doi: 10.1080/01431160600661283
Yazdi M, Sadati N, Matkan AA and Ashoorloo D (2011). Application of remote sensing in monitoring of faults. Int J Environ Res 5(2): 457– 468.
Zarifi Z, Nilfouroushan F and Raeesi M (2014). Crustal stress map of Iran: insight from seismic and geodetic computations. Pure Appl Geophys 171(7): 1219 – 1236 . doi: 10.1007/s00024-013-0711-9
Table
1.
List of the fault segments shown in Figure 4 in accordance with their numbers (No.). In the fault mechanism columns (FM), the letters N, R, DR, DS, and SS stand for normal, reverse (or thrust), dextral reverse, dextral strike-slip, and sinistral strike-slip, respectively. Each letter marked by ‘*’ indicates that the corresponding fault mechanism is suggested by remote sensing (e.g., evidence from abnormally geomorphologic features like displacement of drainage patterns or pull-apart basins), and no particular information has been found, in this regard, on neither official geological maps nor other published references; still, the faults are somehow traceable on the geological maps.

 DownLoad: